CHAPTER 1: ASIA-PACIFIC OUTLOOK
Expectations for Regional Growth Lowered
After the sharp recovery in 2021 from the pandemic-driven recession, growth is expected to slow to 2.6 percent this year and again to 2.5 percent in 2023, well below the 5.1 and 3.5 percent growth forecast last year (Figure 1.1). As worrying as lower growth expectations are, the region is facing a seemingly an ever-expanding list of concerns that need to be addressed.
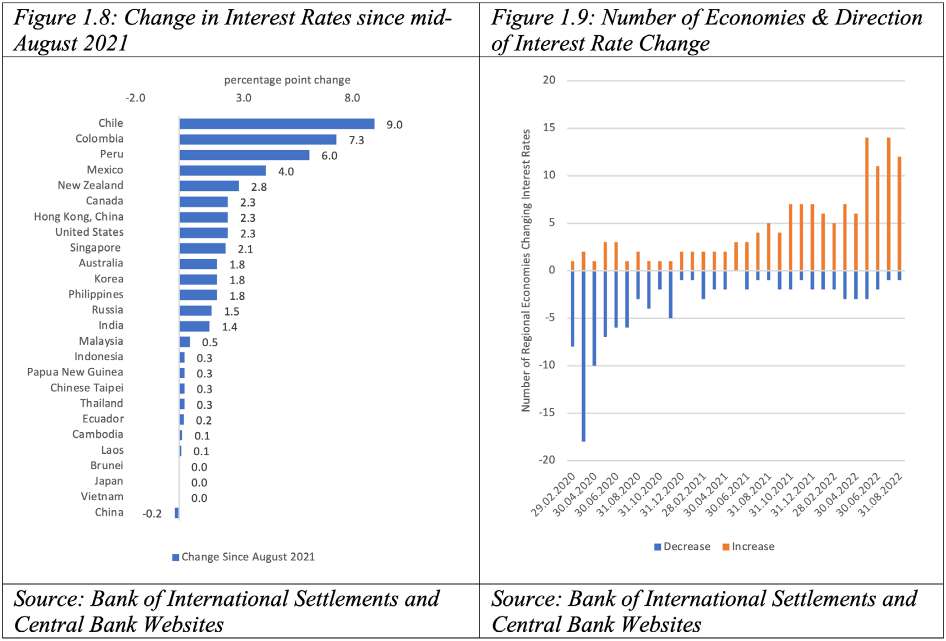
At this point in time a year ago, there were ongoing debates on whether rising prices would be a transitory or more persistent. As early as the summer of 2021, regional Central Banks were beginning to tighten monetary policy (Figure 1.9). The outlook for inflation has been compounded by the impact of the war in Ukraine which has led to sharp increases in energy and food prices as well as increased uncertainty and risks of geopolitical fragmentation.
As policy-makers continue to fight the numerous fires that are breaking out, it is just as important to bear in mind the longerterm issues and measures that will help to address the concerns of all stakeholders. This is where regional cooperation needs to play a role through having both a longer-term perspective as well as one on the international and systemic consequences of economic policy.
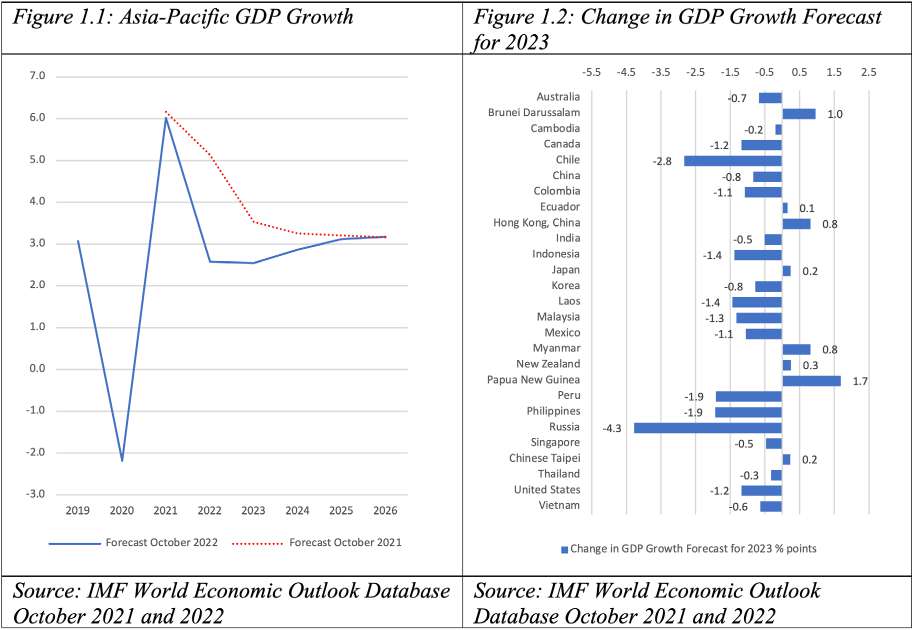
The lower expectations for growth come mainly from revisions to expected growth for the region’s two largest economies: the United States and China but also Russia (Figure 1.2). The lowered estimates for these three economies have reduced the region’s anticipated growth by 2 percentage points. This downturn is reflected in the views of the regional policy community which have shifted dramatically. Just 12 months ago, 55 percent of respondents to the Pacific Economic Cooperation Council’s annual survey expected stronger growth for the global economy, but now 60 percent expect weaker growth (Figure 1.3). Last year’s positive views as economies were recovering from the depths of the pandemic-induced recession have been replaced by a deep pessimism across the region. This compares to the post-Global Financial Crisis period when respondents were on the net positive for 2009 and 2010 before turning negative in 2011. In short, the recovery from the pandemic seems likely to be short-lived and the longer-term outlook is cloudy. Several leading institutions also have slashed their forecasts for economic growth; for example, the World Bank cut its forecast for East Asia and Asia for 2022 from 5.0 to 3.2 percent, while the OECD lowered its lesser optimistic forecast for 2022 from 4.5 percent back in December to 3 percent in its latest outlook. Respondents were only positive about the prospects for growth in Southeast Asia and India with 45 percent expecting stronger growth for Southeast Asia and 37 percent for India. (Figure 1.4).
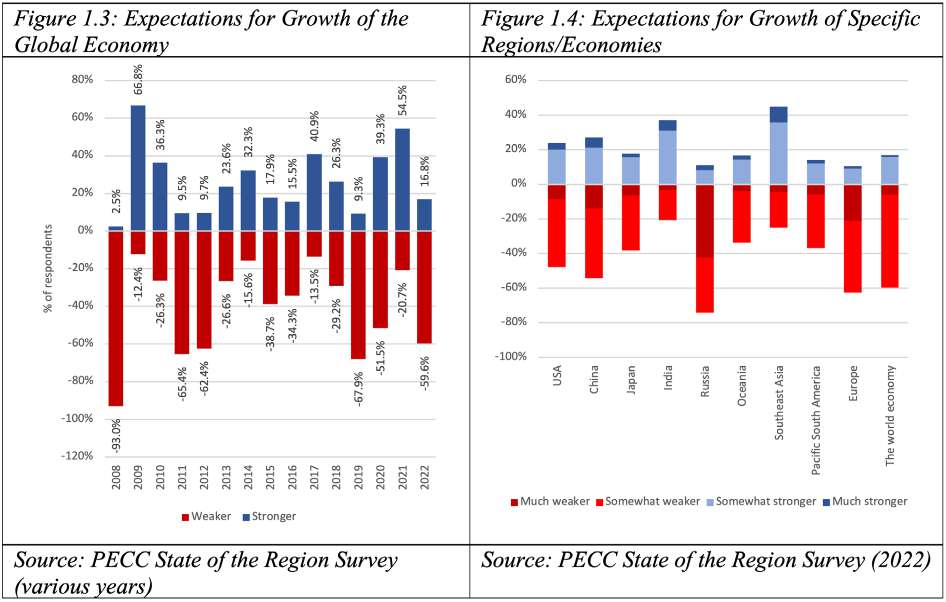
This suggests that even those growing parts of the region will face severe headwinds from other parts and the world. Regional economies will face a year of slower growth in 2023 with a continuing risk that forecasts for 2023 could revised downwards further. More respondents tended to think growth would be ‘somewhat weaker’ rather than ‘much weaker’ except for Russia. Ultimately, the path of growth will depend on whether governments can get inflation under control without plunging their economies and the world into a sustained recession. APEC members have, through the Putrajaya Vision 2040, a framework for addressing the downside risks that regional economies face – especially for boosting long-term growth potential -but this will only contribute if members faithfully implement the commitments they have made in the Aotearoa Plan of Action to achieve “an open, dynamic, resilient and peaceful Asia-Pacific community by 2040, for the prosperity of all our people and future generations”.
Risks to Growth
As negative as the forecasts and views on the economic outlook already are, risks still remain heavily tilted to the downside – that growth prospects and performance could become even worse than current expectations. The biggest concern is inflation with over 50 percent of respondents selecting it as a top 5 risk to growth.
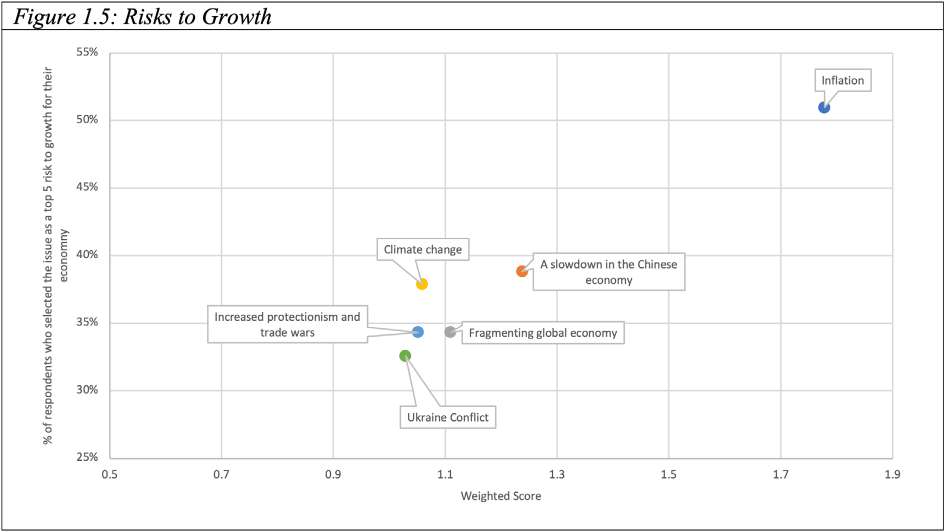
In addition to inflation, the other top risks to growth are:
- A slowdown in the Chinese economy
- Fragmenting global economy
- Climate change
- Increased protectionism and trade wars
- Ukraine Conflict
As shown in Figure 1.5, a significantly higher percentage of respondents (51 percent) consider inflation as a top risk to growth for their economies compared to the other top risks. However, results differed substantially among sub-regions, for example respondents from Northeast Asia consider future waves of Covid-19 as a top risk, while it ranked much lower for other parts of the region. Similarly, 48 percent of respondents from North America consider the Ukraine Conflict to be a top 5 risk to growth making it their second highest risk, but in Pacific South America the figure was 30 percent, making it their 7th highest risk.
The top risks selected by respondents reflect ultimately concerns over the fragmentation of the global economy. This is closely connected with the risk of increased protection, but goes beyond it, foreseeing a further decoupling of the global economy as countries strive for advantage in high tech and locally-based manufacturing. Reduced efficiency adds to inflationary pressures. While inflation might seem to the public to be disconnected from the other risks, some estimates suggest that a 2-percentage point reduction in tariff-equivalent barriers would deliver a one-time decrease in CPI inflation of 1.3 percentage point in the United States, with the opposite also being true. 1
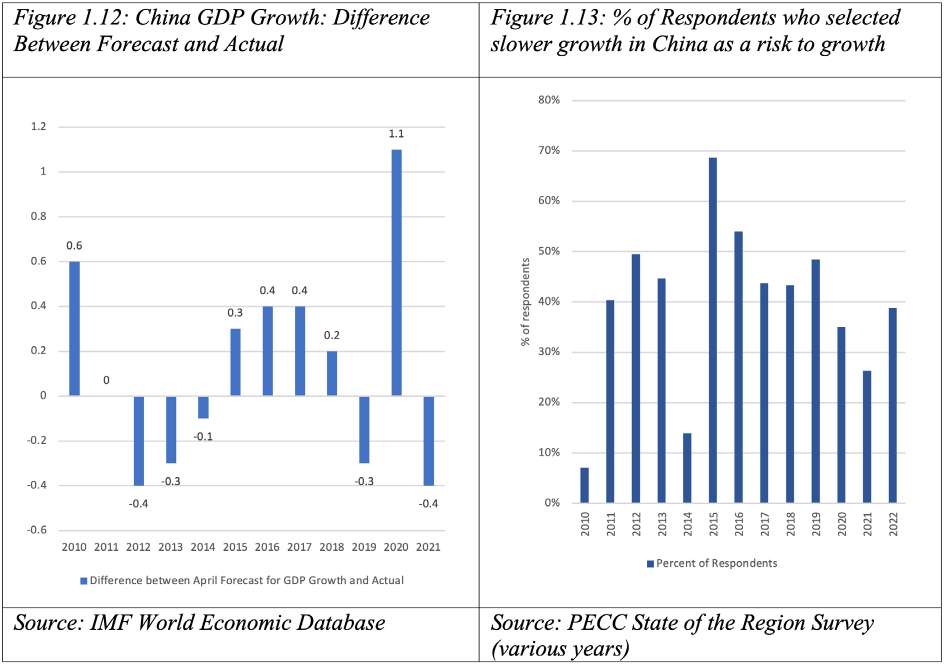
A slowdown in China has often been a top 5 risk to growth among the regional policy community over the past few years (see Figure 1.15). China has, like many regional economies, been integrating into the global economy, with trade as a share of GDP rising from 22 percent in 1990 to 37 percent in 2021. Concerns over a fragmenting global economy and increased protectionism undoubtedly will weigh heavily. More proximate concerns include the impact of the Covid-19 pandemic and whether further lock-downs will hamper the recovery of the region’s second largest economy.
The fragmenting global economy and the Ukraine Conflict will make it more difficult to deal with problems that by their nature require global solutions such as climate change. The IMF’s Managing Director described the current situation as a ‘confluence of calamities’ with the world’s ability to respond to financial market volatility, climate change, and food security “hampered by another consequence of the war in Ukraine—the sharply increased risk of geoeconomic fragmentation.”2 The conflict itself, of course, has resulted in economic sanctions that not only discourage international investment and trade, threatening supplies of materials such as copper, nickel, and lithium that are considered essential to the transition of a green economy. Moreover, it casts a pall on all cooperative agendas, making it difficult to separate out cooperation in such areas as climate change and pandemic-fighting from the highly competitive policies in other areas.
With growth forecasts for the next 5 years nearly a full percentage point lower than during the 2010s, and the region still a long way off from achieving its goals of an ‘open, dynamic, resilient and peaceful Asia-Pacific community by 2040’, and this places urgency on the need to double down on growth enhancing policies. The World Bank argues that growth could be weak for a prolonged period because its structural determinants have been undermined citing formidable demographic challenges, weak investment, and reduced productivity growth.
1 https://www.piie.com/sites/default/files/documents/pb22-4.pdf
2 https://www.imf.org/en/Blogs/Articles/2022/05/22/blog-why-we-must-resist-geoeconomic-fragmentation
Inflation
Inflation is by far the top risk on the minds of the regional policy community. It was the top risk to growth for all sub-regions and stakeholders, albeit with some significant differences. Respondents from Pacific South America were far more concerned about inflation than their peers in Northeast Asia and more government respondents were concerned than non-government.
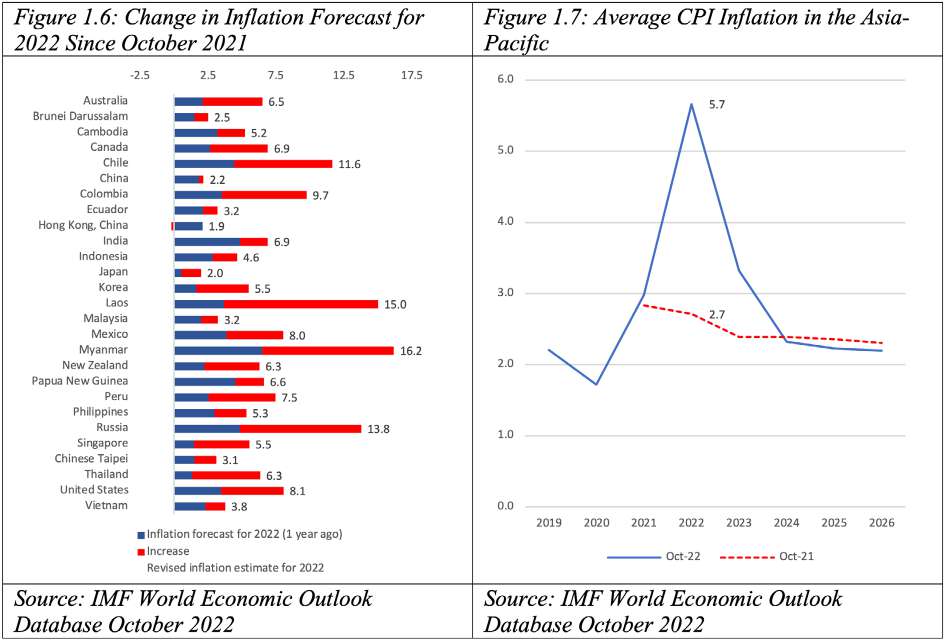
In last year’s survey of the regional policy community, inflation was ranked 7th in the list of risks, albeit with the business community then more concerned than other stakeholders. Then regarded more as a temporary phenomenon associated with supply glitches and greater demand as a result of the pandemic spending, it now appears as both more severe and persistent, reflecting less transitory structural patterns. As an indication of the impact that developments in the first half of the year have had on inflation forecasts, a year ago, only one regional economy was expecting inflation at above 5 percent, today 18 regional economies are expecting inflation for 2022 to be above 5 percent. There have been upwards revisions to expected inflation for 2022 across almost all regional economies (Figure 1.6). Average CPI inflation in the region this year is now expected to be 5.7 percent in 2022 and 3.3 percent next year, reflecting upwards revisions of 2.9 percentage points and 0.9 percent respectively (Figure 1.7).
Rising Interest Rates
As part of the battle against inflation, interest rates have been steadily rising since July 2021. Central Banks in Pacific South American economies raised rates dramatically over the last 12 months, with Chile leading the way increasing from 0.75 to 9.75 percent over the 12 months from August 2021 to August 2022 (Figure 1.8). Since the end of August 2022 monetary authorities in the region have continued to raise rates even further with the Banco Central de Chile announcing a further 100 basis point increase citing higher global inflation and persistence; uncertainty over the future path of the US Federal Reserve’s policy path and its impact on emerging economies; and the continued appreciation of the US dollar. 3 Figure 1.9 shows the number of economies that have changed interest rates and their direction over the past 2 years. During the pandemic authorities felt the need to decrease rates to stimulate growth but now we are seeing the reversal of this with recent increases in many economies for example: Australia; Hong Kong, China; Indonesia; Malaysia; the Philippines; and the United States.4 Average interest rates throughout the region is now well above prepandemic levels.
3 https://www.bcentral.cl/en/content/-/details/monetary-policy-meeting-september-2022#:~:text=At%20its%20monetary%20policy%20meeting,basis%20 points%2C%20to%2010.75%25
4 https://asia.nikkei.com/Economy/Philippines-Indonesia-lift-interest-rates-again-to-curb-inflation
Capital Flows
In spite of the increase in interest rates across most of the Asia-Pacific, regional currencies have lost, on average, 8.4 percent in value against the US dollar. The depreciation of currencies has not been even, with the trade weighted average of currencies from economies in Pacific South America down against the US dollar by 22 percent and Southeast Asia by 10 percent (Figure 1.10). However, this is not necessarily an emerging market phenomenon with the region’s advanced economies dropping by 11 percent compared to emerging markets 6.5 percent, nor is it limited to the region with the Euro and British Pound also down against the appreciating US dollar. The outlier in this story is the Russian ruble which is the only regional currency to appreciate against the US dollar since the beginning of the pandemic.
Surprisingly, neither reduced foreign exchange reserves nor unfavorable currency shifts were considered as top risks to growth by survey respondents, in spite of concerns expressed in 2021 by international institutions. It may be that the regional policy community does not consider these issues top of mind. For example, the ASEAN+3 Macroeconomic Research Office notes that ‘while financial markets are expecting a more hawkish stance by the US Fed, a sharper-than-expected monetary policy normalization in the United States could lead to a premature tightening in global financial conditions, with potential implications for interest rates, capital outflows, and financial market volatility in the region,” it goes on to warn that “regional policymakers will have to undertake a crucial balancing act—avoiding a premature withdrawal of policy support in view of the still nascent economic recovery.”
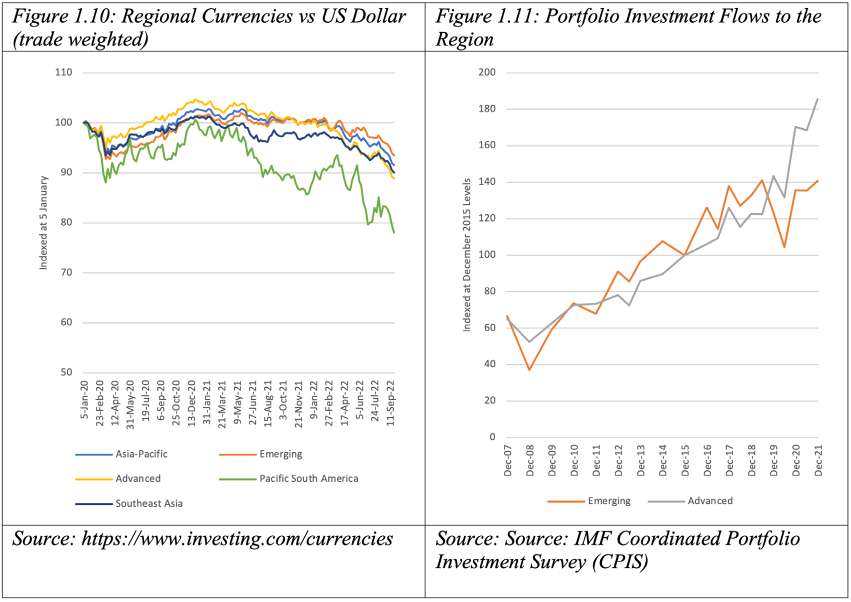
In addition to inflation and currency depreciations, the region’s emerging economies face a third related issue – capital outflows. As shown in Figure 1.11, while portfolio flows into the region fell in June 2020, they quickly recovered by the end of December. The IMF’s Coordinated Portfolio Investment Survey (CPIS) shows that in spite of the volatility, overall flows to regional emerging markets recovered to pre-pandemic levels at the end of 2021, but according to news reports based on data from the Institute of International Finance, emerging markets have suffered a record breaking outflow since February 24 comparable to the “taper tantrum” of 2013.5 At that time, between December 2012 and June 2013, total portfolio investments into the region’s emerging markets fell by a remarkable US$123 billion or about 5.4 percent.
5 https://www.reuters.com/markets/europe/embattled-emerging-markets-face-fresh-pain-us-rate-hikes-2022-09-27/
Slowdown in the Chinese Economy
The only economy that has reduced interest rates over the past year is China where they have been cut by 0.2 percentage points, with the most recent reduction coming as recently as August 2022,6 and some arguing that there may be still more room for easing in the region’s second largest economy. The need for monetary easing comes as the Chinese forecast for growth this year was cut by 1.1 percentage points in the IMF’s most recent forecasts.
An economic slowdown in China has often been regarded as a top 5 risk to growth among the regional policy community over the past few years (see Figure 1.13). Figure 1.12 shows the difference between growth forecast from April of that year as well as actual growth. Slower growth is a natural phenomenon as an economy matures and as it faces stronger demographic headwinds. But over the past 10 years, China’s growth has been just as likely to surprise on the upside as the down. While the forecast for China’s growth next year was downgraded from 5.1 percent to 4.6 percent, it still marks an acceleration from 2022 with growth estimates for this year at 3.3 percent. One reason why a slowdown in China has appears as a potential risk to growth for many regional economies is its increasing importance as a trade and investment partner for most. China is now the second largest economy in the region, and a top 5 trading export destination for all regional economies. Slower growth, however, is not the same as no growth, and China’s growth rate seems likely to converge over time with that of advanced economies such as Korea, Japan, Canada, and the United States. The base from which this growth takes place is also larger meaning that the impact on other economies is less than the reduced percentage figure might suggest.
6 https://www.reuters.com/markets/europe/embattled-emerging-markets-face-fresh-pain-us-rate-hikes-2022-09-27/
Fragmenting Global Economy
This is the first year that a ‘fragmenting global economy’ has been included in the list of risks (Figure 1.14). Just over one third of respondents selected a fragmenting global economy as a risk to growth making it the 4th most frequent risk to growth. In addition to the consistent concerns expressed over the years on rising protectionism and slowing trade this is of great concern to the region given how much it has benefitted from integration. Figure 1.14 shows the differences in the results for different sub-regions. Respondents from Southeast Asia were the most concerned, followed by North America and then Northeast Asia. This demonstrates that respondents in all sub-regions believe that they benefit from the open integration process that the region has promoted. On a weighted score basis, respondents from Northeast Asia were the most concerned – a result of a high percentage of them selecting it as the most serious risk to their growth.
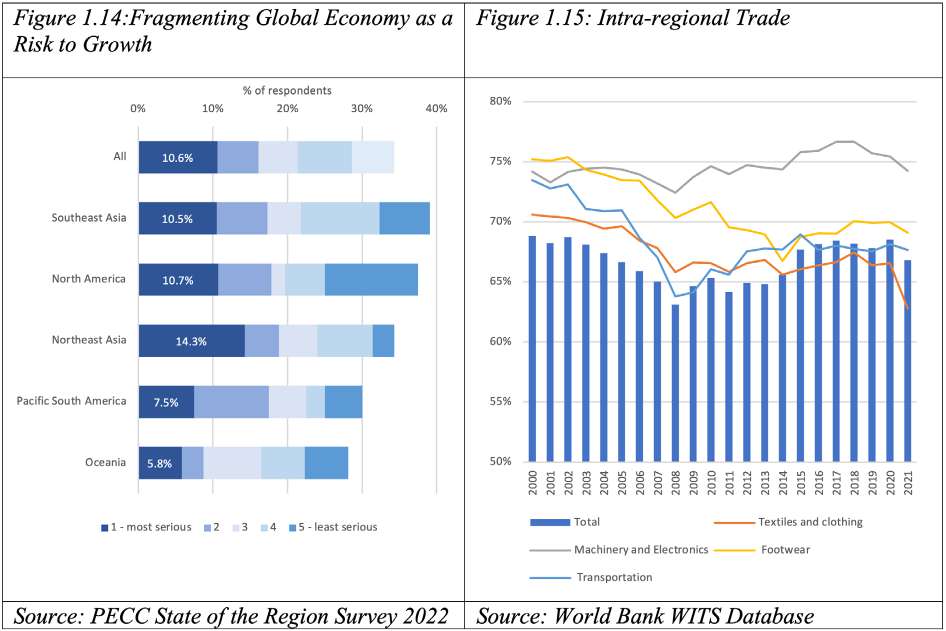
One question is whether we are seeing significant changes in intra-regional trade – that might be evidence of onshoring, nearshoring or friendshoring. At the headline level total intra-regional trade in the Asia-Pacific (PECC, APEC and East Asia Summit members) remains at very high levels of around 67 percent, albeit down from their high of close to 69 percent but specific product groups show some declines, for example intra-regional trade in textiles and clothing has dropped from over 70 percent of global trade down to 63 percent (Figure 1.15).
Some have argued that elements of the sanctions implemented following events in Ukraine could have longer-lasting impact on the international payments system – especially those affecting the Society for Worldwide Interbank Financial Telecommunication (SWIFT) payments system.7 The concern is that there will be an increased splintering of the international payments systems raising transactions costs. A further related issue is the future of the US dollar as the dominant reserve currency.
Perhaps the concerns over ‘fragmentation’ are related to concerns over the reliability of global supply chains and the language that has recently emerged in policy discussions over ‘strategic autonomy’ and ‘near shoring’.
The connection between concerns over fragmentation is reaffirmed by the results of which issues respondents think need to be addressed by APEC Leaders when they meet in November with ‘ameliorating geopolitical and trade conflicts in the region’ taking top slot. However, views differed across sub-regions on what drives attitudes towards trade. For example, 43 percent of respondents from Oceania thought that geopolitical tensions had a serious impact on attitudes towards trade and investment compared to just 26 percent from Pacific South America. These differences are evident across the various issues, for example 37 percent of North Americans thought that rising income inequality had a serious impact on trade and overseas investment as compared to just 17 percent of Northeast Asians.
The top issues affecting attitudes varied significantly among sub-regions, for example, North American respondents do not believe that the lack of benefits is a problem, but rather the absence of sustained political leadership that has the greatest impact. Moreover, social issues – job security and income inequality were seen to having almost as significant an effect as geopolitical tensions. In contrast, those from Pacific South America regard the lack of visible overall benefits as highly as job security and income inequality in influencing political attitudes. The bottom line is that views on trade across the region are impacted by a variety of factors and there will not be (at least going by the results of this survey) a silver bullet. However, it does indicate important areas where the region needs to do more work if it is to achieve its vision of an open, dynamic, resilient and peaceful Asia-Pacific community by 2040.
7 https://www.project-syndicate.org/commentary/russia-sanctions-preventing-blowback-on-open-system-by-anne-o-krueger-2022-03
Protectionism and Slowing Trade
While concerns over protectionism and slowing trade growth have consistently featured as top risks to growth in recent years, peaking in 2018, these are likely connected to worries over a fragmenting global economy. As shown in Figure 1.16, this year exactly the same percentage of respondents selected increased protectionism as a top 5 risk to growth for their economies as a slowdown in trade growth this year.
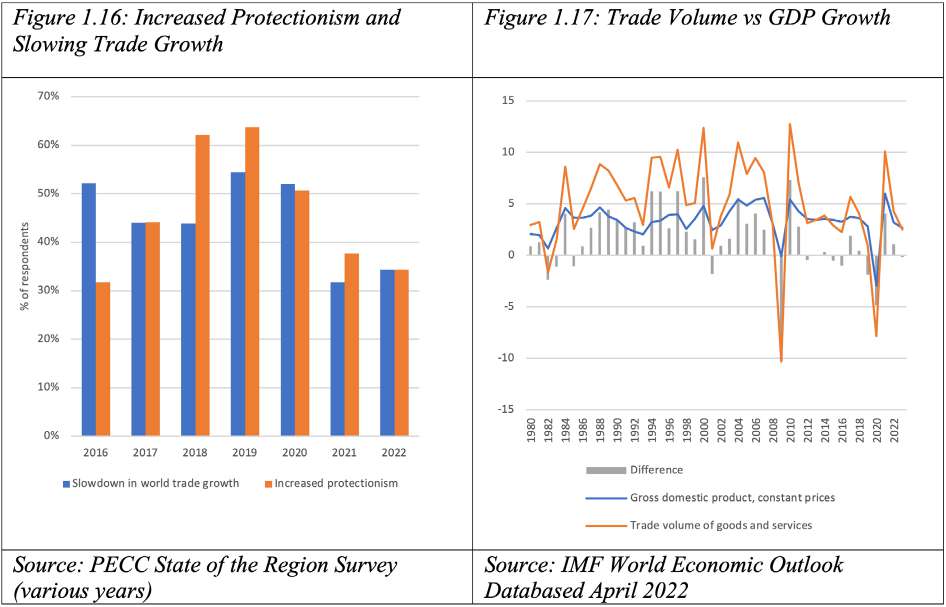
But the slowdown in trade is not a new phenomenon and has been a concern throughout much of the 2010s. As shown in Figure 1.17 trade volume grew on average by 3.5 percentage points higher than GDP throughout the 1990s and 1.3 percentage points in 2000s (higher if the Global Financial Crisis is discounted) but during the 2010s it dropped to under 1 percentage point higher. Looking over a longer time horizon, the global trade-to-GDP ratio rose from about 25 percent in 1970 to peak at 60 percent in 2012. Several reasons have been put forward for this change, some believe that cyclical factors are responsible, eg weakness in aggregate demand, while others include structural reasons, the completion of the integrating processes of China and Eastern Europe; and diminishing returns on global value chain fragmentation, and rising protectionism.8
The recovery of the external sector from pandemic is also slowing with trade growth in 2022 expected to be at about 3.1 percent and 2.0 percent in 2023, down from last year’s close to 12 percent growth. This is significantly lower than forecast just a year ago. As shown in Figure 1.18, the external sector’s recovery is now much lower than the trajectory experienced after the Global Financial Crisis when trade growth settled at a growth rate of around 5 percent about 2-3 years after it had bottomed out in 2009. At current forecasts, trade growth will not reach a settled level until 4 years after the pandemic.
On the positive side, growth of total trade (goods and services) is expected to outpace trade in merchandise goods indicating some recovery of the services sector which had been far worse hit by the pandemic. The WTO estimates that global growth in services trade was around 18 percent in the first quarter of 2022 compared to 3.2 percent growth for merchandise trade.9 The surge in services trade this year has been led by trade in transportation and travel services. However, trade in travel services remains significantly lower that it was pre-pandemic, suggesting that the travel and tourism sector still has a long way to go before a full recovery.
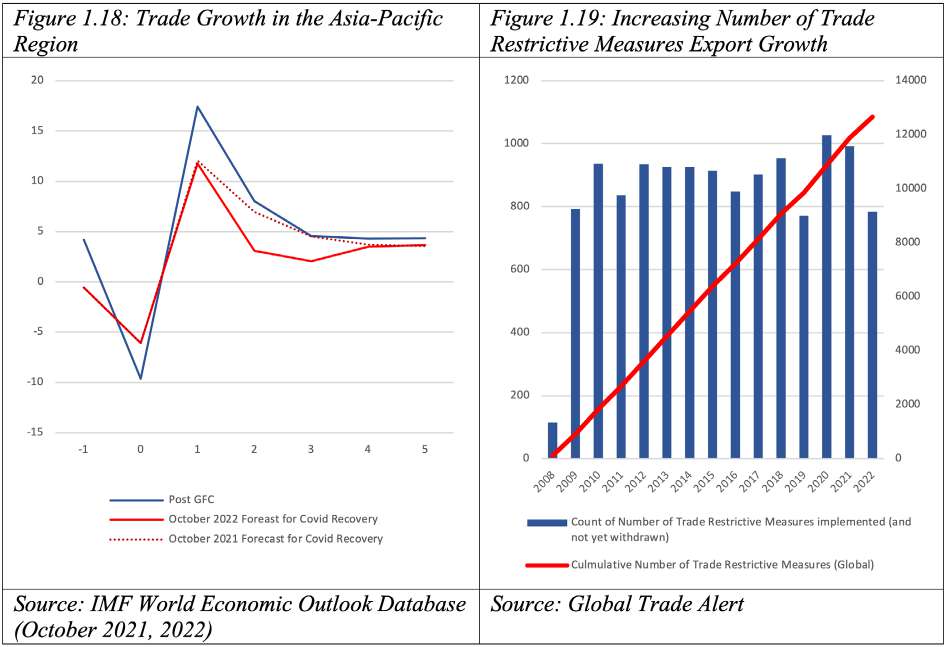
As shown in Figure 1.19 since the Global Financial Crisis there has been a steady accumulation of trade restrictive measures across the world. It is therefore not surprising that respondents consider rising protections as a top risk to growth.
8 Trade and growth – end of an era? Bernard Hoekman: https://cepr.org/voxeu/columns/trade-and-growth-end-era
9 https://www.wto.org/english/res_e/statis_e/daily_update_e/serv_latest.pdf and https://www.wto.org/english/news_e/news22_e/wtoi_22aug22_e.htm
Climate Change
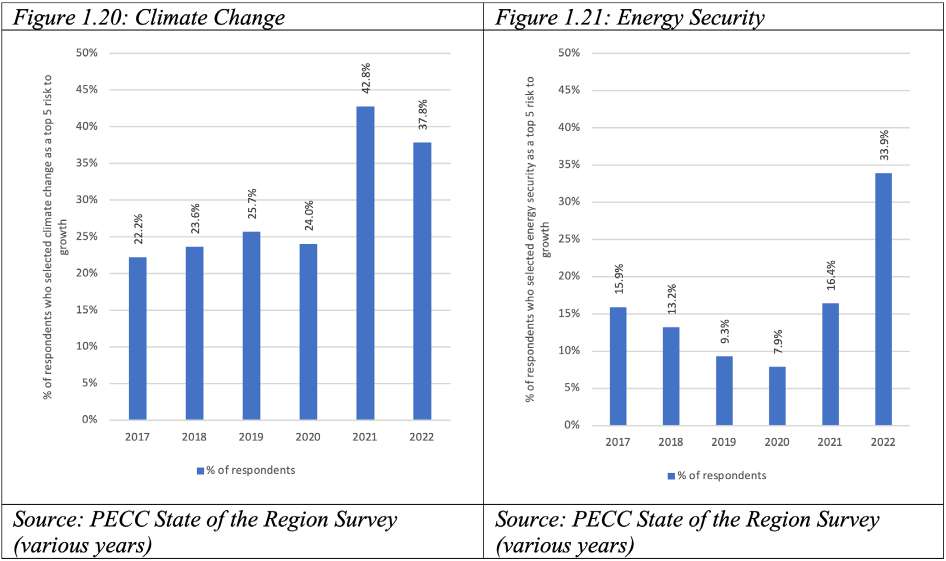
Despite the distraction of multiple other crises, climate change has remained high on the list of risks of regional policy community. For the region as a whole 38 percent of respondents consider climate change to be a top 5 risk to growth. While this is slightly down from last year, it remains elevated from the historical numbers that averaged around 24 percent (Figure 1.20). This has important implications for the focus of regional cooperation and the need to develop programs that address this issue. There was a possibility that the high percentage of respondents who selected climate change as a risk to growth was related to the context – the timing of the survey coincided with the release of the Intergovernmental Panel on Climate Change (IPCC’s) 6th Assessment report 10 which warned of “widespread, rapid, and intensifying climate change. But the continued high percentage of respondents selecting climate change as a risk points to a higher awareness of its economic consequences. At the same time, concerns over energy security are significantly higher than previous years with 34 percent of respondents selecting it as a top 5 risk to economic growth (Figure 1.21) likely related to rising energy costs associated with the Ukraine conflict.
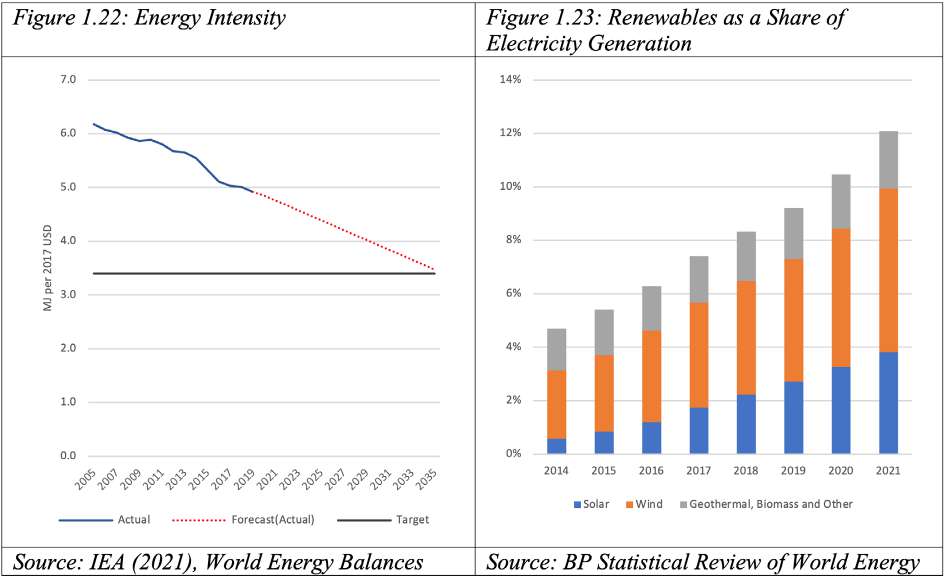
APEC has two main targets related to climate change: to reduce energy intensity by 45 percent from 2005 levels and to double the share of renewables in the region’s energy mix. Figure 1.22 shows the energy intensity per GDP for the region as a whole (not limited to APEC). While energy intensity is clearly on a downward path, whether the region achieves that target is a close call. The most recent edition of the APEC Energy Outlook forecasts that the goal will be met one year ahead of schedule under its reference scenario and earlier in a carbon neutrality scenario. Our own estimates here paint a similar story for the region as a whole. The use of renewables in the region has increased from 4.7 to 12.1 percent from 2014 to 2021 (Figure 1.23). However, that increase has been uneven across the region, with much of the increase coming from the region’s two largest economies, with China’s increased use of wind and solar power accounting for 30 and 18 percent and the United States for 12 and 8.2 percent respectively. This makes this an important issue for cooperation in the region to explore the most efficient ways and policy mixes to decrease carbon emissions.
While those goals are important for the region’s sustainable growth, total CO2 emissions are likely to remain at elevated levels without concerted action. For example, over the 2005-2019 period, total emissions for the region increased from 21,338 million tonnes of CO2 to 27,690 or growing at annualized rate of 1.9 percent. Moreover, as important as the mitigation measures are, much more needs to be done on the adaptation side. This calls for a more integrated approach.
However, the rapid increase in oil and energy prices more generally has caused an uptick in concerns over energy security. As shown in Figure 1.21 the percentage of respondents who selected energy security as a top 5 risk to growth for their economy increased from 16.4 to 33.9 percent. As shown in Figure 1.24 the cost of fossil fuels has gone up by over 40 percent since the start of the Ukraine conflict. In starker terms, the average cost of oil per barrel rose from US$83 in January 2022 to a high of US$116 in June, US natural gas prices increased from US$4.33 to US$8.79 in August and Japan LNG prices up from US$14.7 to US$20.2 per MMBtu over the same period.
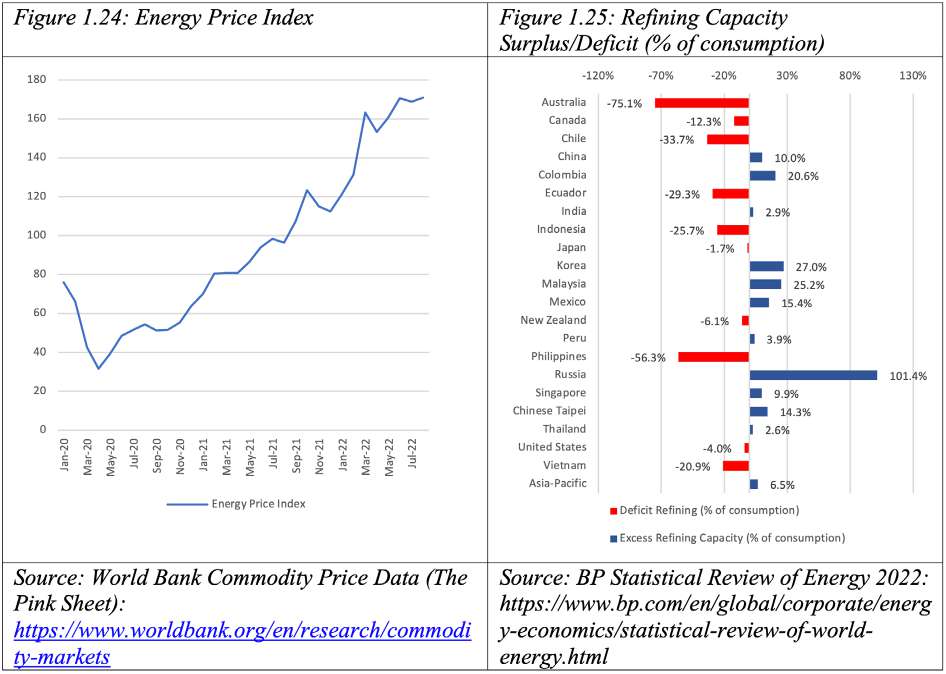
Questions have been asked on whether the conflict in Ukraine will undermine climate change efforts.11 The argument is whether efforts to replace Russian gas with other sources LNG from Qatar and the United States will make it harder to decarbonize economies with companies demanding long-term commitments. The view evident from the survey results is that both issues need to be addressed to reduce risks to growth. At the aggregate level the region has a surplus refining capacity of 6.5 percent – a total of 65,094 thousand barrels daily with consumption at 61,101 barrels. But as shown in Figure 1.25 several regional economies lack refining capacity. Some of this is a result of the closure of refineries during the pandemic but the reasons can be far more complex, for example in the case of Australia, a former net oil exporter, half of its remaining refineries closed within 4 months in 2021, with a variety of reasons given for the closures. The deficit in Australia’s refined fuel needs has come from other regional economies: Singapore (33 per cent), Korea (29 per cent), and the United States (9 per cent), while diesel fuel came from Singapore (24 per cent), Japan (19 per cent), and China (16 per cent).12 The region’s excess refining capacity is heavily concentrated in a handful of economies, with Russia’s 3,454 thousand barrels per day accounting for 86 percent. This makes the ongoing conflict in Ukraine and the response to it even more challenging given the region’s energy requirements. The issues are not limited to energy but extend to others including food security where Russia and Ukraine account for significant percentages of global production of cereals, vegetable oils and also fertilizer.13
Goldman Sachs believes that the Ukraine Conflict will cause a bounce back in primary energy capital expenditure from US$0.9 trillion in 2021 to US$1.4 trillion in 2025 following several years of under-investment. In spite of the expected investments in fossil fuel capacity over the next few years, there is an expectation that an accumulated US$56 trillion will be invested in lower carbon technologies through 2050.14
10 https://www.ipcc.ch/2021/08/09/ar6-wg1-20210809-pr/
11 https://www.project-syndicate.org/commentary/ukraine-war-effect-on-net-zero-transition-esg-strategies-by-gilles-moec-and-bertrand-badre-2022-04
12 https://www.abc.net.au/news/2021-02-11/australia-loses-another-oil-refinery-risking-fuel-supply/13139648
13 https://www.fao.org/3/cb9013en/cb9013en.pdf
14 https://www.goldmansachs.com/insights/pages/gs-research/carbonomics-security-of-supply-and-the-return-of-energy-capex/report.pdf
Ukraine Conflict
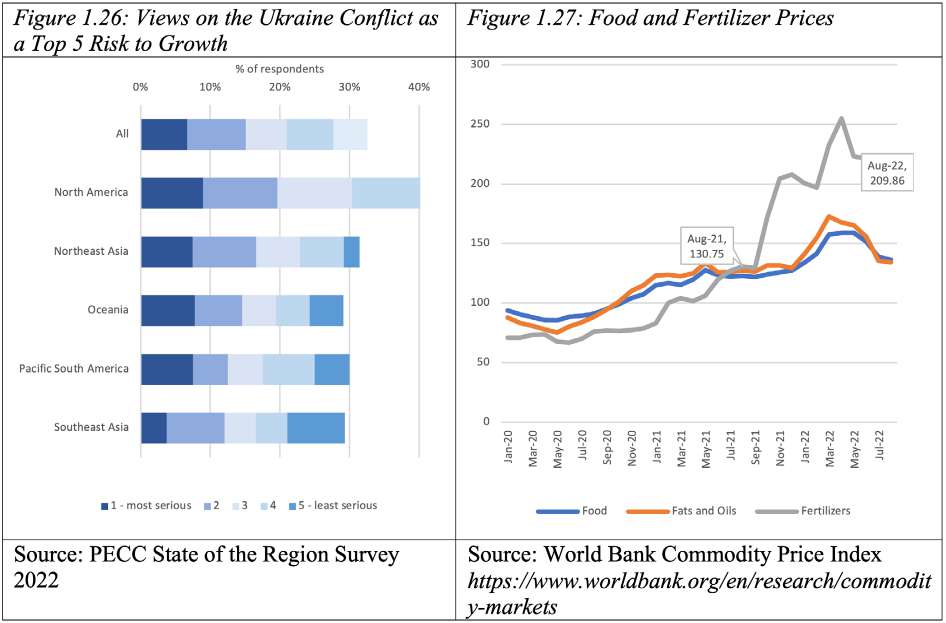
The Ukraine Conflict is the last of the top risks to growth. As already discussed, the conflict has had a substantial impact on energy prices as well as food prices. Perceptions of the importance of the conflict varied across sub-regions, with 48 percent of respondents from North America selecting it as a top 5 risk to growth compared to 29 percent of those from Oceania. (Figure 1.26)
Food prices had already risen significantly over the pandemic period. Prior to the outbreak of hostilities in Ukraine in February 2022, the World Bank’s index of food products had gone up by 43 percent from January 2020 to January 2022, but they peaked in May 2022 with a further 19 percent increase. While prices have come down since then, alarm bells are ringing for next year’s harvest with the continued high cost of fertilizers likely to impact harvests in 2023.15 Average prices for fertilizers have gone up by over 200 percent as shown in Figure 1.29 over past 2 years. But prices of specific types of fertilizers have gone up by much more, potash has gone up from US$221 per metric tonne to US$562. Russia accounts for about 22 percent of global exports of potash fertilizers.
Beyond the impact of the Ukraine Conflict on food and energy security, the events have had a material impact on other sectors that were struggling to recover after the lows of 2020. An example of this is in the travel industry with the closure of airspace over Russia and Ukraine adding in some cases 4 hours to flights.16 The routes most affected are the transpacific flights between the United States and Northeast Asia, and Eurasian flights between Northern Europe and most of Asia.17 However, the development of the Belt and Road rail links have remained strong with the transport by rail of goods from China to Europe have gone up to 869,000 TEUs or 4 percent year on year growth. A still limited but route for trade is via the Arctic which is 30%–50% shorter than taking the Suez Canal has also been affected by the conflict.18
15 https://www.thejakartapost.com/paper/2022/09/21/ri-warns-of-global-food-insecurity.html
16 https://www.businessinsider.com/airline-routings-add-hours-flight-time-to-avoid-russian-airspace-2022-3
17 https://www.globaltimes.cn/page/202203/1254304.shtml
18 https://eos.org/articles/arctic-shipping-routes-are-feeling-the-heat
Covid-19 Pandemic
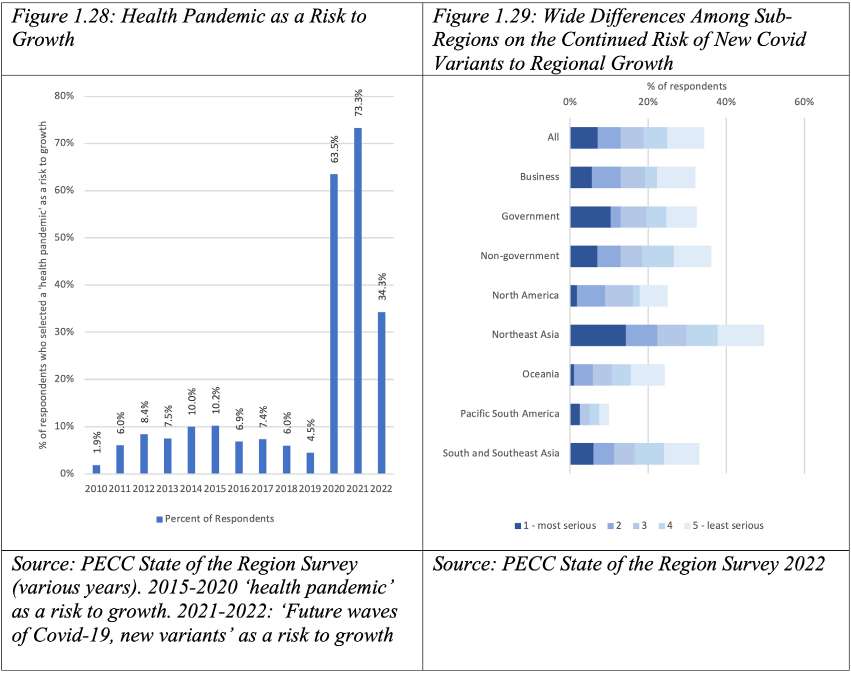
Since the World Health Organization (WHO) first made the assessment of Covid-19 as a pandemic in March 2020, a staggering 6.5 million people have died out of a total of 610 million reported cases globally. In the broadly defined Asia-Pacific region the numbers are similar with 286 million cases and 3.2 million deaths. Over the past 2 years a health pandemic was the top risk among survey respondents (Figure 1.28). But the share of respondents selecting pandemic-related concerns as a top 5 risk fell this year to 34 percent. However, the aggregate number masks a wide variety of views on this issue with only 10 percent of respondents from Pacific South America selecting it as a risk compared to 50 percent in Northeast Asia (Figure 1.29). Those subregional differences were not apparent for stakeholder groups with relatively narrow differences between the business, government, and non-government respondents.
The extremely rapid development of vaccines and therapeutics over the course of the pandemic brought the case fatality down from an average of 3 percent in 2020 to 2 percent in 2021 and now 0.3 percent in the region. To put this in perspective, there are between 291,243 to 645,832 or between 4 to 8.8 per 100,000 influenza related deaths occur annually.19 The pandemic has evolved as a series of waves as new variants have emerged challenging the ability of governments to contain the spread of the virus especially through the 2020 to early 2022 period when vaccination rates were relatively low (Figure 1.30). The total number of cases in the region peaked in January 2022 with a total of 1.1 million cases reported in that month, while the number of deaths reported has a much earlier peak at 6,800 deaths reported. The reduction in the total number of cases and the number of deaths per case has come even as the region has opened up and begun the process of ‘living with Covid’. The average level of policy stringency in the Asia-Pacific, has fallen significantly over the course of 2022 from a high of 55 down to 29, going by the Oxford Coronavirus Government Response Tracker which uses 9 measures of stringency with 100 being the most stringent policy response and 0 the lowest.
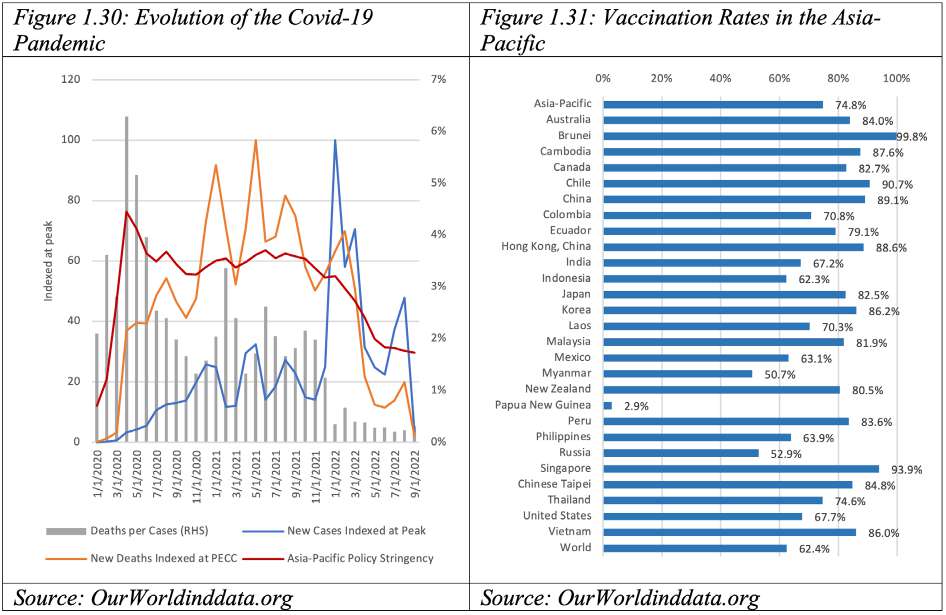
The region has made significant progress towards the goal of achieving a vaccination rate of above 70 percent over the past year with about 75 percent of the population now fully vaccinated (Figure 1.31). However, there are two issues that challenge the international community:
- The continuation of ‘vaccine inequity’ with some economies reaching rates close to the entire population and others still in single digits. The reasons for this are too complex to go into here but the problem for the regional community at large is that areas with low vaccination rates (including those outside the region) may become a breeding ground for new variants to develop. The WHO warns that Covid is continuing to spread around the world and there is a need to track closely the variants that are emerging.20
- The second is how governments define ‘fully vaccinated’ and the need for booster shots. The WHO’s latest statement on the issue considers two scenarios:
- the use of additional booster doses in those who are not able to mount and sustain adequate immune responses and
- considerations for additional booster doses to be administered in order to protect high risk populations and health workers in order to maintain the health system during periodic waves of disease surges.21
The critical role of trade in dealing with the pandemic needs to be placed in its context. While much has been made of the need for more resilient supply chains, global trade has played a fundamental role in helping economies deal with the pandemic.
The WTO estimates that the share of medical products increased as a share of global trade from 5.3 percent to 6.6 percent in 2020 as people were buying needed to protect themselves from the virus. As shown in Figure 1.32, trade in Covid-19 critical products increased by 32 percent in 2020. Specific items had even faster growth such as facemasks and rubber gloves.
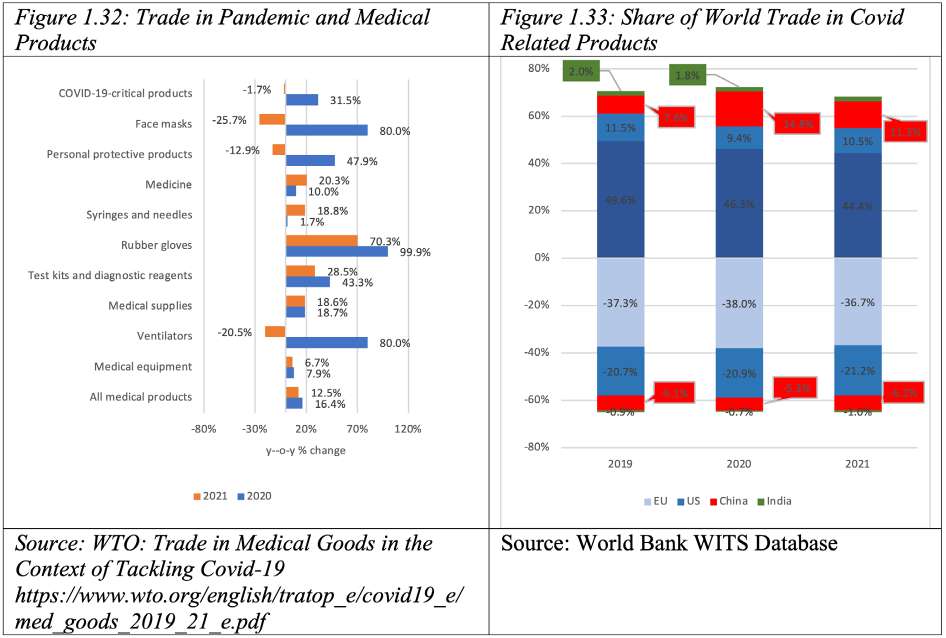
While much has been made in the media of the lack of diversification in sources of supply of some equipment, trade data provides important insights into how the system works. In 2020 total global trade in Covid-19 related products increased by US$192 billion or 33 percent with the biggest increases in protective gear. Global trade in facemasks increased, global imports of facemasks increased by US$125 billion and personal protective products by US$133 billion. In 2021 imports of facemasks fell by US$41 billion and personal protective products by US$32 billion. At the same time, imports of medicines increased by US$116 billion.
Of those increases, China was able to ramp up pandemic-related exports from US$38 billion to US$69 billion in 2020. Others like the US and Germany increased exports by about US$4 billion. While China’s exports to the US in Covid-19 critical products increased dramatically in 2020 by about US$18 billion, this fell back down by US$10 billion last year. These changes in trade flow may indicate that domestic production of some of these products increased and/or ways of coping with the pandemic changed.
In terms of pandemic preparedness and the need for an ever-warm production capacity, trade data suggests that different economies were able to provide the wide range of equipment and materials. Having that capacity in different locations within an open global system should be one of the lessons from this pandemic. Given the enormous impact of the Covid-19 pandemic and increasing likelihood of pandemics occurring, the need to have systems in place that enable the world to respond effectively is critical.
20 https://www.who.int/publications/m/item/monkeypox--covid-19---other-global-health-issues-virtual-press-conference---22-september-2022
21 https://www.who.int/news/item/17-05-2022-interim-statement-on-the-use-of-additional-booster-doses-of-emergency-use-listed-mrna-vaccines-against-covid-19
Global Supply Chains and Semi-Conductor Shortage
A major discussion item throughout the pandemic has been the resilience of global supply chains, the impact they have had on inflation and the broader resilience of economies. One example of this has been in the auto sector where 11.3 million cars were cancelled due to shortages in semiconductors.22 These issues continue to plague the industry and companies continue to build up inventory, in spite of the negative outlook for 2023, BMW CEO said that “Semiconductor supply difficulties remain the dominant and decisive issue for our sales performance.”23
The increase in demand for consumer durables, especially electronics, stretched supply chains, leading industry players announcing massive capital expenditure plans to meet demand. For example, Samsung and TSMC announced US$120 and US$100 billion plans respectively over the next few years.24 The downturn since those announcements were made has led to some trimming back of capex commitments and projections. Micron, for example, is expected to cut back on capex by 30 percent for the 2023 financial year25 and TSMC is dialing back its expectations of capex albeit still with a huge amount of US$40 billion in 2023.
Economies around the world have announced various incentive packages for the sector citing different objectives. For example, the US CHIPS and FABS Acts foresees US$52 billion in Federal investment to onshore manufacturing capacity; the EU CHIPS Act has US$46 billion to increase Europe’s share of manufacturing from 9 to 20 percent; the China Integrated Circuit Industry Fund includes US$20.7 billion in its first phase and US$30.5 for its second to achieve chip self-sufficiency. Some believe that massive expansions in capacity will be needed to satisfy growing demand in a sector expected to increase from $600 billion in 2021 to $1 trillion by 2030 with the expansion of the internet of things. Others fear that ‘capacity is going to be much greater than the world as a whole actually needs.’26
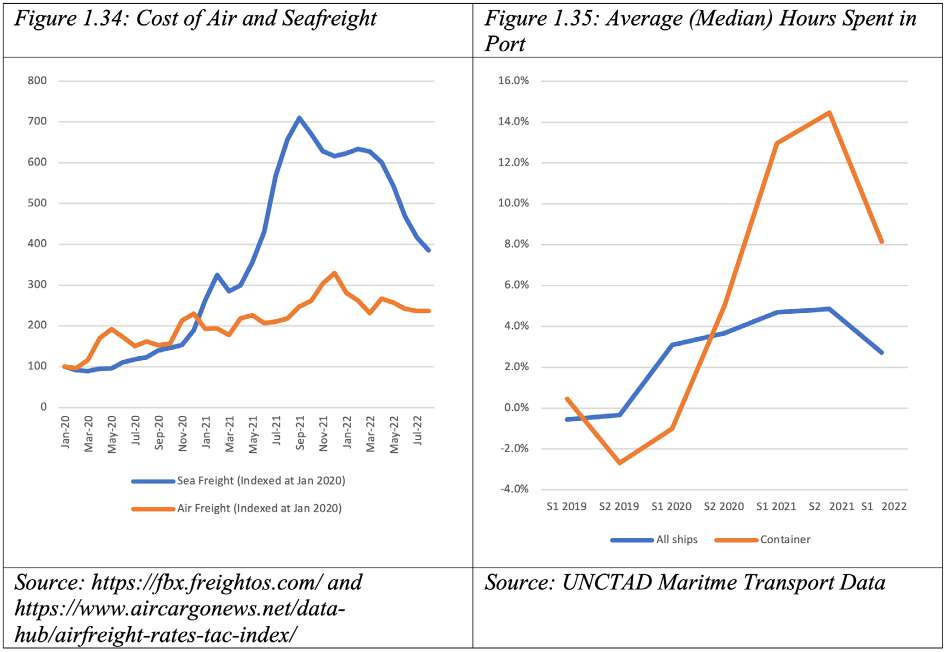
One area issue that has plagued companies throughout the pandemic period is the elevated cost of transporting goods. As shown in Figure 1.34 both air and sea freight costs rose dramatically over the pandemic period, Freightos Baltic Index (FBX): Global Container Freight Index shows the average cost of shipping a 40-foot container on various routes. At the beginning of 2020 it stood at around US$1,500 and at its peak in September 2021 it was about US$12,000. The Baltic Exchange price for air cargo is similar with average prices of air freight per kg starting in Jan 2020 at US$2.9 and climbing to a high of US$8.6 in December 2021. Since then, prices have come down significantly but are still well-above pre-pandemic levels.
A further challenge for business is delays in shipping. Estimates suggest that only 36 percent of container shipments arrived as scheduled in 2021 compared to 64 percent in 2020 and 78 percent in 2019.27 The reasons behind delays are complex: starting from covid related issues, including the several-day blockage of the Suez Canal, and continuing with difficulties in offloading cargo and transferring it to land transport. As shown in Figure 1.35 the median time ships have spent in port has increased over the pandemic period, for all ships the amount of time spent in port has gone up by 2.5 hours, while for container ships by 3.5 hours worldwide. The average increase may sound small but the IMF estimates that total delays surpassed 1.5 days on average by December 2021. The additional time in transit, according to one estimate is the equivalent of “a global ad-valorem tariff of 0.9 to 3.1 percent under some assumptions… approximately equal, in absolute value, to the global applied tariff reduction achieved over the 14-year period from 2003 to 2017.”28
It is therefore critical to understand the factors behind the impediments to the efficient functioning of supply chains. As argued in the Box Section below, it took the disruption of the Covid-19 pandemic to the functioning of global supply chain networks to fully appreciate importance of services needed to move goods across borders. APEC members acknowledged the critical role that services play in the movement of essential goods and distribution of vaccines in their Statement in 2021 and committed to work together to facilitate the supply of services to support the movement of essential goods.29 The Box section is an in-depth discussion on the role that logistics play in supply chains and suggests ways that the region can cooperate to avoid the types of problems encountered during the pandemic.
22 https://www.theregister.com/2022/08/09/car_chip_shortage/
23 https://www.theregister.com/2022/08/30/toyota/
24 https://www.bloomberg.com/news/articles/2021-04-01/tsmc-to-invest-100-billion-over-three-years-to-grow-capacity
25 https://techwireasia.com/2022/10/the-chip-glut-is-here-and-semiconductor-players-are-bracing-themselves/
26 https://asia.nikkei.com/Spotlight/The-Big-Story/The-resilience-myth-Fatal-flaws-in-the-push-to-secure-chip-supply-chains
27 https://www.seatrade-maritime.com/containers/container-line-schedule-reliability-plunges-358-2021
28 https://www.imf.org/en/Publications/WP/Issues/2022/03/25/Supply-Chains-and-Port-Congestion-Around-the-World-515673
29 https://www.apec.org/meeting-papers/sectoral-ministerial-meetings/trade/2021_mrt/annex-2
Box: The importance of essential services to supply chain connectivity and resilience
Contributed by Dr. Sherry M. Stephenson and Dr. Mia Mikic
Introduction
Global supply chains have been instrumental in linking economies around the world. With once domestically integrated production processes being dispersed across many economies in a mature globalization phase, service links1 became the connectors of those production fragments. Trade in parts and components -aka the intermediates- grew into the largest component of global merchandise trade (accounting for half or more of world goods trade according to Trade Data Monitor), obscuring the indispensable role of service links.
It took the disruption of the Covid-19 pandemic to the functioning of global supply chain networks to fully appreciate importance of services needed to move goods across borders. Many services have come to be understood as essential to the operation of supply chains. Bottlenecks and delays in production and distribution, often caused by a lack of appropriate policies towards essential services, in particular logistics services, led to lack of supply of consumer and producer goods, as well as of needed medical products, vaccines, and therapeutics. These disruptions in supply and distortions in goods and labor markets contributed to creating an inflationary environment, especially in the advanced economies, which is causing anguish to consumers, producers, and governments in general at present.
While macroeconomic fundamentals will remain the main drivers of economic vulnerability, to minimize their impacts on trade and investment it is imperative for APEC and other appropriate institutions to address the causes of supply chain disruptions and improve their functioning. This is critical to addressing concerns over the ‘fragmentation of the global economy’ which was the 3rd highest risk to growth in this year’s State of the Region survey. A focus on essential services must be a big part of the discussion.
Essential services
Efforts to define essential services are still ongoing, as it is a complex category encompassing both tradeable and domestic services. However, a big step forward was made in 2022 when essential services needed to move essential goods across the borders among APEC economies in the context of a crisis such as the Covid pandemic were identified as “logistics-related services”.
Many service inputs into supply chain operation are well known. They consist of all modes of transport (air, sea, rail, and road) as well as core logistics services such as customs brokerage, cargo handling, storage and warehousing and freight forwarding, together with courier and distribution services. Although these key “logistics-related services” are the nucleus of supply chain operations and have been recognized in the APEC-agreed definition,2 they cannot function without several other equally essential intermediary services, including telecom services allowing for digitized processes and platforms, financial intermediation services and importantly, movement of service providers.
Some of the stumbling blocks to supply chains functioning around these essential services during the pandemic were obvious: different operating times for ports; differing standards in the treatment of Covid protocols; lack of digitized processes to deal with port container operations; lack of standardized customs documents, among others. The inability to draw upon a sufficient number of essential workers as well as to allow them to move across borders was also a major contributor to blockages and delays, both internally and internationally.
Challenges to supply chain resilience
Although the severity of the supply chain disruptions has eased again in the third quarter of 20223 , the vulnerability risks of supply chains uncovered by the Covid-19 pandemic are still not resolved; if anything, they have been accentuated by the current macroeconomic environment, geo-political tensions and the calls for fragmentation of the global economy. The policies put in place by governments in the region still vary widely, with some of these very conservative regarding the movement of service providers in particular. It is unclear if the improvement in supply chain operations will last or not, and if the current improvement is due to a weakening of global aggregate demand pressures or to increased capacity and better efficiency of some service operations. And it is not at all obvious that the Asia-Pacific will return to pre-pandemic levels (scale) of operation. Yet, according to industry representatives, the supply chains crisis situation continues, and the future remains uncertain for the world economy and for the firms that supply it.4
APEC’s work on essential services
APEC is working towards a better understanding of the role of tradable essential services, especially logistics services. As part of its deliberation on how to address future pandemics or other major challenges in a more coherent and coordinated manner, APEC has undertaken an analysis of the role of logistics and APEC Ministers Responsible for Trade have agreed upon a common definition of logistics-related services which include ten sectors (customs brokerage services; cargo handling; storage and warehousing; freight forwarding; courier services; distribution services; and air-, maritime-, rail- and road transport services). APEC has reached out to industry actors, and is collecting and evaluating the information available to better understand the link between policy and performance for these logistics-related services and to procure better information on performance, over time, and across economies and sectors. Yet, more remains to be done. Having a better appreciation of the importance of logistics for economies’ resilience and APEC’s work through the results of the SOTR survey provides for helpful guidelines in this regard.
Regional views on importance of essential services and logistics-related services
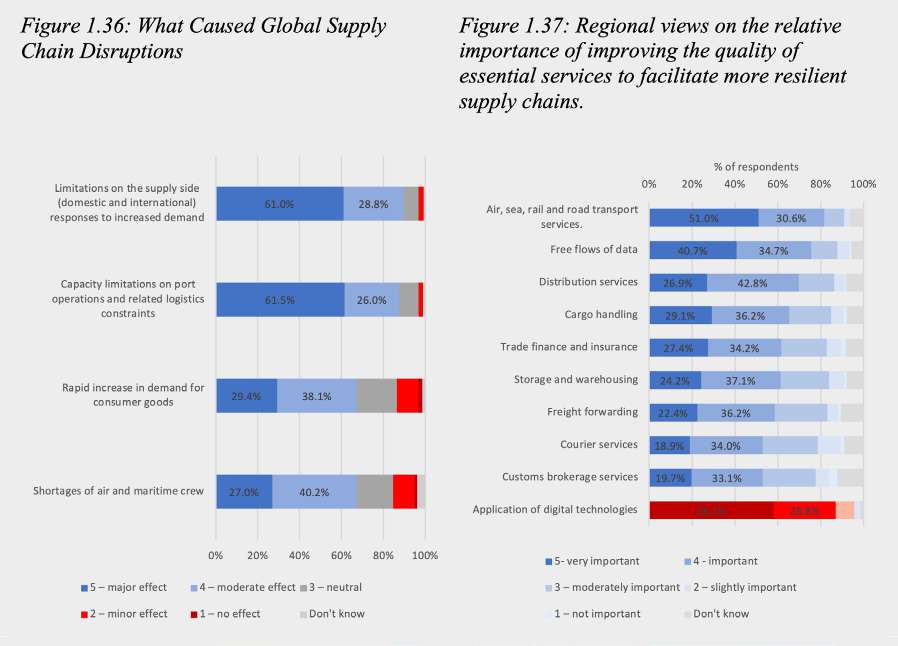
In the views of the respondents to the SOTR survey, logistics has played an outsized role in the impact on trade flows in the region during the Covid-19 pandemic. Physical factors in the form of capacity limitations on port operations and related logistics constraints were indicated as the most important contributor to global supply chain disruptions during the pandemic period, coming in just above supply side constraints. A higher percentage of the business community felt that these impediments had a major impact as compared with government, with responses fairly similar across sub-regions in the Asia Pacific. Access to crew did not seem to have as significant effect on supply chain disruptions with most respondents indicating that shortage of air and maritime crew were only moderately important to supply chain disruptions. Overall, the perception throughout the region is that supply side limitations and capacity issues in ports and logistics operations had the biggest impact on supply chain disruptions.
Respondents were clear in placing high priority on the need to improve the regulation of all essential services listed, with over half of respondents indicating that this was important or very important. All of the activities that APEC has defined as logistics-related services are contained within this grouping of essential services. Overall, respondents placed top priority on improving regulation of transport services, with air, sea, rail and road transport grouped together in the question (51% felt this area to be very important). Improving the regulation of data flows connected with essential services also polled very high, with 40% indicating this area very important). The business community and government officials were generally well aligned in terms of their perceived priorities for improved regulation for each of these essential service activities, with one major difference: business placed a much higher priority on better regulation of data flows than did government (with 81% of private sector respondents considering this area to be important or very important compared to 67% for government).
In addition to asking about the importance of improved regulation of essential services to more resilient supply chains, a separate question was asked on the importance of the application of digital technologies to improve supply chain performance. This is also shown in Figure 1.37, but in a different color. The results show that the digitization process was considered to more important overall than any of the other essential services. Digging deeper, over 85 percent of both government and business respondents think that the application of digital technology is either important or very important, which is interesting considering that digital technologies cannot be of use without accompanying data flows.
Looking at overall priorities for APEC, putting in place an initiative to improve the delivery of logistics services in the region came in just short of the top 5 out of 20 competing issues in terms of what respondents felt should be the top priorities for APEC Leaders to address at their coming meeting in November 2022, roughly at the same level as the recovery of the tourism sector and the promotion of structural reform for a green recovery.
Developing a work program on global value chains (or supply chains) in APEC over the coming 5 years came in second only to digital trade as being the most important area for APEC economies to focus on in the near future. Though services were not explicitly mentioned in the choices offered for a future work program, they are clearly critical to the functioning of global value chains. A combination of the analysis of the application of digital technologies to the area of logistics-related services would seem to be an obvious area of future focus for APEC work given the indicated priorities.
Improving supply chain operation and resilience
There is an underlying consensus among industry actors that supply chains need to be more resilient, which can come in various forms. With a switch of a business model from “just in time” to “just in case” firms must be able to make better informed decisions still in a timely fashion. Investing in more infrastructural and digital capacity will provide some reprieve, but is not the full fix. Firms (as well as governments) need better and more accessible information. Through the search for causes to disruption of supply chains, it became clear that the key firms did not have full information about their second-tier and even less information about the third-tier of suppliers. Investment into mapping the linkages to have a full visibility of the value of supply chain is irreplaceable, especially if resilience is to be improved through diversification.
Resilience also needs to be affordable as firms cannot invest in too large over-capacity. While it is understood that the times of “lean or no” inventories are gone, firms cannot stock too much nor can they assume that role for the public sector (for example in the health sector). Supply chains must be fulfilled by multiple means of transport, all of which needs to be cost efficient and, looking ahead, also energy efficient. As said by many commentators, today’s production and consumption is unimaginable without supply chains. However, future supply chains will be different and the relationship among the participating firms will be altered; some partnerships were broken during the Covid-19 pandemic and may not be reinstated; some will be reconstructed differently, with more emphasis on considerations such as security, trust and reliability, than were previously in place.
In short, there is no single or silver bullet solution to supply chain resilience. It is important to keep in mind that firms do not make their decisions on investment, location of production or suppliers in an economic and political vacuum. Policy certainty, regulatory predictability and stability of business and investment environment are among the most important decision-making factors. Therefore, the APEC economy governments could support building back better from the pandemic by removing as many sources of uncertainty, instability and volatility as possible. In the context of logistics-related services and other essential services, this refers to making more serious efforts towards reducing regulatory differences between economies, through adopting MRAs or regulatory reforms. Furthermore, it requires a “just in case” approach by governments too. Either through the negotiation of trade agreements or separate protocols, it would be useful for the region to develop guidelines for governing in a crisis.
Reviving Tourism
Travel and tourism have been the hardest hit sectors as a result of the pandemic, with international travel closed for much of the 2000-2021 period. As shown in Figure 1.38 the top 3 recommended actions in our survey for an inclusive and sustainable recovery of the tourism sector were:
- Increasing the percentage of population that are vaccinated;
- Reducing or harmonizing the remaining restrictions on travel due to Covid-19; and
- Reducing post-pandemic travel costs (eg cheaper/no need for Covid-19 insurance, fewer testing requirements).
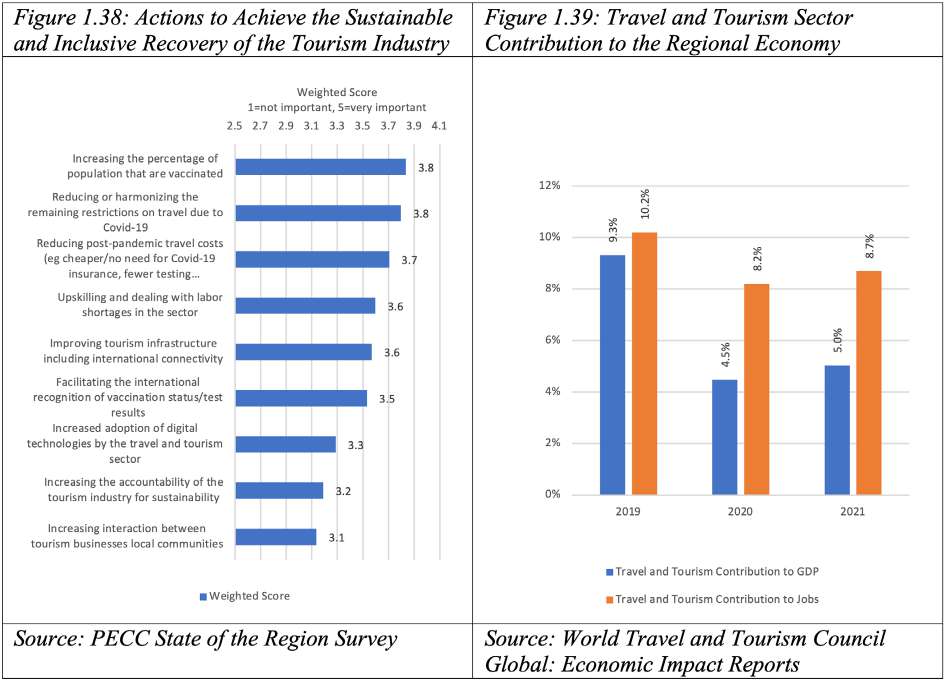
Respondents put a high priority on actions related to the ‘recovery’ of the sector rather than those to increase inclusion and sustainability. For example, 44 percent of respondents thought that increasing vaccination was very important compared to just 18 percent for ‘increasing the accountability of the tourism industry for sustainability’. Moreover, the sector now faces other concerns especially labor shortages that are curtailing the rapid recovery of the industry.
The UN World Tourism Organization estimates that about 359 million tourists arrived in the region in 2019, last year that number was just 21 million. By comparison, there were 749 million tourist arrivals in Europe in 2019, and this had recovered to 303 million in 2021. IATA expects worldwide travel to recover to pre-pandemic levels by 2024 but there are significant differences among regions, with North American passenger numbers expected to be above 2019 numbers next year. But according to IATA, ‘the slow removal of international travel restrictions, and the likelihood of renewed domestic restrictions during COVID outbreaks, mean that traffic to/from/within Asia Pacific will only reach 68% of 2019 levels in 2022, the weakest outcome of the main [world] regions. 2019 levels should be recovered in 2025 (109%)’. This is in spite of the region now having a similar vaccination rate to Europe. So other concerns such as reducing the remaining restrictions on travel and travel costs need to be addressed. The region continues to lack a coordinate approach to how they will facilitate travel in the postpandemic period. The prognosis, however, is positive with many economies lifting all travel requirements. Perhaps of greater concern is that the recovery of the sector in the Asia-Pacific has been weaker than other regions.
Bearing in mind that transport related emissions of the tourism sector account for 22 percent of all emissions from transport, finding ways to have the sector contribute to sustainability goals while creating jobs and opportunities for a more inclusive model will be a big task for policy makers. According to estimates from the UNWTO, transport-related emissions from the tourism sector will grow at an annualized rate of 1.6 percent.30
A further issue that the region needs to take into account is the growing scale of the tourism sector and its impact on habitats in the region. Different business models that leverage high quality tourism engaged with local communities can help to foster more inclusive and environmentally sustainable growth.31
The World Trade and Tourism Council estimates that the number of jobs supported both directly and indirectly by the sector dropped from 333 to 271 million between 2019 and 2020 and then recovered to 289 million.32 However, the sector faces specific challenges as the industry returns to its previous size:
- Workers that lost their jobs in 2020 have moved on to other sectors or out of the labor force
- Competing with other sectors for talent
- Drop in the number of migrant workers available
For example, foreign-born workers account for 16 percent of the tourism work forces in the Europe and an even higher 20 percent in the United States. The EU is facing a shortage of 842,000 workers and 412,000 in the United States.
In 2019 the travel and tourism sector contributed about 9.3 percent to regional GDP, during the pandemic this dropped to 4.5 percent. Even though there was some recovery in 2021 with the size of the sector growing by over US$500 billion, it remains well below the 2019 baseline. A similar story is seen looking at the contribution of travel and tourism to employment in the region. In 2019 the sector accounted for 10.2 percent of jobs, this fell to 8.2 percent in 2020 as the pandemic brought a halt to most cross-border tourism activities and then rose again in 2021 as economies gradually began to open up (Figure 1.39). However, the percentage numbers mask the reality that 32.6 million people stopped working in the sector. Whether those people return to their previous jobs (if they are available) is another matter.
While the recovery of travel and tourism in the Asia-Pacific was already lagging behind other regions, the conflict in Ukraine is expected to be a further set-back. Russia and Ukraine account for 3 percent of global tourism expenditure, but also flights from Asia to Europe and Asia to North America are taking longer routes due to the restrictions that have been imposed on travel over airspace involved in the conflict. Russian airlines and passengers in particular have been affected by flight bans over European air space and entry restrictions.
30 https://www.e-unwto.org/doi/epdf/10.18111/9789284416660
31 http://mddb.apec.org/Documents/2022/SCE/DIA1/22_sce_dia1_014.pdf
32 https://wttc.org/Portals/0/Documents/Reports/2022/EIR2022-Global%20Trends.pdf
Reforms for Growth
As previously discussed, the forecast for growth in 2023 have been revised downwards. Looking further ahead there are worrying signs that current conditions will lead to a significant decline in regional growth rates over a longer period or even negative growth in some economies. With reference to Figure 1.40, during 2010s, the average regional growth rate was 3.8 percent, the forecast for the period 2020 to 2027 is for growth of around 2.7 percent. Analysis by the World Bank similarly suggests a deceleration for emerging markets with growth potential for emerging and developing economies will be close to 1 percentage point lower than the previous decade.33 However, growth enhancing reforms can mitigate the impact of some of the long-term trends. The World Bank estimates that a combination of reforms would increase growth potential from 3.8 to 4.5 percent.
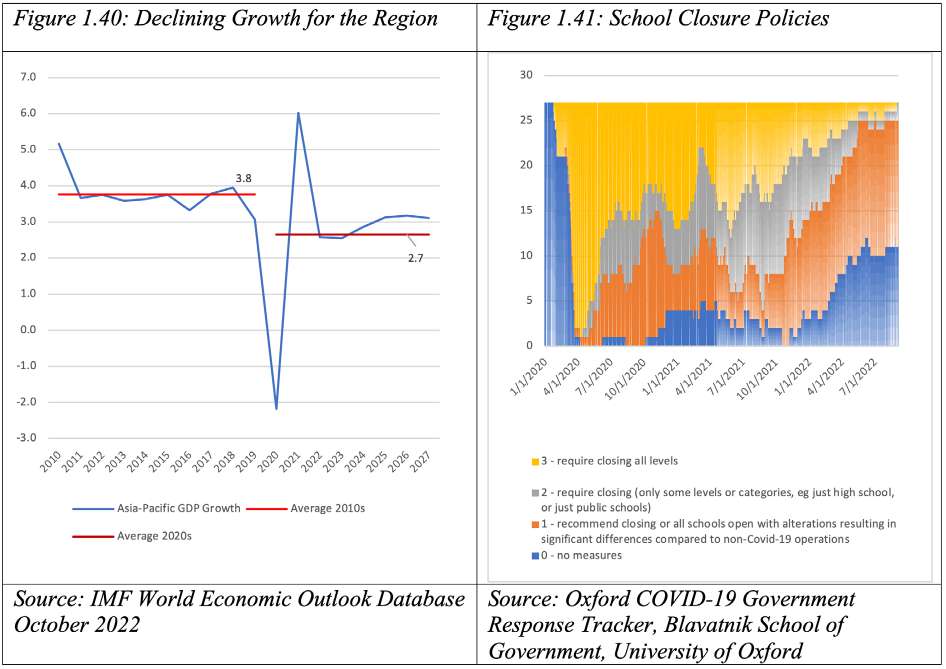
Again, according to the World Bank, some 131 million children missed three-quarters of in-person learning from March 2020 to September 2021. Figure 1.41 shows data from the Oxford Policy Stringency Tracker for schools. Since the beginning of 2020 through to the end of September, schools were closed at all levels for, on average, 323 of the past 974 days. School closure does not mean there was no schooling, but this was often done virtually. However, UNESCO finds that even if virtual education was available (in addition the challenges of access to the internet and lack of devices) students with lower socioeconomic status were less confident in the online environment, leading to higher declines in learning progress.34 This deepens the existing challenge in the region of reducing inequality. Additionally, McKinsey estimate that the macroeconomic impact of unfinished learning could lead to a US$1.6 trillion loss for the global economy. 35
APEC leaders have placed a high burden on the structural reform work to achieve key elements of the Aotearoa Plan of Action:
- to promote innovation as well as improve productivity and dynamism;
- to sustain positive productivity growth, fostered by continuous growth in innovation;
- to remove barriers to economic participation; encouraging the transition of economic actors from the informal to the formal economy; and data analysis; and
- to promote economic policies, cooperation and growth, which will support global efforts to comprehensively address all environmental challenges, including climate change.
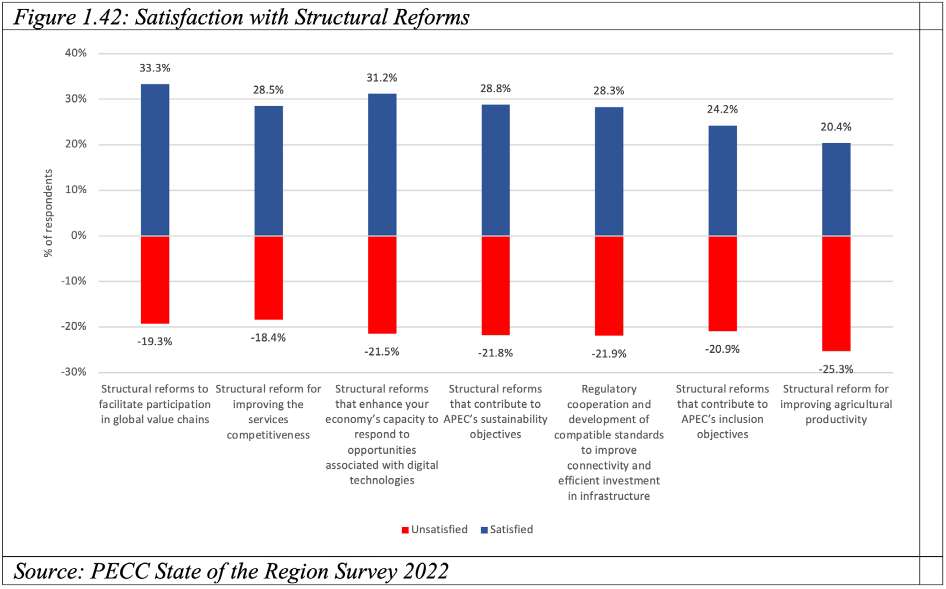
Our survey suggests perceptions of progress. Figure 1.42 shows that generally more respondents were satisfied than unsatisfied across a wide range of areas, but the largest group of respondents were neutral and significant numbers of respondents selected ‘don’t know.’ For example, while structural reforms are expected to play a significant role in removing barriers to participation in the economy (more inclusive growth) 20 percent of respondents say that they ‘don’t know’ and a further 35 percent are neutral. The results were similar for structural reforms and sustainable growth with 33 percent ‘neutral’ and 17 percent ‘don’t know’. The high levels of ambivalence, lack of awareness or understanding on structural reforms makes communication efforts a high priority for policy makers in the region (and beyond).
33 World Bank, Global Economic Prospects 2022: https://www.worldbank.org/en/publication/global-economic-prospects
34 https://unesdoc.unesco.org/ark:/48223/pf0000380398
35 https://www.mckinsey.com/industries/education/our-insights/how-covid-19-caused-a-global-learning-crisis
Priorities for Structural Reforms
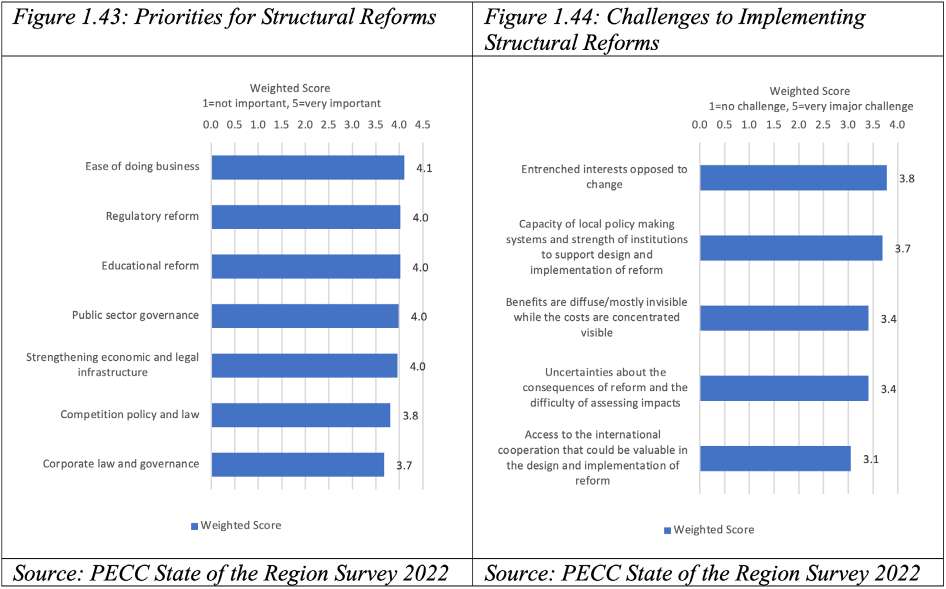
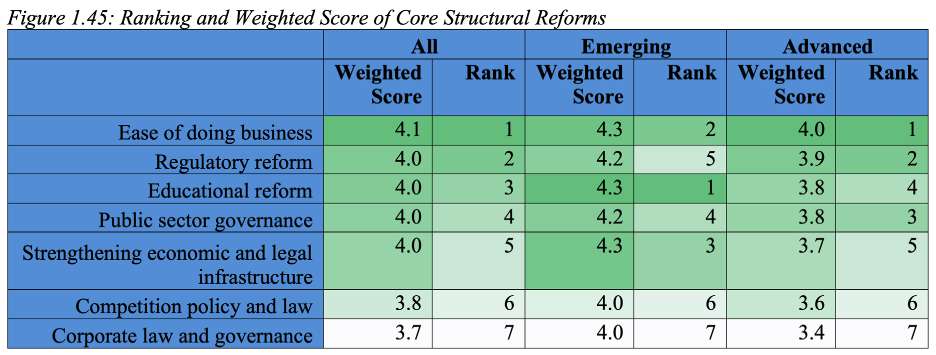
Looking at the results of our survey, overall there was to distinguish between the relative importance of the different core structural reforms (Figure 1.43). But looking deeper at the results a few headlines emerge in Figure 1.45, respondents from emerging economies generally tended to give higher scores to the importance of the core structural reform areas than those from advanced economies. There were also some important differences in ranking with emerging economies placing the highest priority on educational reforms and advanced economies on ease of doing business.
The bottom line here is to avoid a ‘cookie-cutter’ approach and each economy must carefully and deliberately design reforms to fit local needs and circumstances. That said, there is still value in sharing experiences. By a relatively high margin the biggest challenge to implementing structural reforms was that ‘entrenched interests oppose change,’ 35 percent of respondents say that this is a very major challenge compared to 28 percent for the next highest challenge which was the ‘Capacity of local policy making systems and strength of institutions to support design and implementation of reform’.
Priorities for APEC Leaders
At perhaps no other time since the foundation of APEC has the region faced a more complex and uncertain landscape. The region has gone through, and in some respects continues to, face a global pandemic. While the growth experienced in 2021 might have been a rebound given the depths that had been reached in 2020, events this year have not helped to sustain that momentum. It is difficult to not draw comparisons with the Global Financial Crisis and the recovery from it. The recession caused by the pandemic was deeper than the GFC but the recovery in 2021 was also much stronger. Problematic for the region (and the world) is that what one might have hoped to be a transition year to a ‘new new normal’ has been anything but a transition.
As frayed as relations have become over the past years, geopolitical events this year seemingly would have made international cooperation on any issue a distant dream. In this context, the outcomes from the World Trade Organization’s 12th Ministerial Conference (MC12) were an unlikely and highly welcome boost. In spite of placing the need for ameliorating geopolitical and trade conflicts in the region as the highest priority for APEC Leaders to discuss at their meeting in Bangkok, respondents also hope that Leaders will discuss the long-held (but still distant) vision of a Free Trade Area of the Asia-Pacific as well as supporting the WTO and the outcomes from MC12 as 2nd and 3rd highest priority.
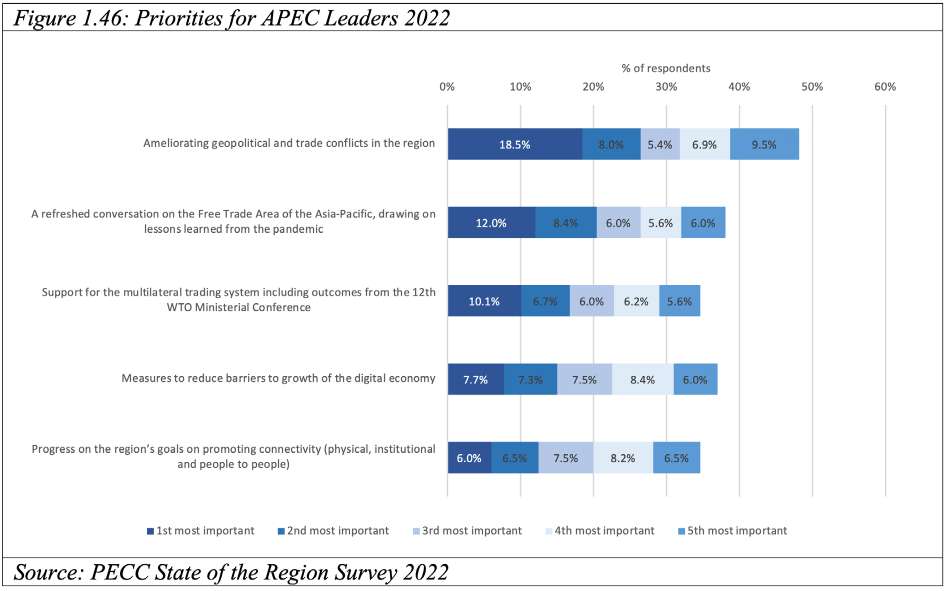
In spite of APEC being an economic forum, 48 percent of respondents selected geopolitical and trade conflicts as a top 5 priority for Leaders’ discussions this November. This follows from previous year’s results when similar issues received the same level of priority. As indicated by respondents views on what impacts attitudes towards trade – 73 percent believe that geopolitical tensions have either a serious or very serious impact on attitudes towards freer trade and investment. Taken together these findings might be interpreted as meaning that the policy community believes that working together on these issues can be a way to help to resolve long-standing trade issues and led to greater tensions over the years. Another interpretation or factor behind these results might be that even though APEC is an economic forum, the Leaders’ Meeting provides an opportunity for side meetings and establish a better, more predictable atmosphere which is well-appreciated by survey respondents.
Open to All Opportunities
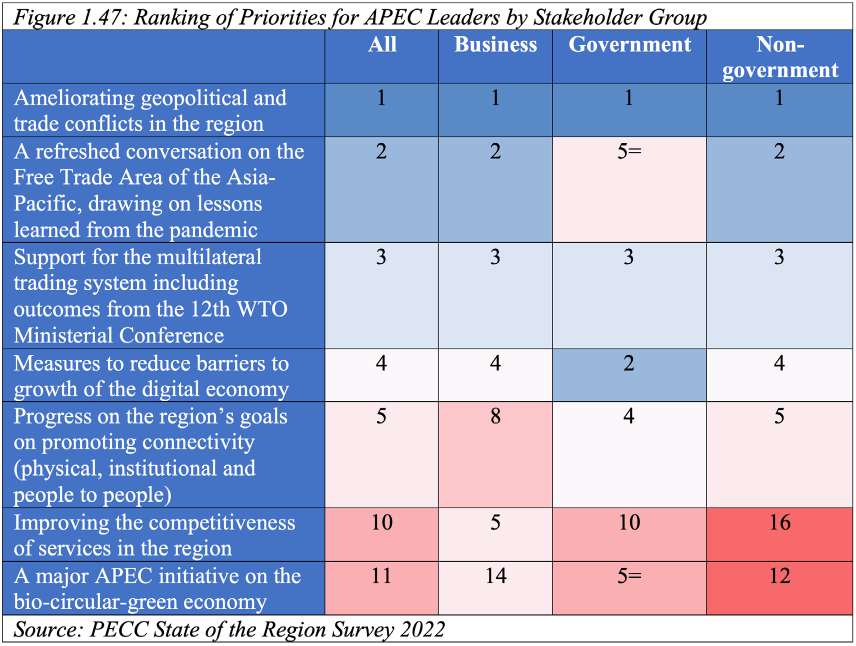
While Figure 1.46 shows the top 5 priorities for APEC Leaders’ discussions by percentage of respondents, Figure 1.47 shows the ranking of priorities by different stakeholder groups. There was broad agreement among different stakeholders on the relative ranking of two issues:
First Place: Ameliorating geopolitical and trade conflicts in the region; and
Third Place: Support for the multilateral trading system including outcomes from the 12th WTO Ministerial Conference.
In addition to showing the top 5 issues selected overall, business, government and non-government respondents, Figure 1.47 shows the other issues selected by stakeholders where they differ.
On the 2nd highest priority business and non-governmental stakeholders were equally aligned on the importance of having a refreshed conversation on the FTAAP (Figure 1.47), but this issue was somewhat lower down in the list of issues for government respondents. This keeps the issue in a relatively high position overall but the difference in importance may be an indication of something else affecting their views. Instead of an FTAAP in second place, government officials had addressing barriers to the growth of the digital economy.
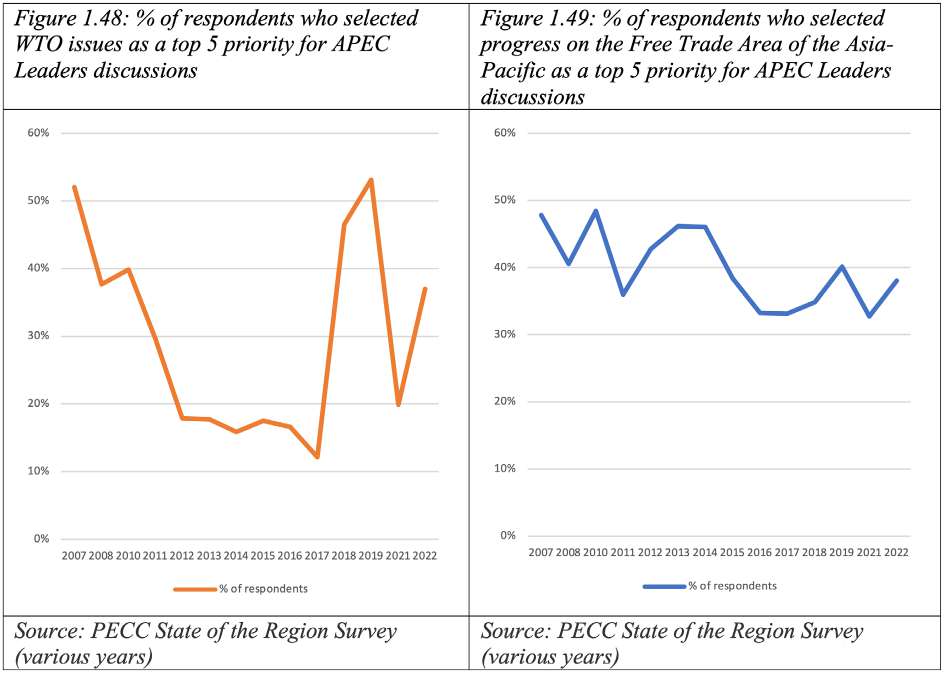
However, in spite of the need to address the tensions that have emerged in the region in recent years, 38 percent of respondents still believe that having a refreshed conversation on a Free Trade Area of the Asia-Pacific is worthwhile making it the second highest priority. The progress evident at the 12th Ministerial Conference of the WTO has renewed regional enthusiasm for the process with support for the outcomes the 3rd highest priority. As a way of comparison, work on the WTO was only 13th highest priority in last year’s survey.
Figure 1.48 and Figure 1.49 show the percentage of respondents who selected support for the WTO and progress towards a Free Trade Area of the Asia-Pacific over the years. While enthusiasm for the WTO had dipped prior to the existential crisis that it faced with the appellate body among survey respondents, a fairly consistent proportion of respondents have selected the FTAAP as a top 5 priority for APEC. The rationale for having what has been called a ‘refreshed conversation on the FTAAP’ is clear – the belief that work on the FTAAP can help the region deal with the issues it confronted during the pandemic. In fact, the pandemic crisis illustrates many of the weaknesses in the region economy which might be addressed through enhanced commitments to regional integration. These include the supply chain logistics, and restrictions on people mobility in addition to the exponential expansion of digital trade and ecommerce throughout the pandemic. It is therefore not such a surprise that digital economy issues also rank highly. This perhaps echoes concerns expressed on a ‘fragmentation of the global economy’ as a risk to growth.
In addition to the momentum that pandemic-related trade concerns add to the need for a refreshed conversation on the FTAAP, progress on the ‘pathways’ is also a major factor. When the FTAAP was first mooted in 2004, the RCEP and CPTPP were not in place, and instead there were the ongoing discussions among Chile, New Zealand, Singapore (and eventually Brunei) to form the P4 or Trans-Pacific Strategic Economic Partnership Agreement and the first of the ASEAN Plus Agreements was not yet completed. Even by the time APEC Leaders agreed on the vision of the FTAAP in 2010, the US had announced its desire to join the P4 and discussions were under way to consolidate the ASEAN Plus agreements that had emerged in the interim.
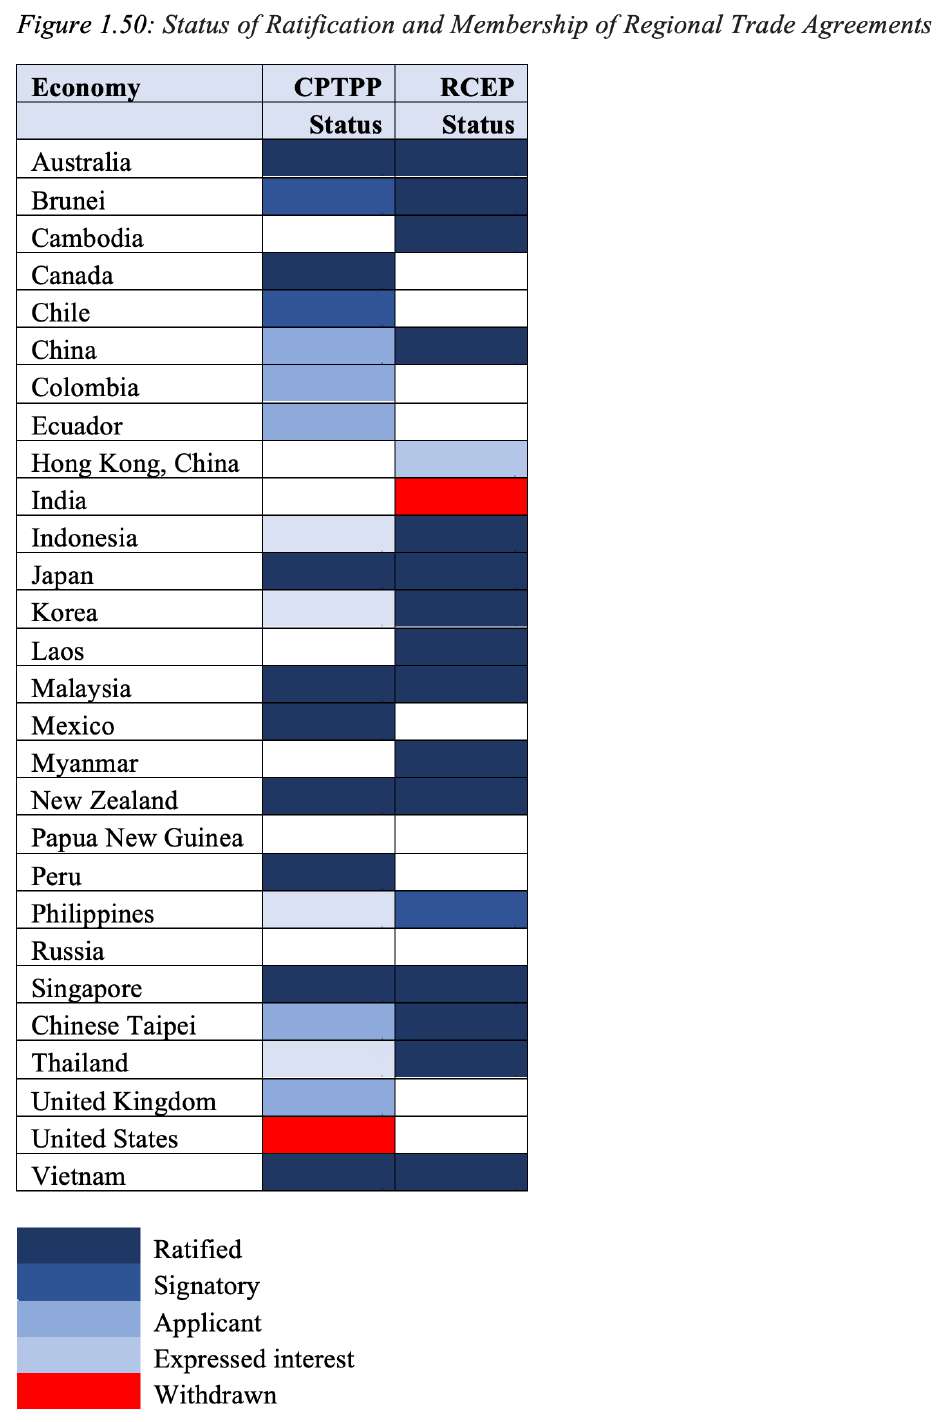
Of the region’s 28 economies (those who are members of APEC, the East Asia Summit, or PECC) all but 3 are either members of one of the two mega-regional trade agreements or interested in joining at least one of them (Figure 1.50). There are currently 6 economies that are members of both the RCEP and CPTPP, that would increase if those RCEP members who have applied or expressed an interest in joining. Of the 11 original signatories to the CPTPP, 9 have now ratified the agreement with Malaysia the most recent. Of the 15 RCEP members 14 have now ratified with the exception being the Philippines. In addition to there being substantial overlap in membership, there is also considerable overlap in the text with close to 30 percent of the text of RCEP influenced by the CPTPP.36 If those economies who have expressed an interested in joining the CPTPP are admitted, it would mean that all RCEP members with the exception of Cambodia, Laos and Myanmar would also be in both agreements.
Reducing Barriers to the Digital Economy
There was high agreement among regional stakeholders on the need to reduce barriers to the growth of the digital economy with this issue ranking 4th most important overall as well as for business and non-government stakeholders but 2nd overall for government respondents. People have become increasingly dependent on the digital economy over the course of the pandemic but governments are finding its cross‐cutting nature a challenge with the traditional industry‐specific approach to policy‐setting37 . For trade, the paradox confronting both policy makers and businesses is that even as digital consumption grows and digital economy initiatives mature, regulations constraining digital trade developments have accelerated, fragmenting the trade landscape—particularly in the APEC region. It is therefore not surprising that this issue ranked so highly as a priority for stakeholders and is also likely a factor in the selection of the ‘fragmentation of the global economy as a risk to growth’.
There is some hope that the regional trade agreements or even digital trade agreements could begin to address these concerns but even for the CPTPP and RCEP which have considerable overlap in membership there are divergences on the specifics of their respective e-commerce chapters. Although both include substantial language on e-commerce, RCEP provides greater flexibility for its members.
In spite of the almost identical language in the objectives of the CPTPP and RCEP e-commerce chapters to provide “frameworks that promote consumer confidence in electronic commerce and of avoiding unnecessary barriers,”38 respondents still consider measures to reduce barriers to growth of the digital economy the 4th highest priority for APEC leaders to address.
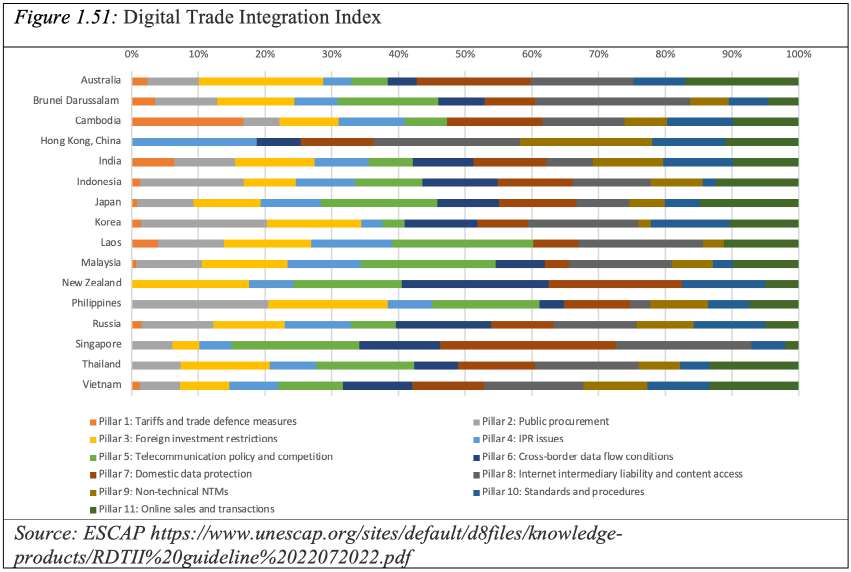
ESCAP argues that “enhancing regional integration through more digital trade between Asia-Pacific economies requires finding common ground on digital trade regulatory approaches as well as reducing policy ambiguity and restrictions that affect intraregional trade in goods and services that are important to the development of the digital economy, such as ICT goods and ICT services.” They have produced a Regional Digital Trade Integration Index (RDTII) based on 11 pillars, a higher score indicates a more complex and therefore harder environment in which to operate. Rather than show the actual scores for economies, Figure 1.51 shows how much each pillar contributed to an economy’s score. One conclusion is that the complexities are different depending on the economy but also that some pillars tend to loom larger in the region. The pillars that contributed the most were: Pillar 8: Internet intermediary liability and content access; Pillar 7: Domestic data protection; and Pillar 5: Telecommunication policy and competition. While having relatively open traditional trade policies, regional economies have more divergence in behind-the-border measures. This calls for greater emphasis on bringing regulatory agencies together to enhance common understanding in the region on ways to reduce barriers to the digital economy.
36 https://www.europarl.europa.eu/RegData/etudes/BRIE/2021/653625/EXPO_BRI(2021)653625_EN.pdf
37 https://www.pecc.org/resources/digital-economy/2705-pecc-signature-project-primer-on-economic-integration-issues-posed-by-the-digital-economy/file
38 RCEP Article 12.2.1: The Parties recognise the economic growth and opportunities provided by electronic commerce, the importance of frameworks that promote consumer confidence in electronic commerce, and the importance of facilitating the development and use of electronic commerce and CPTPP Article 14.2.1: The Parties recognise the economic growth and opportunities provided by electronic commerce and the importance of frameworks that promote
consumer confidence in electronic commerce and of avoiding unnecessary barriers to its use and development.
Connect in all Dimensions
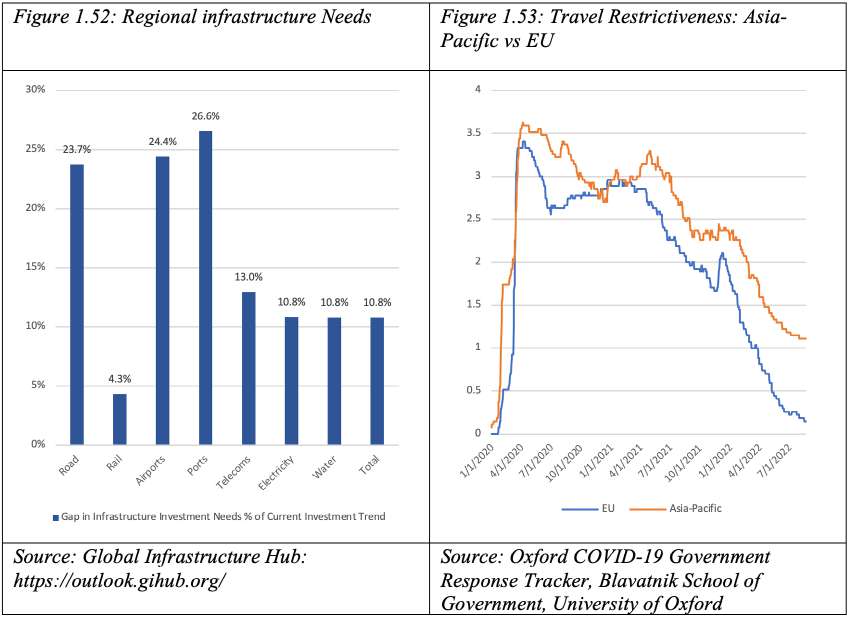
Given the shock that the pandemic and the closure of borders gave to the system, it should be no surprise that the policy community considers progress on the region’s connectivity work as a top priority. A total of 35 percent of respondents selected progress on the region’s goals on promoting connectivity as a top 5 priority. At the same time 27 percent selected an initiative to improve the delivery of logistics services in the region as a priority. While a lot of work needs to be done on the policy front to ease the movement of goods, services, investment and people, ‘hard’ infrastructure also needs to be addressed. Data from the Global Infrastructure Hub suggests that there is a US$7.8 trillion-dollar gap between current investment trends and current needs in infrastructure investment. But more importantly when it comes to regional connectivity, the gaps are considerably higher in the transport sector. (Figure 1.52). Overall, at current trends the region is likely to spend about US$27 trillion on roads; rail; airports; and ports but needs to spend an additional US$5 trillion. Given the supply chain problems economies face, this should be a priority area for investment and longer-term growth.
Of concern is that “despite recovering to pre-pandemic levels, private investment in infrastructure projects has been stagnant for eight consecutive years, and far shy of what is needed to close the infrastructure gap”. On the positive side, investment has been on an upward trend in renewable energy generation with the sector accounting for 48 percent of total private sector investment. By far the largest amounts were in solar and power generation (US$39 billion and US$31 billion respectively.39
While levels of travel restrictiveness have decreased significantly over the past year, the Asia-Pacific, the region is still somewhat closed compared to regions like the Europe. Figure 1.53 shows the average level of restrictiveness for both the Asia-Pacific and the European Union, on a scale of 0 to 4 where 0 is no restrictions and 4 is a ban on all on regions. Forecasts for international travel for the region while showing a recovery still have the Asia-Pacific lagging behind other parts of the world.
As part of APEC’s work on reconnecting the region there has been a strong emphasis on services competitiveness. This work had deep resonance with the business respondents who had ‘improving the competitiveness of services in the region’ as their 5th highest priority. Undoubtedly the recovery of the services sector will be critical to getting regional growth on a more even keel. From a more macroeconomic perspective, the shift in consumer expenditure towards goods, especially consumer durables, over the course of the pandemic contributed significantly to supply chain problems. For example, in the case of the United States, personal consumption expenditure on goods increased from about 21 percent of GDP pre-pandemic to 24 percent in May 2021, while expenditure on services fell from 46 percent to 44 percent. The shift in consumption was the highest was expenditure on consumer durables which in the case of the US has been US$500 billion above trend or some 30 percent higher, while expenditure on recreation services continues to be below trend by about US$30 billion lower during the 1st quarter of 2022. In addition to this, as discussed in the box section, there has been an increased recognition of the critical role that intermediary services play in the economy. Indeed, an initiative to improve the delivery of logistics services fell just shy of the top 5 issues for APEC to address.
39 https://cdn.gihub.org/umbraco/media/4806/global-infrastructure-hub_2022-infrastructure-monitor-report_web.pdf
Balance in all Aspects
As noted earlier, respondents continue to see climate change as a major risk to growth. But while there was generally a strong correlation between issues that respondents see as risks to growth and those they think should be priorities for APEC Leaders to discuss, at first glance it might seem as though climate change and sustainability is an exception. However, at more detailed look at the results show differences among stakeholders on the priority of having APEC Leaders discuss a major initiative on the “bio-circular green economy.” While 33 percent of government respondents selected it as a top 5 issue, the figure was much lower for others, 17 percent of business and 19 percent for non-government. One interpretation of this result might be that more socialization of the concept needs to be done beyond the official process (Figure 1.54).
However, another issue is that respondents were presented with 3 options related to sustainability:
- Promote structural reform for green recovery;
- Sustainability through managing resources including marine and forest resource trade; and
- A major APEC initiative on the bio-circular-green economy.
While the first two are part of ongoing work in APEC it is perhaps the lack an overarching framework for work on sustainability and climate change that make it necessary to have an initiative that can pull-together the various pieces of work being done. As discussed above APEC has existing goals on energy efficiency and adoption of renewables but has also had goals to increase forest cover and frameworks for reducing marine debris amongst others. Taking all options together, a much larger share of respondents selected climate change and sustainable growth issues as a top 5 priority. Moreover, while more respondents selected ameliorating geopolitical and trade conflicts as the 1st most important issue, looking at 2nd to 5th choices, more stakeholders chose climate change related topics (Figure 1.57).
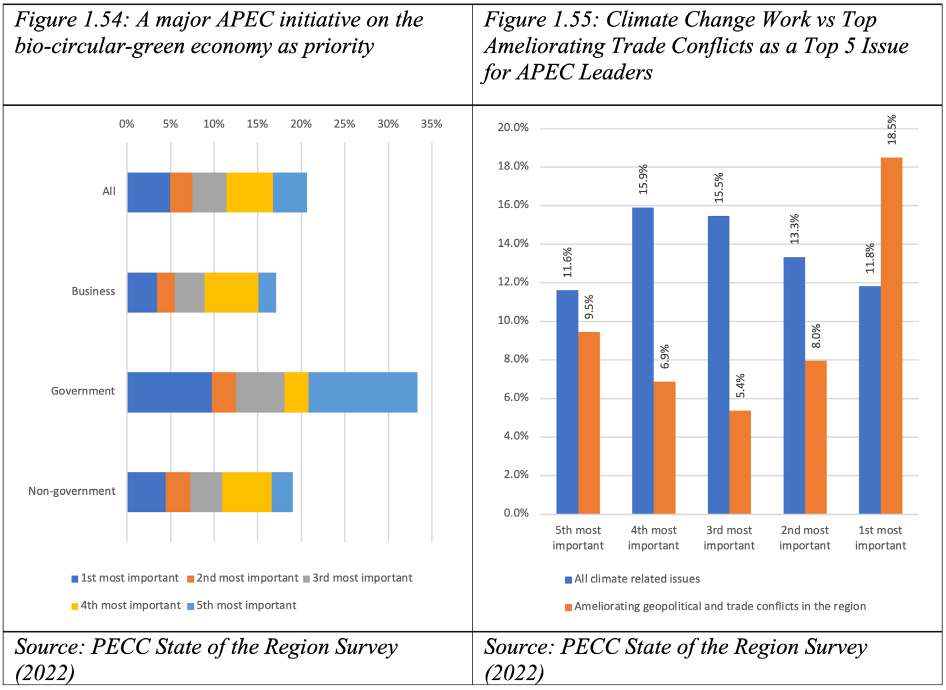
Turning Crises into Opportunities
From 2020-2021 APEC members were able to agree to a 20-year vision and implementation plan. The challenge moving ahead will be to execute that plan. Given the current geo-political situation it may seem a long stretch to try to get there. The outlook for the region is even more uncertain than it was at the height of the pandemic, with risks of inflation getting out of control even with decelerating growth. As indicated by the results of this year’s survey, regional stakeholders are deeply concerned about the future, with risks such as fragmentation of the global economy, inflation and rising protectionism taking center stage. It is therefore not surprising that they also look to APEC Leaders to begin to resolve these issues. The main message is that APEC needs to provide a platform for building habits of cooperation on issues of central importance to stakeholders: open economies; climate change and connectivity.
One such approach is working on practical initiatives of mutual interest and of concern to stakeholders across the board such as dealing with the supply chain chokepoints that arose during the pandemic. In our survey putting in place an initiative to improve the delivery of logistics services in the region came in just short of the top 5 out of 20 competing issues in terms of what respondents felt should be the top priorities for APEC Leaders to address. Roughly at the same level as the recovery of the tourism sector and the promotion of structural reform for a green recovery. As the pandemic demonstrated there is a clear relationship between efficient logistics and the ability of companies to run efficient and resilient supply chains.
As economies exit the pandemic and look to find more sustainable and inclusive growth, the risk is that instead of working on these issues together, the region (and the world) will fragment into different blocs. There is also the question of whether a rubicon has been crossed? Our survey results indicate that while 73 percent of respondents believe that geopolitical tensions have a serious or very serious impact on attitudes to freer trade, ameliorating geopolitical and trade conflicts in the region was still the top priority for APEC Leaders to address. The principles of open-regionalism and mutual benefit considering differences in levels of development and economic and political systems that have served the region well are at risk. APEC has long served as a bridge across the Asia-Pacific providing a platform for building mutual understanding on often difficult issues. This approach is required now more than ever. There are no doubt differences among its members but technological fragmentation alone could lead to losses of 5 percent of GDP for many economies.40 APEC’s long-term vision of vision of “an open, dynamic, resilient and peaceful Asia-Pacific community” to be achieved through the strong, balanced, secure, sustainable and inclusive growth; innovation and digitalization; and trade and investment provides a forward-looking framework but its realization requires the full-commitment of its members, less in rhetoric but also in action. While the current crisis presents real challenges to the region, it also provides an opportunity to demonstrate the value of dialogue. The cost of failure to act is too high with risks such as food insecurity, rising costs of living looming in the near future and climate crises and more pandemics in the longer-term.
40 https://www.imf.org/en/Blogs/Articles/2022/05/22/blog-why-we-must-resist-geoeconomic-fragmentation
<< Previous
Next >>