CHAPTER 2 - THE FUTURE OF JOBS AND SKILLS
CONTRIBUTED BY PROFESSOR KOSTAS MAVROMARAS, DIRECTOR, FUTURE OF EMPLOYMENT AND SKILLS RESEARCH CENTRE, UNIVERSITY OF ADELAIDE
Technology has been the driver of much of humankind’s material development in the recent and distant past and is continuing unabated, some would say accelerated, in this driving role today, through the Fourth Industrial Revolution. As new opportunities and potential benefits continue to emerge at pace, they are intensely debated, not only for their core wealth creating content and the almost boundless horizons they appear to be opening up for humanity, but also because of the uncertainty that surrounds them and the speed and depth at which they bring change. The amazement for its potential is accompanied by a fair measure of human reticence, so much so that the word “disruption” is used to portray the change that technology brings. Disruption is a word that comes with synonyms such as “disturbance, disordering, disarrangement, disarranging, interference, upset, upsetting, unsettling, confusion, confusing” and it is usually reserved for change that is more associated with difficulties rather than with benefits. In view of the stunning innovations we are experiencing, matched by an equally stunning frequency and continuity of appearance, any reticence felt about the technological change the Fourth Industrial Revolution brings would sound unjustified and possibly misplaced.
However, there is one aspect of the Fourth Industrial Revolution where future events may show that such reticence was justified, if not under-estimated, namely, the impact of technology on work, an activity that humans have historically identified themselves with. There is already sufficient evidence showing that automation and artificial intelligence are changing fundamentally the way we work within our economies and the way our economies perceive and value our work. The anticipated loss of jobs in numbers and the anticipated changes in the nature of work is already the subject of an extensive literature, the predictions of which are almost as diverse as their initial assumptions. Whilst it is not possible to foretell what the long-term impact of technology on work will be (at least not without using the right crystal ball), it is almost certain that in the short- and medium-run we are bound to see much change which will require policy interventions of a preventive and corrective nature.
This chapter is an examination of the future of work in the Asia- Pacific region. The general context we use is based on the emerging rich but in many of its aspects still inconclusive literature on the impact of technology on work and our Asia-Pacific region focus is made feasible by the latest 2018 PECC survey with its thematic focus on work and technology. It addresses several questions that are already asked by many people, governments and businesses, such as, (i) how is the Fourth Industrial Revolution changing the nature of work, (ii) what kinds of old jobs will disappear and what kind of and where will new jobs be created, (iii) how do economies of the region acquire the right skills for these new jobs, and (iv) what will happen to those who lose their jobs?
There is a strong view that, in order to enjoy the full benefits of new technologies, we will need capable institutions to develop appropriate new policies. These latter include first, education and training policies to build new skills, second, a labor market policy to enable the efficient utilization of these skills and third, a social care/ security policy to protect those who are left behind and to preserve the social cohesion and ethical foundations of our societies as change creates many new winners and losers. These general policy objectives will need to reflect and respect the economic diversity and inter-dependence of the region’s economies.
Technologies such as automation, artificial intelligence, cloud computing, 3D printing, blockchain and others, lead to better and cheaper ways to do things, but they also usually make some jobs obsolete. These technologies can be usefully differentiated by the balance between the productivity gains they achieve and the individual and social losses that worker displacement causes. It is not only the level of productivity gains and the extent of displacement that matter, but also how these are distributed, their timing and their longer term economic and social impacts.
Historically, new technologies have brought large net material gains and changed many lives and livelihoods. In the process, many workers lost their jobs, experienced lower lifetime income and in many instances completely changed the direction or even ended their working lives. Also, historically, technological change has in many instances created rather mixed outcomes with winners and losers, where losses often remained uncompensated. That is, losses suffered by displaced workers and specific communities that were not compensated by those other workers and communities that gained from the new technology. The overall impacts from past industrial revolutions (that is, both gains and losses) often took long to be realized and the benefits and losses were often unequally distributed.
BOX 1 - SOCIETAL IMPACT OF ARTIFICIAL INTELLIGENCE: OPPORTUNITIES AND CHALLENGES OF A TECH-CENTRIC FUTURE OF WORK
Contributed by Professor Jiro Kokuryo, Keio University and Professor Kar Yan Tam, Hong Kong University of Science and Technology on behalf of the Association of Pacific Rim Universities
Amid the on-going debate over how artificial intelligence (AI) and the broader technological changes taking place – often referred to as the 4th Industrial Revolution - will affect society and impact the future of work in the Asia Pacific region, the Association of Pacific Rim Universities (APRU) has been bringing together scholars and industry experts across two research projects to analyze and address the affiliated economic risks and reservations.
If governed adequately, AI has the potential to benefit humankind enormously. However, if mismanaged, it also has the potential to harm society. The project “AI for Everyone: Benefitting from and building trust in the technology”, led by Professor Jiro Kokuryo from Keio University and Professor Toby Walsh from UNSW Sydney, explores the possible implication of societal challenges such as;
- Fear of “black box” machines manipulating human society
- Recognition that AI may be put to unethical use and that some restraining arrangements are necessary
- Risk of inference attack on privacy
- Fear that AI may deepen the gap between the rich and the poor.
The project title reflects the belief that “access to the benefits of AI, awareness about the nature of the technology, governance of the technology and its development process with a focus on responsible development, should be transparent, open, understood by and accessible to all people regardless of their geographic, generational, economic, cultural and/or other social background.” The project features 12 papers and policy insights from leading researchers from the Asia Pacific offering analysis and solutions to a range of topics:
- How development of Artificial intelligence technology will cause changes in crime and criminal law
- Flesh-and-Blood, Corporate, Robotic? Moral Agents of Restraint and the Problem of Misplaced Responsibility in War
- Best Bot Friend (BBF): The Emotional and Social Implications of Socializing with an AI
- The Dialectics of Individuality: Modernity, Panopticon, and Dataism
- Designing Theory-Driven Use-Centric Explainable AI: A Medical Diagnostics Example
- Political Bot Detection on Social Networks
- Explaining Decisions of Black-box AI Models
- AI Education for Everyone: How to Integrate Future Labor Force into Digital Frontier?
- Analyzing Privacy of Deep Learning in Adversarial Settings
- How weak has been weak Artificial Intelligence? The unseen societal consequences of machine learning
- Federated Transfer Learning: Privacy-preserving AI for Everyone
- Toward a Certification Framework for Trustworthy AI Systems
The project, hosted by the Hong Kong University of Science and Technology (HKUST) and led by Professor Kar Yan Tam, Dean of HKUST Business School analyzes the impact of AI and automation on the ‘Transformation of Work in Asia-Pacific in the 21st Century’. Leading experts across the region have collaborated on a study exploring background, opportunities and challenges of technological development on the future of work that are feeding into a set of policy recommendations. According to Professor Kar Yan Tam “AI and automation will transform the future of work. This project has offered a unique forum for open discussions offering the opportunity to share insights with regional governments, business and non-profit organizations in relation to AI and its impact on the future of work”.
Loss of jobs has been one of the primary concerns voiced at artificial intelligence. While fear of job loss is nothing new in the interaction between technology and society, AI’s flexibility in performing highly contextual work adds a whole new dimension to the problem.
IBM’s introduction of System/360, the first mainframe computer, in 1964 initiated the modern age of computing, ushering in rapid advances in digital communication and transforming the way we interact with information. Now, we are on the cusp of the Fourth Industrial Revolution, which will revolutionize the very fabric of modern life at an unprecedented scale and speed. With the development of the “Internet of Things,” a network of Internet-connected objects able to collect and exchange data using embedded sensors, there is more personal data in the hands of corporations than ever before. Combined with intelligent machinery, advanced robotics, and global interconnectivity via personal electronic devices, the controllers of this data are able to predict and influence every segment of our society, from economics and politics to our private lives.
Driverless cars, remote work arrangements, fully automated factories, and managerless companies are no longer ludicrous ideas of the far future.
Occupations and industries have grown and contracted over time. The third industrial revolution has encouraged the rapid expansion of more complex jobs for which there is demand for higher education skills, but many routine jobs remain. Routine jobs attract less earnings over time, so that pay inequality has become a feature of contemporary economies. However, the growth of high-skilled, non-routine jobs plateaued in the fourth industrial revolution leading to anxiety about the future. Much future-oriented analysis has been based on the experience of Western economies, however, that analysis often downplays significant variations in those experiences.
Economist John Maynard Keynes in 1930, writing in 1930, warned that “the increase of technical efficiency has been taking place faster than we can deal with the problem of labor absorption; the improvement in the standard of life has been a little too quick”. This quote underlines the extent to which technological change always shaped the distribution of employment in various occupations and industries over time.
During the 1st and 2nd IR, the most notable job losses were in agriculture. During the 3rd IR, most job losses occurred among routine jobs, both manual and low-skilled service jobs. In the 4th IR, relatively high-skilled blue collar (e.g. machine operators) and while-collar (bookkeepers and product testers) jobs are being reduced by new technology in advanced and developing economies. However, technological unemployment has been counter-balanced by the creation of new jobs and emergence of new industries.
While previous industrial revolutions have impacted jobs at different skills levels, particularly noteworthy in the 4th IR is the higher demand of interpersonal non-routine jobs compared with analytical non-routine jobs. This demand disparity in jobs is reflected in the returns to education. Prior to the consolidation of the digital economy in the 1980s, college degrees did not yield significantly greater returns compared to high school degrees. In other words, the pay of high school graduates was not much different to that of university degree holders. However, that pay gap increased during the 1970s through to the 1990s.
Since 2000 with the onset of IR 4.0, technological change no longer correlates with the real wage growth of highly educated people. Research suggests that the demand for higher education skills increased only up to the year 2000, and then began to decline. In the context of a continuing increase in the supply of highly educated people, many high-skilled workers have been hired into jobs previously undertaken by low-skilled workers. Under-utilization of skills therefore becomes a policy issue.
These considerations suggest two further important questions: does technological change lead to net unemployment and what effect does technological change have on economic inequality and the quality of jobs more generally?
For instance, the emergence of video games negatively affected the toy industry leading to the closure of toy retailers such as Toys ‘R’ US. However, the video game industry has been expanding rapidly and now has more than 65,000 direct employees in the US. Evidence from France indicates that over the past 15 years the internet destroyed 0.5 million jobs but created 1.2 million, thereby being a substantial net job generator.
A feature of IR 4.0 is that routine workers have been affected by a deterioration in job quality regardless of technological change. This is the consequence of employers’ seeking labor market flexibility by favoring non-standard forms of employment, including temporary, part-time, and self-employed work and short-term agency work. These flexible forms of employment give rise to insecurity and feelings of precariousness.
As highlighted above, governments in Asia-Pacific region have made efforts to facilitate technology-based economic growth while minimizing its negative impact on employment. Their experiences provide several valuable lessons.
First, Asian experiences of technological development highlight the importance of public policy in the development of technology and promotion of economic competitiveness. The rapid economic transformation of key Asian economies including Japan, Korea, Singapore, and China demonstrate that successful transformation from agricultural societies has been facilitated by distinctive governmental innovation systems.
Second, the Asian experience of technological change differs depending on context. Within the Asia-Pacific region, no two experiences of technological change are the same. The success of a policy in one economy is unlikely to guarantee the success in other economies. Government policy needs to be tailored to those aspects of the material, cultural and institutional context that are most likely to provide comparative advantage.
Third, Asia-Pacific policy-makers need to address the negative impact of technological change on jobs. Despite avoiding higher levels of unemployment experienced, the rapid growth of information technology has increased the returns to investment in IT-embedded, capital goods and facilitated outsourcing and offshoring of work, which together have contributed to rising income inequality and little concern with the overall quality of jobs.
The type of work at which humans still outperform machines can be broadly categorized as judgment work: tasks that involve synthesizing experience, discretion, empathy, improvisation, and an understanding of organizational history and culture to make decisions that reach beyond simply interpreting data. AI can analyze data at a speed and efficiency unsurpassable by humans, but with the reports written and solutions suggested by AI, human workers will extract the insights behind numbers and facts and devise creative solutions.
Higher-level managers are relatively safe from elimination, since the increasing complexity of business situations require skills even the most advanced of bots will not master for the time being, such as being creative, providing emotional support, and building relationships. However, as previously mentioned, many of the administrative, less cognitively demanding duties usually held by mid-level managers are already being automated.
Some of the relevant skill sets required to ensure the adaptability of human capital to remain gainfully employed in the future economy could include “hard skills” such as in the scientific and technical realms as well as the soft skills to communicate and collaborate effectively with clients / customers and various stakeholders in various projects.
In addition, future employment needs would also mean the need for effective adult learning throughout one’s working life. This would entail the provision of professional conversion programs and retraining or upgrading of skillsets for displaced workers or mid-career switches.
With increasing demand on time from an evolving economy, the educational system has to keep up with rapid changes in technology and work place. Course or modular offerings could include a formal context in classroom settings, on-line learning, virtual reality elements, gaming sensibilities and a lot of real time learning. In this context, several key stake holders will have to be involved such as the relevant educational institutions, employers through the Trade Association and Chambers (TACs), private educational providers and educational VWOs (not for profit).
Another emerging trend could be the boundaries between schooling and work will become increasingly blurred as new systems develop a seamless model of learning, exposure, and practical experience into students’ lives. For displaced or employed individuals, more learning systems should migrate online as modular on-line learning systems and just in time courses to keep up with the changing skills sets required of the future work place.
Educational institutions will likely need to teach students to be lifelong learners through more online content, in situ learning and other employer engagement scenarios to increase employable skills in an increasingly information driven digitized economy.
There also exists a need for more collaboration with employers to deliver on-demand or on-the-job training programs especially with the need to retrain a large number of the work force to manage increasing automation.
The above article is drawing on insights developed by the following academic experts as part of two APRU projects exploring the impact of AI.
Transformation of Work in Asia-Pacific in the 21st Century Stephen Frenkel, UNSW Sydney; Jikyeong Kang, Asian Institute of Management; Sunghoon Kim, UNSW Sydney, Jungwoo Lee, Yonsei University; Myung Jae Moon, Yonsei University; Namgyoo K. Park, Seoul National University; Hideaki Shiroyama, University of Tokyo; Faizal Bin Yahya, National University of Singapore. Lead academic; Kar Yan Tam, Hong Kong University of Science and Technology. Project supported by Google.org.
‘AI for Everyone: Benefitting from and Building Trust in the Technology’, Roman Dremliuga, Far Eastern Federal University; Toni Erskine, The Australian National University; Danit Gal, Peking University/ Keio University; Chong-Fuk Lau, The Chinese University of Hong Kong; Brian Y. Lim, National University of Singapore; Raúl Monroy, Tecnológico de Monterrey; Sameer Singh, UC Irvine; Yifan Shen, Fudan University; Reza Shokri, National University of Singapore; Felipe Tobar, Universidad de Chile; Qiang Yang, Hong Kong Universtiy Science and Technology, Roland Yap, National University of Singapore. Lead academics, Jiro Kokuryo, Keio University; Tony Walsh, UNSW Sydney. Project supported by Google.org
Contact This email address is being protected from spambots. You need JavaScript enabled to view it. to request copy of final project outputs.
The question we will ask here is whether we could expect history to repeat itself in the way today’s Fourth Industrial Revolution creates and distributes its benefits. It is often argued that the economic and social mechanisms of change are not new, so we can rely on historical evidence to guide us through change (the “we have been here before” argument).
It is counter-argued that several pertinent factors appear to be different this time, perhaps not necessarily in nature, but certainly in intensity. Such factors include the speed at which innovation happens, arguably historically unprecedented: fast change may be harder to adjust to. Also, there is the continued unbundling of production and the presence of global value chains, with the new possibilities for economic connectivity and interdependence they create: distribution would clearly be impacted. Moreover, with the co-existence of several new and powerful general-purposetechnologies, it is argued that this time around technological change and its impacts will be much deeper. So much deeper, that what we observe today is just the beginning of a very long road of deep technological change. Deeper change would require stronger economic adaptation and social assimilation and distribution efforts that would also be expected to create a larger redistribution of wealth gains.
It should come as no surprise, therefore, that there is much uncertainty about the economic, social and ethical implications of current technological change, often expressed in either overly optimistic or overly pessimistic forecasts, the differences between them based more on different assumptions than different evidence from the labor and technology markets.
HOW DO WE EXPECT THE NATURE OF WORK TO CHANGE?
Asking how technology will influence the nature of work must start with the appreciation that the nature of work has been evolving continuously throughout the industrial era. Technological change has been the main driver of the evolution of work today’s advanced economies. Work has become much more productive, increasingly more skilled, requiring higher levels of training and education, and is better paid. Work is also more widely shared within the population, especially with the rise in female participation, but an average lifetime today contains a smaller proportion of work and a larger proportion in education, leisure, retirement or other types of labour force stratus. Workers in advanced economies also have tended to work fewer hours per week than was the case some decades back, but in some cases this trend appears to be reversing. In the course of the evolution of work in the last century, many tasks became standardized and cheaper through new technologies, which made them easier to mechanize and, in many cases, fully automate.
A critical distinction for understanding the Asia-Pacific region is that its advanced economies face the Fourth Industrial Revolution from a different starting point than that of the emerging economies in the region. The differences will manifest themselves in the capabilities of relevant institutions and infrastructure, the domestic human capital endowment (e.g. education and training, health), the proportion of the population employed in the formal sector and other factors which will influence the capacity of an economy to absorb and utilize technology for development. Several of these differences could give rise to potential complementarities and therefore encourage cooperation within the region, making for different optimal workforce development pathways and differences in the evolution of work within the region.
From the 2018 PECC survey we find that the expectations in the region are that the size of workforces will decline due to the introduction of new technologies, the level of skills required will rise and that the occupational and skills structure of the workforces will change, all in ways related to the expectations in the particular part of the region the survey respondents are located.
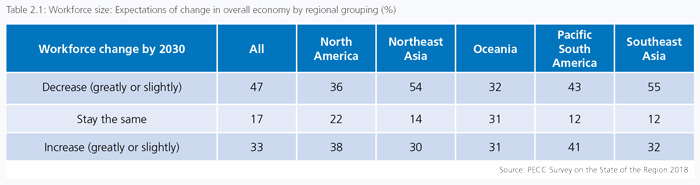
Table 2.1 above offers a very broad picture on employment expectations showing that in Southeast Asia and Northeast Asia more respondents expect employment losses than gains, while in Oceania and the Americas the opinions are split, a bit less polarized in Oceania where survey respondents expect the least change.2 Figure 2.1 below looks at the expected size of the workforce through a more detailed lens, presenting the net difference in the proportion of expectation of gains and losses by sector following the question “By 2030, how do you think new technologies (for example but not limited to artificial intelligence, cloud-computing, 3D printing, blockchain, and advanced robotics) will impact the number of jobs in your economy overall and for the list of sectors below?”.
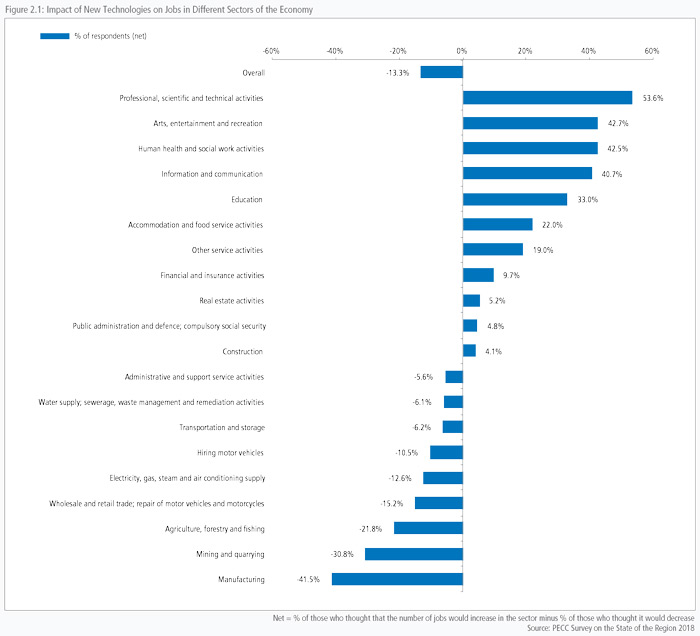
Respondents from both emerging and advanced economies appear to agree on the direction of change at the sectoral level. The strongest expectations that the number of jobs will increase were expressed in the following sectors: education; arts, entertainment and recreation; professional, scientific and technical activities, human health and social work activities; and information and communication.
The strongest sectors for a decline in jobs were: manufacturing; mining; and wholesale and retail trade. There was only one sector in which there was a difference in views on the direction of change – real estate. More respondents from emerging economies expect that there will be more jobs in this sector, while more from the advanced economies expect that there will be fewer jobs in that sector by 2030.
Anticipating the impact of technology on employment by sector will only describe part of the overall impact of the Fourth Industrial Revolution on work. There will be other aspects of employment that will matter, such as occupation or location. It is worth noting that as each sector utilizes several different occupations in different proportions, and that each occupation will be impacted by technology in an individual and specific way, the unique mix of occupations within each sector will play its own role in the overall impact of technology on the sector’s employment.
WHAT KINDS OF OLD JOBS WILL DISAPPEAR AND WHAT NEW JOBS WILL BE CREATED?
Figure 2.2 shows us the net difference in the expectations for an increase or decrease in the number of workers by occupation. The question asked is “how do you think new technologies will impact the number of jobs in the following occupational categories in your economy by 2030?”
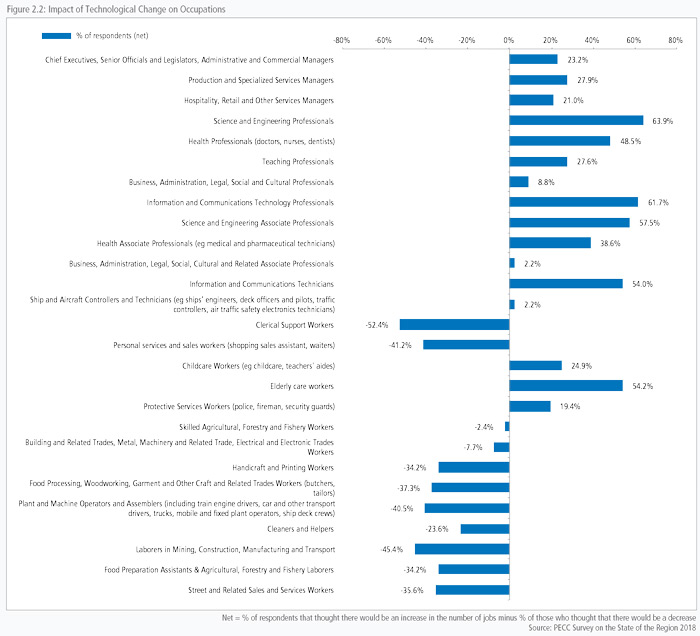
In a similar way that a sector employs several occupations, and each of these occupations may be impacted by technology differently, an occupation uses several generic tasks and each task is subject to automation differently. The net percentage in Figure 2.2 above provides a very clear picture with science and engineering, information and communication technologies, health and care being the occupations that are expected to create the most jobs. Table 2.2 shows the geographic distribution of the strongest job creation by showing the occupations with the highest expectation that they will “increase greatly”.
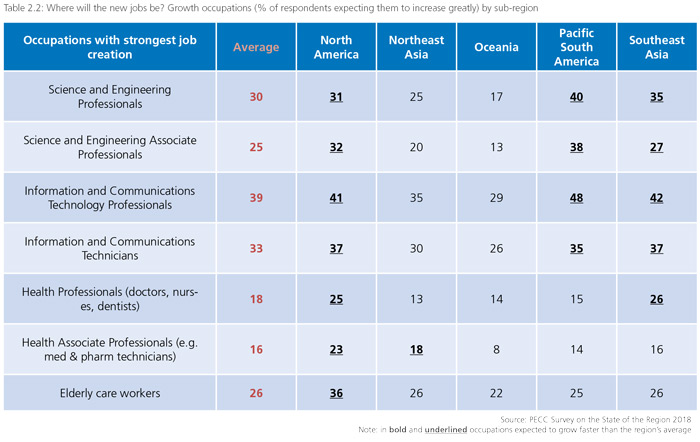
The strongest job creation is anticipated to be in ICT professionals and ICT technicians, and the strongest overall job creation is expected in North America. Table 2.3 below shows the geographic distribution of the occupations with the strongest expectations for employment decline by 2030.
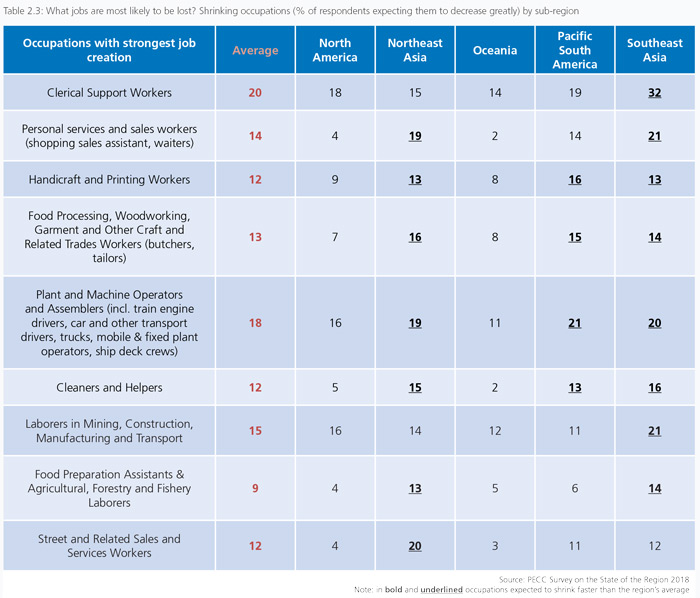
These are all occupations with a high proportion of repetitive tasks in them that make each one of them in their own way susceptible to automation. The process through which their product is created, and their services are provided will be transformed in a way that will retain human labor to provide the human element in tasks that cannot be automated, while the remainder will be provided through advanced new technologies, thus increasing labour productivity.
The speed of this transformation will be product- and servicespecific and will be greatly influenced by the institutions within which the transformation takes place. For example, one estimate suggests that the introduction of driverless cars in the United States could directly eliminate 1.3 to 2.3 million workers’ jobs over the next 30 years.5 Table 2.3 shows the average expectations for the whole region and their geographic differences within the region. Throughout the region, there is a shared expectation for strong displacement for (i) clerical support workers, (ii) plant and machine operators and assemblers (including train engine drivers, car and other transport drivers, trucks, mobile & fixed plant operators, ship deck crews), and (iii) laborers in mining, construction, manufacturing and transport.
For the remaining occupations listed in Table 2.3 the strongest expectations of displacement are found in Northeast Asia, Southeast Asia, and the Pacific South American economies and the weakest expectations of displacement are found in North America and Oceania. This list of occupations can be used to provide useful sociodemographic and economic profiling of the workers most likely to lose their jobs along with critical information on the skills, knowledge and experience that they will bring with them to support a drive to re-train and up-skill them in preparation for the new jobs that emerge.
DO WE HAVE THE RIGHT SKILLS IN THE REGION FOR THESE NEW JOBS?
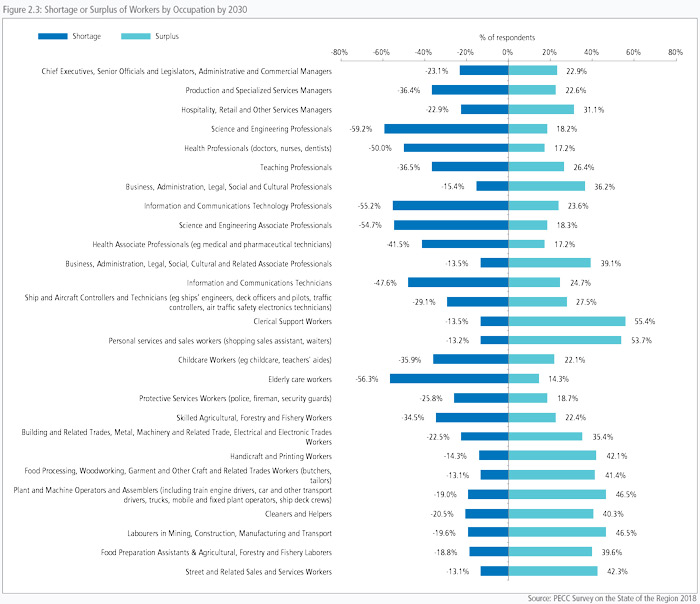
Worker displacement will create surpluses of workers and skills in some occupations while there will be shortages of workers and skills in growth occupations. How well the economy adjusts to technological change will depend on its capacity to match the skills on offer by all available workers (employed or looking for work) with the skills required by all jobs (vacant or filled). Given the anticipated magnitude of the change we are expecting, one should expect extensive skills mismatch (that is, simultaneously extensive skill shortages in some areas and extensive skill surpluses in other areas), increased labor market turnover, including jobto- job transitions, and that all types and forms of education and training, labor market reform, and social care/security reform, will play a critical role in helping economic and social life recalibrate and re-balance itself. Figure 2.3 shows the extent of anticipated skills mismatch due to technological change.
The question that was asked for Figure 2.3 was “Which occupations do you anticipate will develop shortages or surpluses of workers in your economy due to new technologies by 2030 (tick one box in each category)”. The bars to the left (right) show expectations for a shortage (surplus) in the occupation and the percentage needed to reach 100% when the two are added represents the expectation that the skills will be well-matched. Thus, for example, for occupation elderly care workers, 56.3 percent of respondents expect shortages, 14.3 percent expect surpluses, and (100 – 56.3 – 14.3 =) 29.4 percent expect that skills will be well-matched in this occupation. (Note that the shorter the overall bar is in the figure, the more respondents expected well-matched skills in the future.) Overall, respondents tended to think that by 2030 there would be a surplus of workers in the lower skilled job categories and a shortage in higher skills.
Below we show the geographic distribution of two selections of occupations, first, those expected to be in intense skills shortage (Table 2.4) and second, those expected to be in intense surplus (Table 2.5), both by 2030.
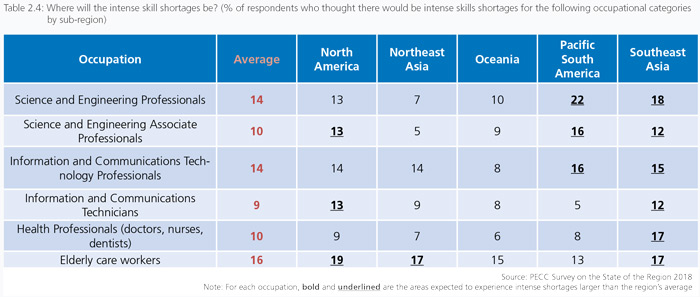
Intense shortages above the region’s average are found predominantly in Southeast Asia and below the region’s average in Northeast Asian and Oceania.
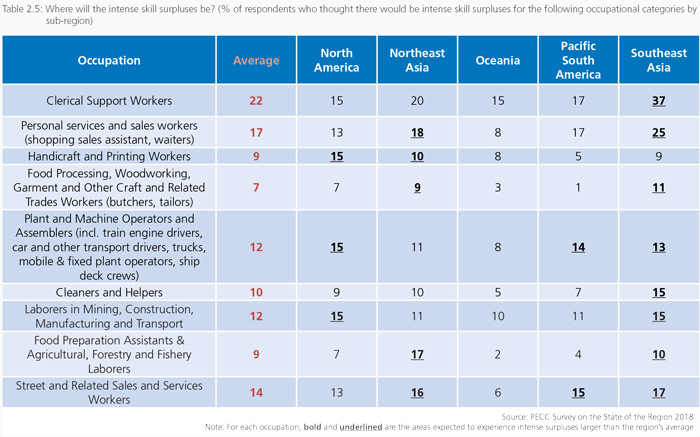
A similarly diverse picture emerges for the geography of those occupations expected to be in intense surplus by 2030, with Southeast Asian respondents expecting intense surpluses, but also North America and Northeast Asia showing above average percentages for several of the shrinking occupations.
It is important to note the difference in the geographic patterns of occupations expected to strongly increase or decrease in size presented in Tables 2.2 and 2.3, and the patterns of occupations that are expected to be in intense shortage or surplus in Table 2.4 and 2.5.
THE IMPACT OF TECHNOLOGICAL CHANGE BY OCCUPATION
Figure 2.4 below puts together the information on occupation size and shortages/surpluses for all occupations. We use the net growth information in Figure 2.2 and we derive a similar net shortage or surplus percentage from Figure 2.3 (where a negative indicates a net shortage and a positive a net surplus) and combine them in Figure 2.4. The figure clearly shows a positive association between growth and job creation. Starting from the top left with clerical and support workers (with a job shrinking expectation at 52% and a skills surplus at 42%), going through the center of the figure with ship and aircraft controllers and technicians (+2%, -2%: expected to be one of the most stable occupations) all the way to the bottom right where high growth and high skill shortages occupations are bunched up, such as science and engineering professionals and their associates, ICT professionals and their technicians.
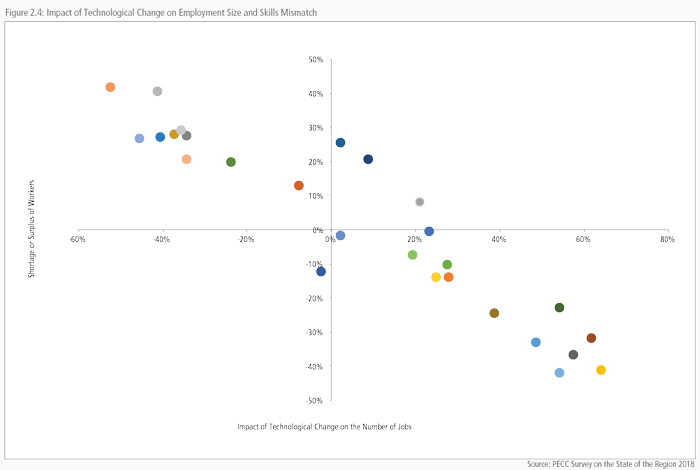
Figure 2.4 suggests several ways in which the occupations could be bunched up in separate categories. Broadly speaking, we could have occupations split into the four quadrants in Figure 2.4:
More Jobs and Surplus of Workers (North-East quadrant)
- Hospitality, Retail and Other Services Managers
- Business, Administration, Legal, Social, Cultural and Related Associate Professionals
- Business, Administration, Legal, Social and Cultural Professionals
More Jobs and Shortage of Workers (South-East quadrant)
- Chief Executives, Senior Officials and Legislators, Administrative and Commercial Managers
- Production and Specialized Services Managers
- Science and Engineering Professionals
- Health Professionals (doctors, nurses, dentists)
- Teaching Professionals
- Information and Communications Technology Professionals
- Science and Engineering Associate Professionals
- Health Associate Professionals (e.g., medical and pharmaceutical technicians)
- Information and Communications Technicians
- Ship and Aircraft Controllers and Technicians (e.g., ships’ engineers, deck officers and pilots, traffic controllers, air traffic safety electronics technicians)
- Childcare Workers (e.g., childcare, teachers’ aides)
- Elderly care workers
- Protective Services Workers (police, fireman, security guards)
Fewer Jobs and Shortage of Workers (South-West quadrant)
- Skilled Agricultural, Forestry and Fishery Workers
Few Jobs and Surplus of Workers (North-West quadrant)
- Clerical Support Workers
- Personal services and sales workers (shopping sales assistant, waiters)
- Building and Related Trades, Metal, Machinery and Related Trade, Electrical and Electronic Trades Workers
- Handicraft and Printing Workers
- Food Processing, Woodworking, Garment and Other Craft and Related Trades Workers (butchers, tailors)
- Plant and Machine Operators and Assemblers (including train engine drivers, car and other transport drivers, trucks, mobile and fixed plant operators, ship deck crews)
- Cleaners and Helpers
- Laborers in Mining, Construction, Manufacturing and Transport
- Food Preparation Assistants & Agricultural, Forestry and Fishery Laborers
- Street and Related Sales and Services Workers
Of the four quadrants it is the South-East and the North-West that make the most intuitive sense. The former (SE) contains the growing occupations where shortages in the skills required by the occupation are strongly expected, and the latter (NW) contains the shrinking occupations where surpluses of the skills required are also strongly expected.
Another way to cut this data would be by splitting it into the high decline occupations (at the top of the NW quadrant), the stable occupations (in the middle of the diagram belonging to all quadrants), and the high growth occupations (at the bottom of the SE quadrant). This way would probably find a clearer relationship with the underlying concepts of automation and worker displacement.
Declining
- Clerical Support Workers
- Personal services and sales workers (shopping sales assistant, waiters)
- Handicraft and Printing Workers
- Food Processing, Woodworking, Garment and Other Craft and Related Trades Workers (butchers, tailors)
- Plant and Machine Operators and Assemblers (including train engine drivers, car and other transport drivers, trucks, mobile and fixed plant operators, ship deck crews)
- Cleaners and Helpers
- Laborers in Mining, Construction, Manufacturing and Transport
- Food Preparation Assistants & Agricultural, Forestry and Fishery Laborers
- Street and Related Sales and Services Workers
Stable
- Ship and Aircraft Controllers and Technicians (e.g., ships’ engineers, deck officers and pilots, traffic controllers, air traffic safety electronics technicians)
- Childcare Workers (e.g., childcare, teachers’ aides)
- Teaching Professionals
- Chief Executives, Senior Officials and Legislators, Administrative and Commercial Managers
- Production and Specialized Services Managers
- Building and Related Trades, Metal, Machinery and Related Trade, Electrical and Electronic Trades Workers
- Hospitality, Retail and Other Services Managers
- Business, Administration, Legal, Social, Cultural and Related Associate Professionals
- Business, Administration, Legal, Social and Cultural Professionals
Growing
- Science and Engineering Professionals
- Health Professionals (doctors, nurses, dentists)
- Information and Communications Technology Professionals
- Science and Engineering Associate Professionals
- Health Associate Professionals (e.g., medical and pharmaceutical technicians)
- Information and Communications Technicians
- Elderly care workers
- Protective Services Workers (police, fireman, security guards)
It is worth noting how close these categories are to those introduced earlier in Tables 2.4 and 2.5.
THE IMPACT OF TECHNOLOGICAL CHANGE BY OCCUPATION: DO EMERGING AND ADVANCED ECONOMIES EXPECT TO TRANSFORM DIFFERENTLY?
There are many reasons why emerging and advanced economies may respond differently in the way technology may impact jobs numbers and how skills are matched as their labor markets transform. As already mentioned, the starting point for this transformation will differ in its economic and institutional fundamentals between emerging and advanced economies, in ways that may influence how the region gets together to create cooperative and/or competitive solutions in its efforts to adapt to new technologies. This is a discussion that needs to be developed in the region as the transformation begins, namely, to what degree will the Fourth Industrial Revolution bring the different economies in the region closer to cooperation and/or competition and how could APEC best serve the joint interests of the region. This discussion has gained added urgency in the last two years and has been clearly stated in the 2018 PECC survey where the top risk for growth in the region in the next 2-3 years has been “increased protectionism and trade wars” (see Chapter 1 for more details).
BOX 2 - THE APEC APP CHALLENGE: SKILLS FOR A NEW GENERATION
Contributed by: John Karr, Senior Director, Technology Programs, the Asia Foundation
Papua New Guinea’s Crystal Kewe may be advancing more than just her family’s financial prospects through her work in the IT sector, she’s also inspiring a generation of young women in PNG to consider their own potential as digital entrepreneurs.
A self-taught software developer who learned how to code from the Internet and from watching YouTube videos, Crystal launched her first IT business when she was 15.

This year she took her skills and creative energy to the 2018 APEC App Challenge – a competition for software developers from APEC economies – and won first prize. Now 19-years old, Crystal leveraged skills she acquired in non-traditional ways to build a mobile e-commerce platform designed to help low income women weavers in PNG access new markets for their products. Given Crystal’s dedication to the ideas she has developed, the future of inclusive growth in the Asia-Pacific may well be led by local innovators, designers, and developers who have honed their skills and built their own human capital in new and unique ways.
This is an important message for the region’s policy makers. In Asia, where manufacturing-led job growth over the last halfcentury has been a key driver of prosperity, the need to find new ways to deliver training and essential skills to workers is critical to the continued development of the region. Workers with access to a diverse set of education and training options are likely to have a greater chance of remaining competitive in a rapidly modernizing marketplace. This is particularly the case with digital skills and advanced technical knowledge such as software development and design. Demand for these and other skills are expected to grow significantly over the next ten years and will be critical to expanding economic growth in a more inclusive and innovation-led fashion.
Crystal’s story is indicative of an increasing trend among technology professionals in the region. Many are gathering new skills from online resources and among communities they meet and interact with on the Internet. And this quality was on vivid display at the APEC App Challenge where 14 teams of software developers and designers from nine APEC economies participated in a 24-hour app development competition centered on one essential question: how can technology bring trade opportunities to entrepreneurs in the informal sectors of APEC economies?
While rich in culture, craftsmanship and entrepreneurial spirit, the informal sectors of APEC economies have yet to fully capture the benefit of technology-driven trade which would help them integrate into the broader economy. In PNG, promoting the development of micro-entrepreneurship in the informal economy is considered by many to be a necessary step towards the emergence of a class of more formal entrepreneurs in the SME sector.
Ignored by larger e-commerce solutions, the challenge of drawing informal actors into trade is well suited for local entrepreneurs who know their domestic context and the unique challenges these economies present. This was the message of the App Challenge - long-standing bottlenecks that hinder economic growth in certain markets do not require international interventions or complex development plans. They can be addressed by local entrepreneurs and developers many of whom were self-taught or developed their most marketable skills by accessing training and education outside of formal institutions.
The concepts generated during the 24-hour hackathon will likely have far-reaching effects for micro-entrepreneurs in Papua New Guinea and other informal economies.
The concepts generated during the 24-hour hackathon will likely have far-reaching effects for micro-entrepreneurs in Papua New Guinea and other informal economies. Crystal Kewe leveraged her programming acumen to develop Biluminous, an app designed to help local artisanal weavers of PNG’s culturally significant bilum bags connect with more customers and grow their businesses. But these ideas can also scale to other economies and connect a variety of MSMEs to new business opportunities. The APEC App Challenge helps us understand the creative potential of the region and the new ways that motivated individuals can build their own human capital.
An initiative of The Asia Foundation, the APEC Secretariat, and Google, the APEC App Challenge highlights the importance of a range of digital skills that empower the region’s next generation who, in turn, will build the platforms and services which will help micro- and small businesses showcase their craft to the world. Crystal Kewe is a great example of this local capacity. She represents a generation of highly skilled and creative young people that are just now beginning to build the infrastructure that will help connect APEC entrepreneurs at every level of society to new opportunities to prosper and thrive in a global economy.
To shed some preliminary light on possible employment-related differences between advanced and emerging economies in the region, we examine the expected impact of technological transformation on the number of jobs and the matching of skills and how these may differ between emerging and advanced economies. To this purpose we re-calculate Figure 2.4 separately for the emerging and for the advanced economies and compare the results in Figure 2.5 below.
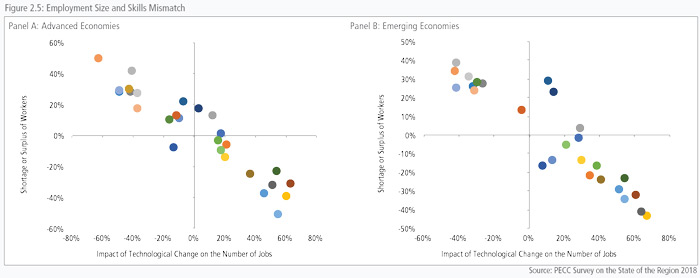
Expectations about growing occupations differ between advanced and emerging economies. For most of the growing occupations, advanced economies have lower expectations for growth in jobs and, also lower expectations for shortages in the necessary skills. For example, jobs growth expectations for science and engineering professionals (and their associates in brackets) are 67% (63%) for emerging and 60% (51%) for advanced economies. At the same time expectations for skill shortages are -43% (-41%) for emerging and -39% (-32%) for advanced economies. This same difference is similarly prominent among slower growing occupations such as teaching professionals with emerging/advanced jobs growth at 38%/15% and skills shortages at -17%/-3% and production and specialized services managers at 34%/21% and -21%/- 5% respectively. Moving to occupations with more modest expectations of growth a similar picture emerges, namely that growth expectations are higher among emerging economies, and so are expectations of shortages.
The comparison shows an ambition on the part of emerging economies in the Asia-Pacific region to catch up with their advanced partners, but also an appreciation that this will bring even more intense skills shortages for these occupations, with all the demands that these will bring to education, training, and related labor market infrastructure and institutions. It may also reflect the current paucity of such skills in emerging economies as well as the out-migration of professionals who have those skills. The degree to which the necessary infrastructure for this transformation is in place will be looked at in the next section.
Before we move to the examination of declining jobs occupations, we must note an exception found in the data. The only high growth occupation where advanced economies have similarly strong expectations for jobs growth as emerging economies (both at around 54%) but stronger expectations for skills shortages (-34% for emerging and -50% for advanced economies) is elderly care, which could be explained by demographic and social differences in that ageing is more advanced in advanced economies and the delivery of aged care is socially and financially different.
Expectations about declining occupations are far more variable than those forgrowing ones. This is probably because the reason, the timing and the intensity of declining can be very occupation and possibly sector specific. There are the severely declining occupations such as clerical support workers and laborers in mining, construction, manufacturing and transport where emerging economies expect to shed jobs much more slowly and to suffer much less from skills surpluses than the advanced economies. For clerical support workers, the net expectation for jobs decline is 43% for respondents from emerging economies and 63% for those from advanced, with the respective skills surpluses being at 35% and 50%. Clearly respondents from advanced economies are expecting a much stronger negative employment impact than the emerging ones, presumably because they also expect that they will be transforming deeper than the emerging economies.
However, this pattern does not extend to many more of the declining occupations. For example, personal services, food preparation, and street sales all show expectations that are very similar between emerging and advanced economies for both jobs and skills mismatch. The lack of clear patterns continues with cleaners and helpers, building and related trades, and business administration all showing a very diverse picture that does not lend itself to a straightforward generalizable explanation.
Our best guess here is that without the use of multivariate regression this part of the data will remain difficult to interpret usefully. The comparison of the declining occupations between advanced and emerging economies suggests that decline will not be an orderly process and that it will be very occupation specific. The implication is that it will be hard to obtain the information needed to assess the negative social aspects of the decline and to interpret it usefully to construct social policy to help will manage this transition.
Having established some aspects of how the Fourth Industrial Revolution may impact on the number and type of jobs and occupations that will be lost and fewer aspects of the new jobs that will be created, we presented the survey respondents with a list of 12 skills that have been cited in World Economic Forum’s Future of Jobs Reports 7 and asked them if they think that such skills will be easy or difficult to find and hire in the region by 2030. This is clearly a highly speculative question and its answer should be considered accordingly.
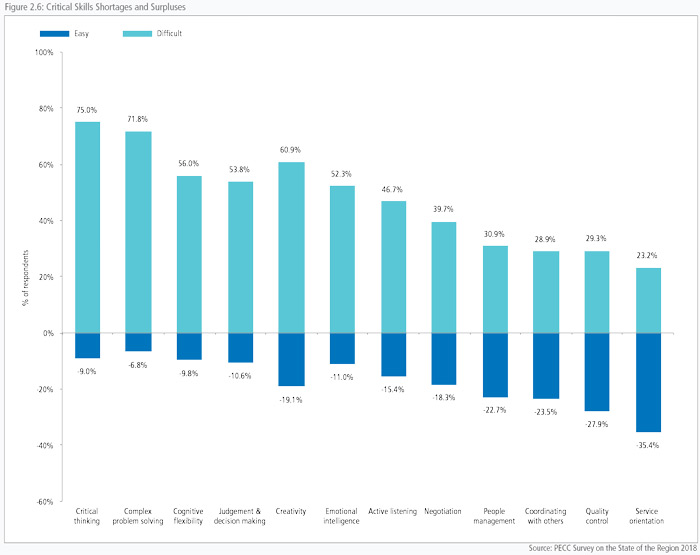
Figure 2.6 stresses the challenges the region faces in adapting to the Fourth Industrial Revolution with respondents highlighting the educational and hiring difficulties they anticipate within their economies. Critical thinking and problem solving, closely followed by cognitive flexibility and judgement and decision making at the shortages end of the spectrum, and the increasing mechanization expected in areas that have to do with customer service, quality control and coordinating and managing people at the surpluses (or perhaps lower shortages) end of the spectrum. Many of these skills are not taught explicitly as part of a skills-set but are facilitated to develop from the earliest education stages, starting according to educational and economic research from the early childhood pre-school stage of education, the value of which often remains underestimated by policy.
WHAT WILL HAPPEN TO THOSE WHO ARE LEFT BEHIND?
This is a very hard question to answer for two main reasons. First, because the extent of automation that will become technically feasible as the Fourth Industrial Revolution comes to its full strength is very hard to predict. Innovation is not happening in a linear fashion in time or in depth, scale, or scope. Second, even if we were able to make some reasonable predictions about the technical possibilities and their subsequent impact on automation, worker displacement, and new jobs creation, we would still need to account for human responses in the form of individual, social and political choices regarding the desirable speed and depth of the change. We would also need to account for the capacity of institutions and infrastructure that are required to support these choices. To top this uncertainty, as many of these parameters differ by economy, trade possibilities would always be a factor to consider about how groups of economies may respond to the making of individual and joint choices. For these reasons we will not venture to make any solid predictions. We will instead put the evidence we presented above in a broader context, using scenarios that have been offered in the literature and highlighting the question of how prepared the region is for the Fourth Industrial Revolution.
The evidence we have presented on jobs and employment outcomes suggests that there will be a lot of displacement in the form of occupations that are automated and many workers who will lose their jobs. At the same time, whatever forecast we can muster in this period of intense uncertainty suggests that the Fourth Industrial Revolution will also bring intense new job creation. There is too much uncertainty surrounding these two processes for us to offer an estimate of the net number of jobs lost minus jobs created in the transformed economies. It is critical to build into our thinking that there will be no guarantee that those who lose their jobs due to automation will also be the same people who will be employed in the newly created jobs. Several scenarios have been put forward, one of the most prominent ones being by McKinsey (2017) who state that the quantitative economy specific charts presented in their analysis “should not be taken as forecasts or predictions” and that they “Rather, they illustrate a range of possible outcomes”.8 In these scenarios they explain convincingly that the range of expected displacement is very broad, depending on how rapid adoption is and what the economy-specific reactions are. They also suggest that the likely outcomes will differ very much between emerging and advanced economies. These are points we have argued in our analysis, especially that economy-specific starting points will be very influential about the way the fourth industrial revolution will impact the different parts of our region.
McKinsey (2017) suggest that measured as a proportion of current work activity hours, automation will have displaced by 2030 in China between 15 and 31 percent of the total work hours, in the US between 23 and 44 percent, with Japan topping the range with displacement between 27 and 50 percent by 2030. In contrast, Mexico’s range is 13 to 26 percent and India’s 10 to 19 percent. To put this in some human perspective, these scenarios are talking about worker displacement of approximately between a quarter and half a billion people by 2030. Given the enormity of such numbers, the last question we will address in this chapter is whether the regional policy community believes that existing education, labor and education institutions and infrastructure are prepared for the Fourth Industrial Revolution and what aspects are those of more, or less concern in each sub-region.
How well developed are the relevant areas of policy in the region? How well-prepared are the institutions and how aware and ready to act are the core stakeholders when the impacts of the Fourth Industrial Revolution require economic, political and social solutions? As the current political turmoil experienced in several regions of the world indicates, core institutions are challenged and some of the benefits deriving from past progress are endangered, including the benefits from freer trade, international cooperation, and globalization. Well-prepared institutions are critical in this context.
The strong expectations that many jobs will be lost, and that new jobs will be created, alongside with the anticipated high levels of mismatch due to new technologies underscore the widely held view that education, labor and social policy will need to play a critical and active role in managing the impending technological transformation safeguarding economic development whilst also protecting the weakest and most vulnerable. Our overall assessment of the region’s preparedness to deal with the training, upskilling and possible disruption coming from new technologies is sobering and should constitute a call for action in policy circles. Social policy, education systems and labor markets are all deemed by stakeholders as starkly unprepared for dealing with the disruptions that are likely to come. Responses between advanced and emerging economies differed only minimally.
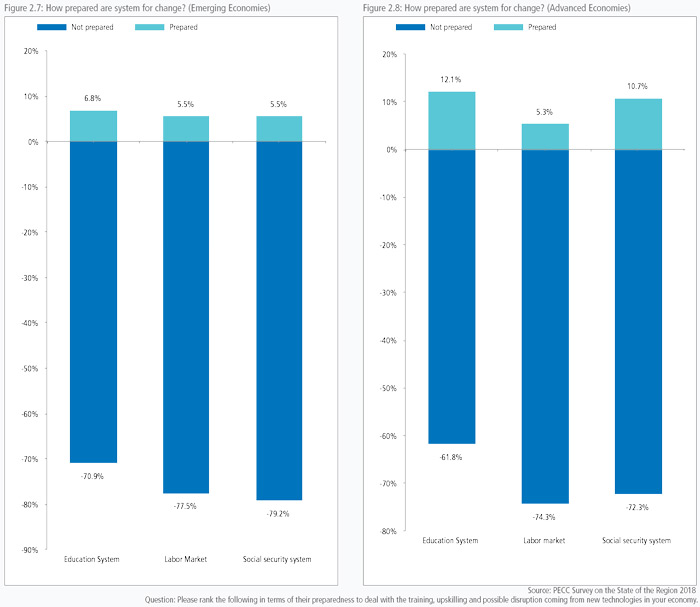
The survey asked further detail on specific aspects of education, labor and social policy in the respective economies, shown in Tables 2.6 and 2.7 below. As Figures 2.7 and 2.8 above have already forewarned us, there were very low levels of satisfaction across the region on the match between educational training and the needs of the economy as well as on the levels of cooperation between education providers and employers. These are issues that are hotly debated (see Box 3: Perspective on the Role of the Education System by Gary Hawke).
BOX 3 - PERSPECTIVE ON THE ROLE OF THE EDUCATION SYSTEM
Contributed by Professor Gary Hawke, Member, NZPECC, former Head of the School of Government and Professor of Economic History, Victoria University of Wellington, Fellow of the Royal Society of New Zealand
Like other PECC economies, New Zealand faces the challenge to its education system posed by the changing needs of employers. The focus is often tertiary education but more attention should be paid to what is done in schools.
Employer complaints should not be taken at face value. Masters complained about apprentices in the Middle Ages (and probably had more reason when apprentices were lodged in the family homes of their employers). Each education level has an incentive to complain about the outcome from earlier stages - secondary schools about primary, universities about secondary schools. Skepticism is again the appropriate response.
Teaching is a skilled art. It is a mistake to see learning as like pouring knowledge into empty vessels. It is equally a mistake to think that undirected student activity is usually an effective vehicle for learning. The skill of teaching falls between these extremes - it is a mixture of directing and facilitating.
What is its objective? Employers when looking beyond the immediate need of their businesses generally produce demands like that generated by the PECC survey: i.e. they seek initiatives that help to build labor force skills in the following areas:
- Critical thinking
- Complex problem solving
- Creativity
- Cognitive flexibility
- Judgement & decision making
These are essentially the same as the OECD was reporting in the 1980s. They are “soft skills” rather than direct subject knowledge, or ability to complete immediate tasks such as hammer nails in, run a spreadsheet, or operate a complex piece of engineering equipment.
The New Zealand curriculum responded by defining core competencies:
- Thinking
- Relating to others
- Using language, symbols, and texts
- Managing self
- Participating and contributing
There is no gap between business demands and the aims of the education system.
There can be questions about achievements. The essence of schooling is to engender the core competencies using what has been learned over centuries. Disciplines have been developed and found useful as vehicles for learning. Some are longstanding such as Literary Studies, History, or Mathematics. Others have been developed more recently such as Design, and the traditional subjects themselves change dramatically over the years. The subjects can become sources of great enjoyment although they do not always do so. But the distinctions among them, while still useful for cataloguing library books and for creating school timetables – both activities of diminishing value are not crucial for the purpose of education. The aim is learning through subjects rather than learning about subjects. The key competencies of the curriculum are not how teaching should be organized; even what are often seen as the fundamental building blocks of learning, literacy and numeracy, are not best developed by explicit courses on literacy and numeracy.
We ask teachers to report on student achievement in subjects. We also ask teachers to provide judgements about the capability of students in relation to the key competencies. The big challenge to the New Zealand school system is developing teacher abilities in respect of the latter; that is what employers want.
Much of this applies also to tertiary education. Managing the transition from the education system to employment is not a matter of learning specific skills. It is mostly a matter of developing knowledge and aptitudes as defined in the core competencies. One of our problems is that many teachers have little knowledge of any employment other than their own and it is not easy for many parents to provide it. That is a challenge for business - make employment comprehensible and attractive.
Even more the challenge is for employers to build on foundational education. The requirements of the future workforce are probably not even known now. Lifetime education is crucial. Every employing entity should be a learning environment. The tertiary sector would then be in a position to provide the new knowledge and aptitudes which business requires.
Complaints from the sidelines about relevance are useless.
When asked how satisfied they are with specific labor and education issues in their economy (on a scale of: Not at all, Slightly; Moderately, Very; Extremely) stakeholders responded with very low levels of satisfaction: the majority of their answers were in the two lowest satisfaction categories and only rarely did the two highest satisfaction categories put together reach the 10 percent mark. Tables 2.6 and 2.7 present this rather alarming evidence in some detail.
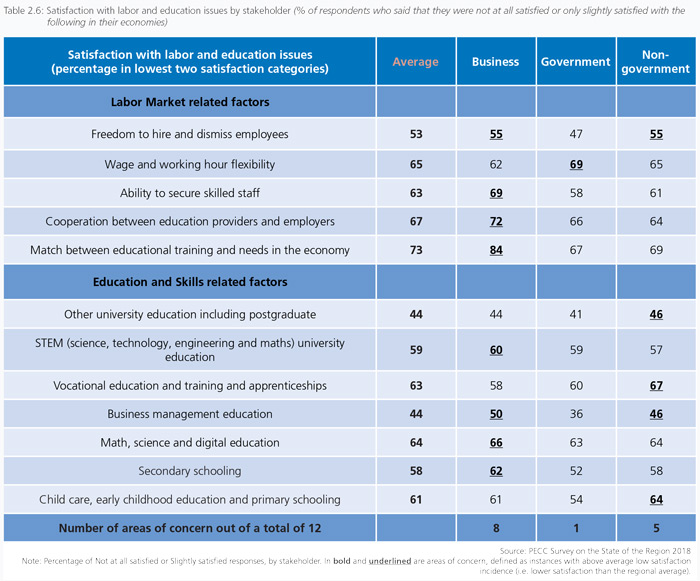
Table 2.6 focuses on low satisfaction responses as indicators of areas of concern and shows the proportion of responses where the answer was either Not at all satisfied or Slightly satisfied, for the three categories of stakeholders, Business, Government and Nongovernment. The proportion of stakeholders who express concern is alarmingly high. The lowest concern level is about university education (with “only” 44 percent respondents expressing concern) and the highest is about the low match between educational training and the needs in the economy (with 73 percent of respondents expressing concern). The concern about “skills for growth” come through in several ways.
Concerns regarding skills and the labor market are expressed by high dissatisfaction about the ability to secure skilled staff (at 63 percent) and about the cooperation between education providers and employers (at 67 percent). These concerns are corroborated by the high level of concern about Maths, science and digital education as part of school education (at 64 percent compared with 58 percent for secondary and 61 percent for primary schooling) and STEM in the universities (at 59 percent, compared with 44 percent for business management education and 44 percent for other university education). As if these concerns were not enough by themselves, it is troubling to see that they are much more strongly expressed by businesses (in 8 out of 12 areas their concern was above average) with government respondents expressing an area as above average concern only once (about wage and working hours flexibility). Non-government stakeholders score a 5 out of 12. These differences suggest that information is not flowing optimally and that channels of communication and information as well as research in these areas should be considerably strengthened. The “common sense” question is, if satisfaction is low at this (early) stage of the Fourth Industrial Revolution’s rollout, how can we expect that our policy responses will be adequate when the change intensifies and becomes faster?
Table 2.7 below examines the geographic dimension of the dissatisfaction about labor and education issues. For reasons that need further investigation, respondents from Pacific South America express concern with all issues they are asked. With the exception of university education (other than STEM) where they are dissatisfied the least, in all other areas their expression of concern is very wide. Especially striking is their concern about Math, science and digital education at school (at 85 percent), STEM at university level (at 73 percent) and problematic match between educational training and the needs of the economy (at 80 percent). The next geographic area to show wide levels of concern is North America with 8 out of 12 areas above average, followed by Southeast Asia scoring 5 out of 12 and Northeast Asia and Oceania scoring 3 each out of 12. Notably Northeast Asia expresses the widest dissatisfaction about wage and working hours flexibility and early and primary school education, while Oceania reports low satisfaction about the cooperation between education providers and employers and the lowest dissatisfaction with labor market flexibility, in both hiring/ dismissal and wages/working hours flexibility.
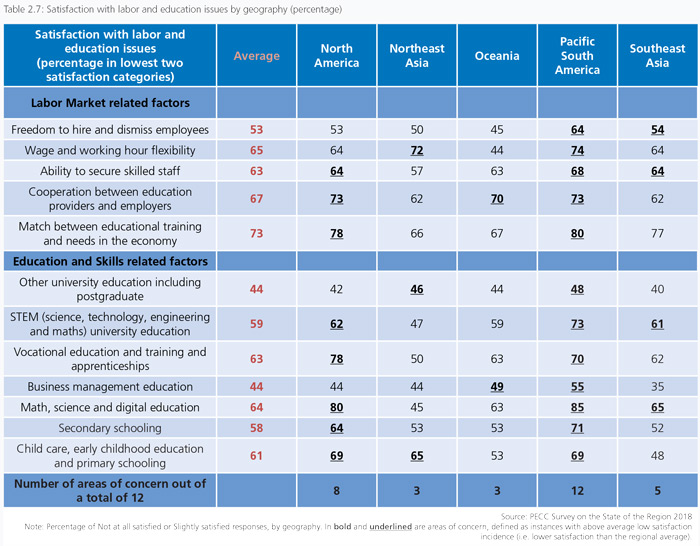
The overall picture we see from Figures 2.7 and 2.8 and Tables 2.6 and 2.7 is a widespread perception of unpreparedness and low levels of satisfaction with the way education and labor markets are handled. The high levels of dissatisfaction in North America may be the result of the Fourth Industrial Revolution having already made different progress in that part of the region (e.g. with much shifting from manufacturing to services, or with capital and technology outflows due to industrial unbundling) than in Southeast and Northeast Asia where both manufacturing and services have progressed more strongly, but from a lower starting point. It is also important to note that, with the exception of Northeast Asia, which is clearly dominating the statistics of its geographic area, math and science education are of major concern everywhere else in the Asia Pacific region.
BOX 4
THE FUTURE WORK FORCE
Interview with Scott Price, Chief Transformation Officer, UPS
How do you see technology transforming your company’s business model?
Most industries are being disrupted by technology. This creates the opportunity to develop new business models to better serve existing needs. UPS is no exception. We are using technology to enhance our performance and develop new solutions for our customers, giving them the flexibility and capabilities, they need in this age of technological advancement. In the process, we are transforming ourselves into a technology company capable of supporting the most complex supply chains and enabling the ever-changing global trade. In fact, this is not the first time we have leveraged technologies to transform ourselves and to serve our customers better. Over the course of our 111-year history, UPS has been successfully integrating advancing technologies in our operations.
The industrial revolution of our time is being driven by information technologies. At UPS, we are using a wide range of information technologies to develop our smart global logistics network. These include: data analytics, artificial intelligence (AI), machine learning, blockchain and others. UPS’s smart global logistics network refers to our digitally and physically connected facilities, fleet and information systems. Information technologies help us synchronize our physical assets and activities across the world, allowing us to become more efficient and sustainable and provide better services to our customers. Here are some notable examples of the information technologies that we use:
- Network Planning tools (NPT) for network optimization: NPT maximizes efficiency in our transportation routes and facilities, even when volumes spike and destinations change. By applying advanced analytics, artificial intelligence, and operations research, these tools optimize the flow of up to 60 million packages in our U.S. network each day. NPT is in development and will have a rolling release until it is fully deployed in 2020.
- Enhanced Dynamic Global Execution (EDGE) for facility optimization: EDGE uses real-time data to enhance real-time decision-making inside our facilities. These proprietary programs tell us where and how packages should be sorted and can locate operational assets instantly. EDGE is comprised of more than 20 separate projects that are being developed and tested now, with full deployment planned in phases through 2020.
- On-Road Integrated Optimization and Navigation (ORION) for route optimization: Our groundbreaking route optimization software determines the most efficient delivery route each day. Deployed across the U.S. and being piloted in Canada, Germany, and the U.K., ORION is essential to reducing our carbon footprint by minimizing UPS’s total miles driven.
- Delivery Information Acquisition Device (DIAD) for delivery optimization: Drivers use this handheld tool when delivering packages. Our next generation DIAD will integrate artificial intelligence and other technology enhancements to enable drivers to make better decisions that help us meet our customers’ unique needs and preferences.
What are the key workforce challenges from your perspective? How do they differ from market to market?
It is critical to develop a workforce with skills that meet current needs, while also hiring and maintaining talent that can learn skills for success in the future. The rapid pace of technological change means that training and upskilling programs are necessary for employees. We are planning ahead of the demand, but identifying the right skills is also a challenge. For example, the World Economic Forum predicts that by 2020 more than a third of desired skill sets of most occupations will be comprised of skills that are not yet crucial to the job today.
Furthermore, there is a need to pursue concerted efforts from various stakeholders to close the skills gap in labor. There must be an adaptable workforce that embraces technology changes and is willing to acquire new skills. There are significant incentives for partnerships between businesses, governments and education providers to design and implement a 21st century curriculum. As an example, in 2017, UPS collaborated with Georgetown University for a Master’s class on new urban technologies, which encourages students to apply real data to urban environment policy issues.
The skills gap exists across markets. Studies by McKinsey find that almost 40 percent of American employers say they cannot find people with the skills they need, and in China the demand for skilled labor is likely to outnumber the supply by 24 million people by 2020. At the same time, different markets face disparate problems. For example, ageing populations, in economies such as Japan and Korea, have shrinking youth cohorts, which may necessitate wholesale reskilling among older workers.
What are you doing to adjust to the skills requirements coming from technological change? Do you provide training or work with educational institutions?
We believe professional development is a shared responsibility, so UPS invests about $565 million annually on training programs to help employees further their careers within the company. In the U.S., we recently pledged to provide enhanced workforce opportunities to more than 50,000 employees through higher education, apprenticeships, up-skilling and retraining. Our aim is to help our employees prepare for rewarding positions that meet their short-term goals and further their development for life-long careers.
We offer both internal trainings, as well as programs with educational institutions. These are available for employees ranging from entry-level to mid-career, including management employees. For example:
- We partner with local governments and community colleges to offer “Earn & Learn” programs to UPS employees in the U.S. This allows employees to work part-time while attending school. In addition to regular employee benefits, participants receive tuition deferment and book reimbursement, as well as opportunities to become full-time employees upon graduation. In fact, most UPSers start their careers at UPS as part–time employees.
- UPS’s Intergrad is a technologically advanced training center for drivers, helping them better use technologies to enhance their performance and safety. In the training centers, the learning experience is enhanced through advanced technologies such as 3-D simulation and virtual reality (VR), in addition to the traditional classroom instruction and hands-on training. This state-of-the-art training center was developed through a private-public partnership between UPS and the Department of Labor. We now have 11 facilities in the U.S. and Europe.
- UPS offers recurrent training annually in order to help our workers keep up with new vehicles and technology. This includes targeted training for technicians when new hybrid or electric vehicles arrive at their facilities. We also provide training for a wide range of services and equipment due to the increasing diversity of UPS’s vehicle fleet, which requires technicians to be proficient on all types of scan and diagnostics equipment. New technicians also receive training on the emerging technology of telematics and conditionbased maintenance, the latter of which offers proactive notification of impending vehicle component failure.
What role do you see for regional cooperation in addressing these challenges?
As mentioned, markets in the region share similar workforce challenges. We can address these issues through partnerships with various stakeholders, including employers, employees, labor, educators and governments. Stakeholders in many markets have joined together to solve these challenges and find ways to help business and labor better prepare for the future of work. For example, the U.S. recently expanded an apprenticeship program, in which UPS is one of the business participants. Other APEC members, such as Singapore, Korea and Japan among others, have also established national policy councils to look into the issues of job creation and the future of jobs. Therefore, it would be useful for governments and other stakeholders in the region to learn from each other’s experiences. As a platform for testing new policy ideas and capacity-building, APEC is an ideal place for all our stakeholders to discuss and find solutions for the future of work.
CONCLUSION
This chapter has examined the future of work in the Asia-Pacific region in the face of the Fourth Industrial Revolution. This is a vast topic and we have just begun to scratch the surface of only few of its most important aspects. The introductory section builds the context and sets the scene. The examination of “Artificial Intelligence for Everyone” in Box 1 deals with the new aspects of the change that the Fourth Industrial Revolution is bringing in terms of ambition and benefits and in terms of potential economic, social and institutional risks that will have to be managed. It highlights the role of diversity within the Asia-Pacific region and explains the need of social and economic preparedness.
As demonstrated by the results of PECC’s survey of the regional policy community, there is a clear expectation that automation will lead to sizeable workforce decreases in some sectors but that there are also likely to be increases in other sectors that will be the incubators of new technologies and growth, the view being that there will be modest overall decreases in the size of the workforces by 2030 and that these would be unevenly spread within the region.
We then focused on occupations as the most relevant categorization of work, in order to identify and possibly measure the worker displacement and jobs creation impact of the Fourth Industrial Revolution. Science and engineering, ICT, health and care related are expected to be the big winners at both higher education and vocational education levels. Job creation is expected at its strongest in North America and in SE Asia. There are strong differences by sub-region in the expectations for job displacement by occupation, we presume due to the different stage of the economies concerned.
The finding that skill shortages and skill surpluses are expected to coexist is a critical aspect of the expectations regarding the impact of the Fourth Industrial Revolution on workforces. There is no reason why we should be assuming that displaced workers would be readily employable to any of the newly created technologically advanced jobs. Mismatch will play a large role in the labor markets of the future and we already see substantial differences by geography and by occupation.
Box 2: The APEC App Challenge: Skills for a New Generation offered at this stage an example of the many practical aspects of building skills and training in the context of an emerging economy and the social and economic transformation that is facilitated by the Fourth Industrial Revolution.
The analysis of mismatch continued with a focus on the differences in mismatch between emerging and advanced economies and how the patterns of skill shortages were qualitatively rather similar (presumably because, at least in part, they are motivated by the same type technologies) but the patterns of skill surpluses were not (presumably because of the very different social and economic institutions that are designed to support displacement and retraining). We found that the more mechanical skills were predicted to be the least likely to be in shortage in the future, whilst critical thinking, complex problem solving, judgement & decision making, cognitive flexibility and creativity were predicted to be in future shortage.
Having established the degree to which we expect to see displacement and job creation and, also some of its occupational and geographic aspects we turned to the question of how prepared the region is in terms of its education, labor and social institutions and infrastructure. Even the most conservative estimates paint a very alarming picture about the extent of a global problem displacement with all its labor market mismatch, education upskilling and re-training and social care for those who are left behind without much hope of joining in. The responses from the PECC Survey on the state of the Region 2018 were sobering and the concerns they identified will require more attention and research. A very small percentage of stakeholders reported that they believe their economies to be ready and the more detailed questions revealed diverse and intense concerns about many highly important aspects of education, labor markets and social support.
APEC has already begun to lay the groundwork for addressing these issues. In 2017 at their meeting in Danang, regional leaders endorsed the APEC Framework on Human Resources Development in the Digital Age. The Framework sets policy directions and measures to support economies to prepare workers for present and future challenges. It calls for APEC to be to be used as a platform for policy dialogue and cooperation on these issues. It seeks to complement existing initiatives, including the APEC Education Strategy and contribute to global efforts including the ILO’s “future of work centenary initiative” and the United Nations’ Sustainable Development Goals, particularly Goal 4 to ensure inclusive and equitable quality education for all and promote lifelong learning and Goal 8 to create new dynamism for growth, achieve sustainable, innovative, and inclusive growth, employment and decent work for all.
This chapter is not ending in an unequivocally optimistic note. We anticipate unprecedented change, perhaps not so much in the net numbers of jobs growth, but in the very large numbers of workers that will need to find their way out of displacement and into a different labor market, which requires very different skills and where many things are done very differently. As identified in the interview with UPS’ Chief Transformation Officer, Scott Price, businesses are undertaking efforts to prepare workers for the change but these need to be scaled up. This will not be an era for people who are afraid of or dislike change. It will be an era that will unleash massive opportunities for those who embrace change. It will also be an era which will challenge our social and ethical foundations, as we try to establish new ways to ameliorate the outcomes from skills and occupational mismatch throughout the globe. Above all, this chapter is sending the message that, ready or not, the Fourth Industrial Revolution is coming to the Asia-Pacific region and the region is declaring itself woefully unprepared. The urgent need for educational and labor market reforms is clearly stated, as is the need for closer collaboration between business, government and academia. Closer cooperation by stakeholders will be required and APEC is already laying the foundations for this. A new Fourth Industrial Revolution Taskforce should be formed by APEC to produce research, advice and guidance for all stakeholders.
REFERENCES
David H. Autor, Frank Levy and Richard J. Murnane, 2003, The Skill Content of Recent Technological Change: An Empirical Exploration Source, The Quarterly Journal of Economics, Vol. 118, No. 4 (Nov. 2003), pp. 1279-1333
David Autor, David Dorn, Lawrence F. Katz, Christina Patterson, and John Van Reenen, 2017, Concentrating on the Fall of the Labor Share, American Economic Review: Papers & Proceedings 2017, 107(5): 180–185
David H. Autor and David Dorn The Growth of Low-Skill Service Jobs and the Polarization of the US Labor Market, The American Economic Review, Vol. 103, No. 5 (August 2013), pp. 1553-1597
David H. Autor, David Dorn and Gordon H. Hanson, 2013, The Geography of Trade and Technology Shocks in the United States, The American Economic Review, Vol. 103, No. 3, Papers and Proceedings of the One Hundred Twenty-Fifth Annual Meeting of the American Economic Association (May 2013), pp. 220-225 Published by: American Economic Association Stable URL: http://www.jstor.org/ stable/23469733 Accessed: 24-04-2018 07:17 UTC
Spyros Makridakis, 2017 The forthcoming Artificial Intelligence (AI) Revolution: It’s impact on Society and Firms; Futures 90 (2017), 46–60
Bakhshi, H., Downing, J., Osborne, M. and Schneider, P., The Future of Skills: Employment in 2030. London: Pearson and Nesta, 2017.
The Future of Jobs Employment, Skills and Workforce Strategy for the Fourth Industrial Revolution, World Economic Forum; January 2016
Building Australia’s future-ready workforce, Microsoft, 2018
Delivering the Workforce for the Future, Mercer, Oliver Wyman, 2017
Jobs Lost, Jobs Gained: Workforce Transitions in a Time of Automation, McKinsey Global Institute, 2017
Erica Groshen, Susan Helper, John Paul MacDuffie, and Charles Carson “Preparing U.S. Workers and Employers for an Autonomous Vehicle Future”https:// avworkforce.secureenergy.org/wp-content/uploads/2018/06/Groshen-et-al- Report-June-2018-1.pdf, 2018
Bakhshi, H., Downing, J., Osborne, M. and Schneider, P., The Future of Skills: Employment in 2030. London: Pearson and Nesta, 2017.
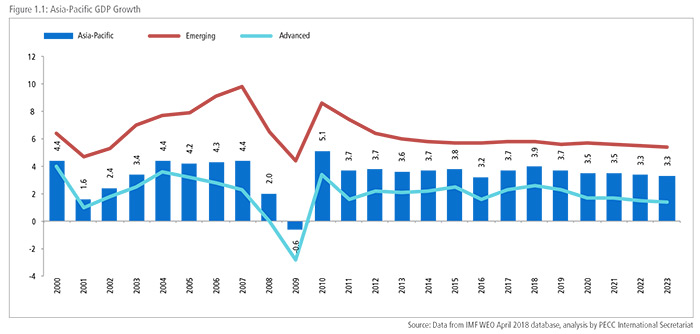
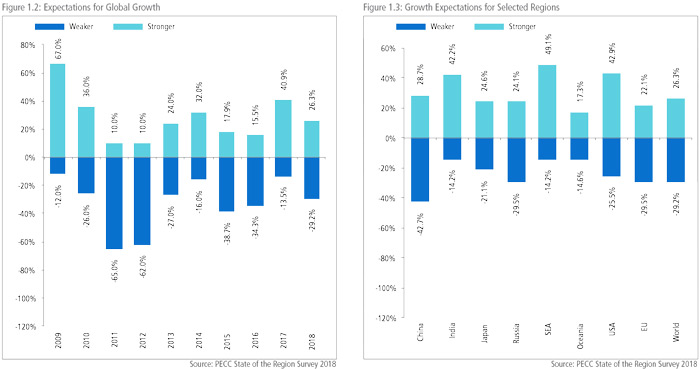
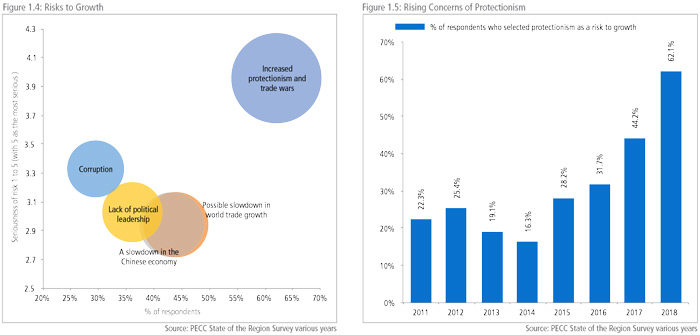
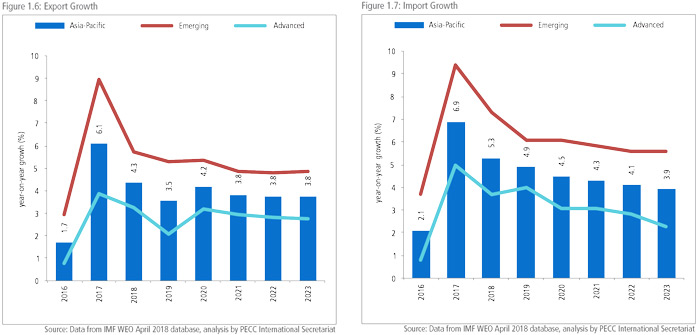
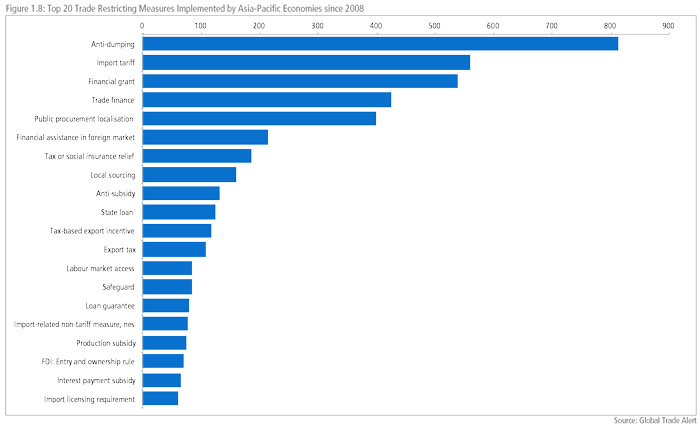
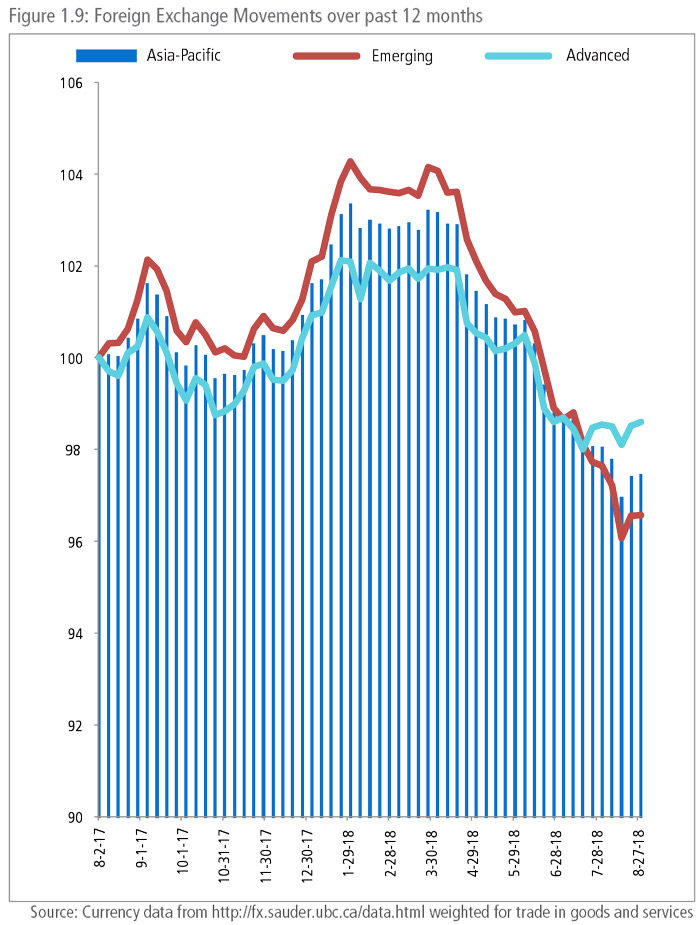 Since August 2017, regional currencies have lost, on average, around 2.6 percent of value against the US dollar. However, emerging market currencies have depreciated considerably more than advanced economies. On average, Asia- Pacific emerging economies currencies have lost 3.4 percent of value against the US$ compared to 1.4 percent for advanced economies (see Figure 1.9). The flipside of this is the strengthening of the US dollar, reflecting rising US interest rates, and its impact on its export competitiveness. Given the current environment this trend may further exacerbate trade tensions.
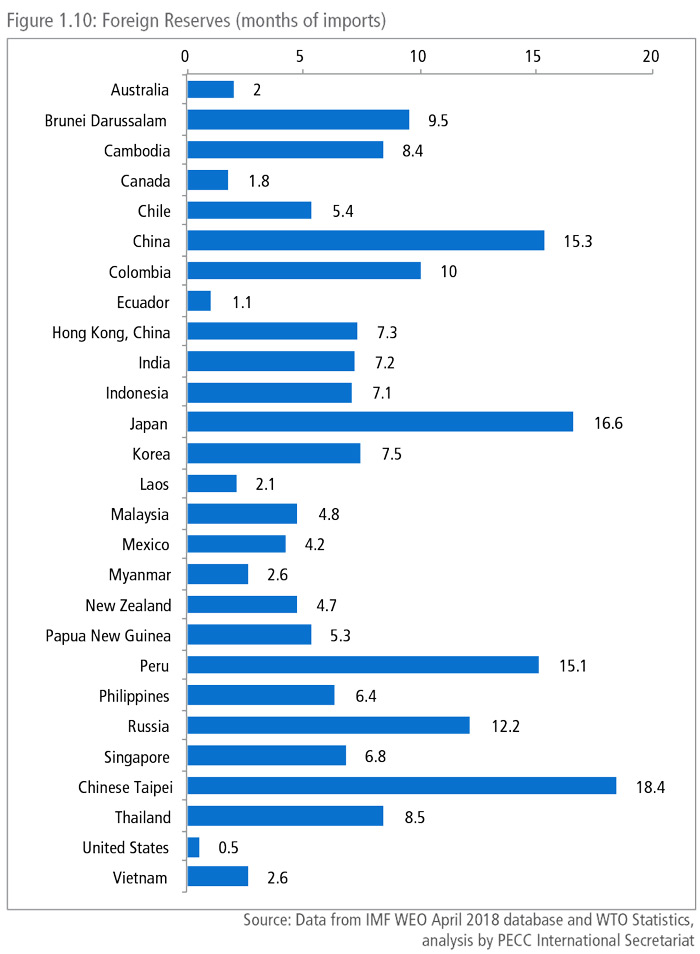 The weakening of regional currencies against the US dollar has precipitated actions by central banks. For example, on 24 August the People’s Bank of China announced that it was introducing a “counter-cyclical factor” to mitigate pro-cyclical market behavior and stabilize market expectations.
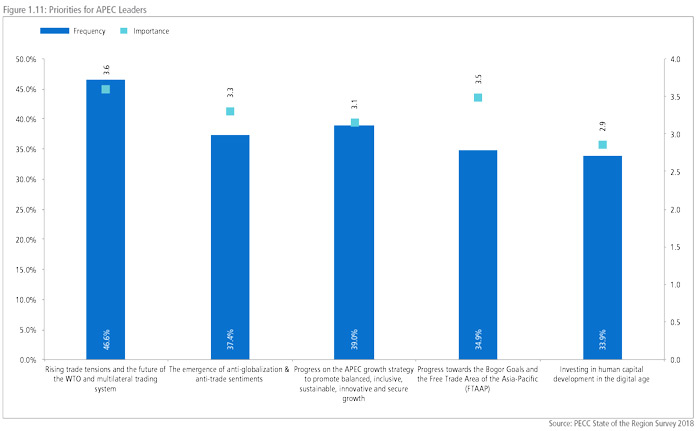
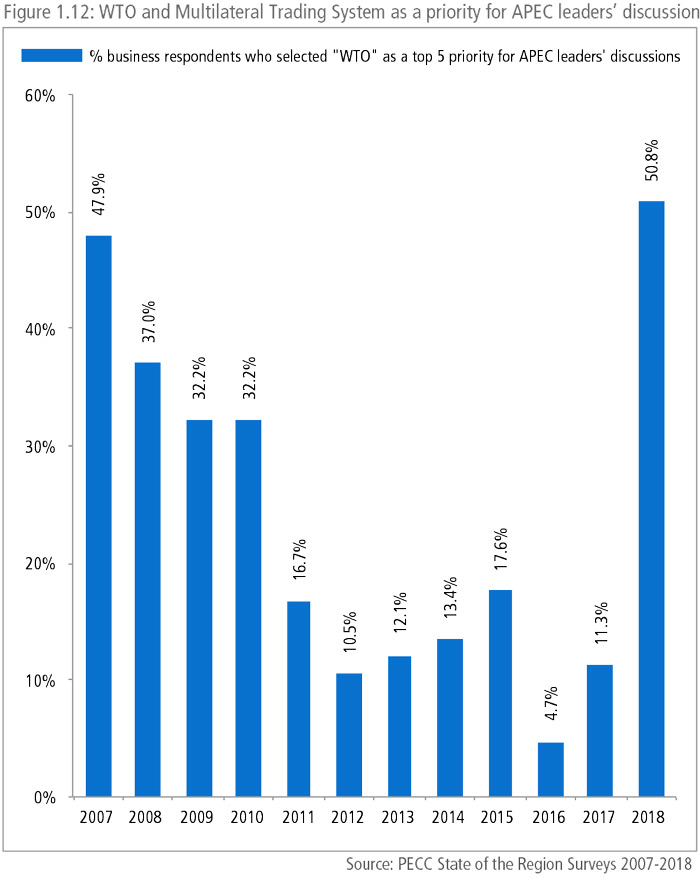 Figure 1.12 shows the percentage of business respondents who selected a WTO issue as a priority for APEC leaders’ discussions since 2007.10 When PECC began its survey of regional stakeholders in 2007, 48 percent selected “The WTO Doha Development Round” as a top 5 priority for Leaders, but over time, any option that mentioned the WTO declined in importance. In last year’s survey, only 11 percent thought that “Building political support on key issues for the WTO Ministerial” should be a priority. As the survey results demonstrate, over time the Asia-Pacific policy community had become much more focused on regional trade deals and the growth strategy. However, recent events have clearly had an impact on views. Moreover, it is more than likely that stakeholders, at least those surveyed by PECC, equated the value of the WTO with its negotiating function and took for granted the existence of the rules, disciplines, and dispute resolution mechanisms associated with the institution.
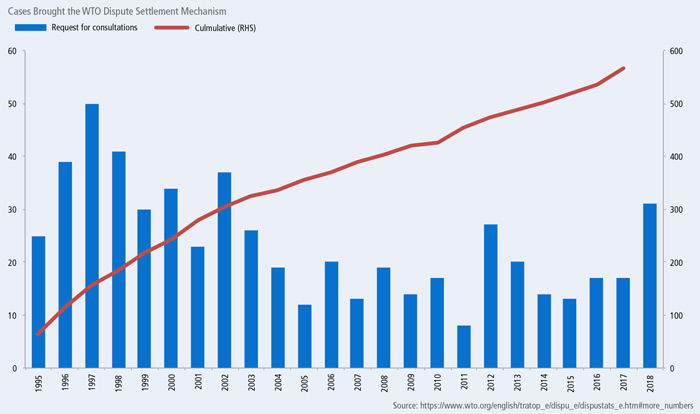
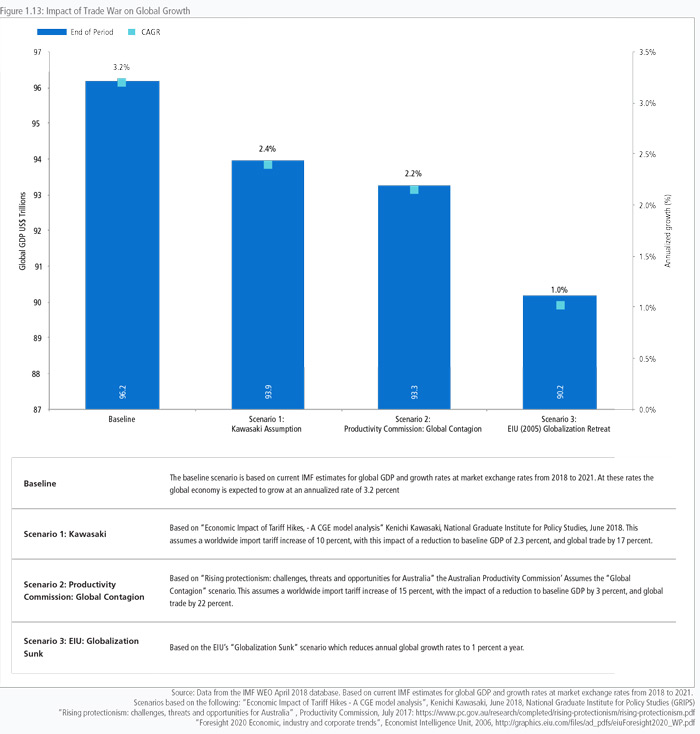
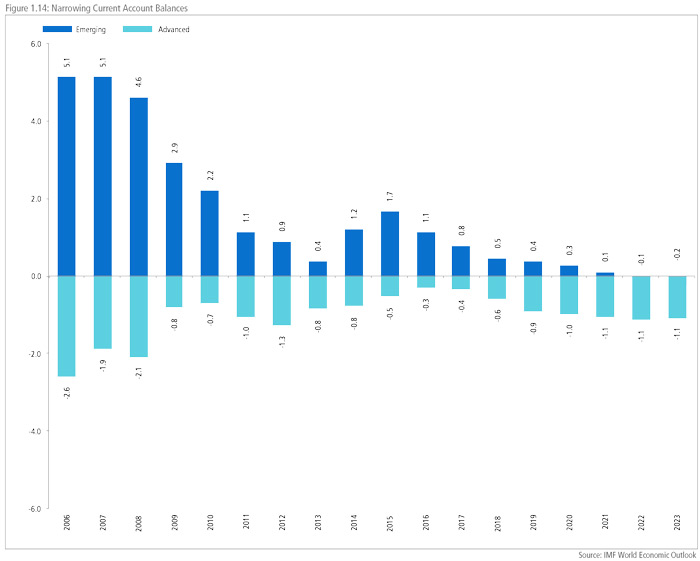
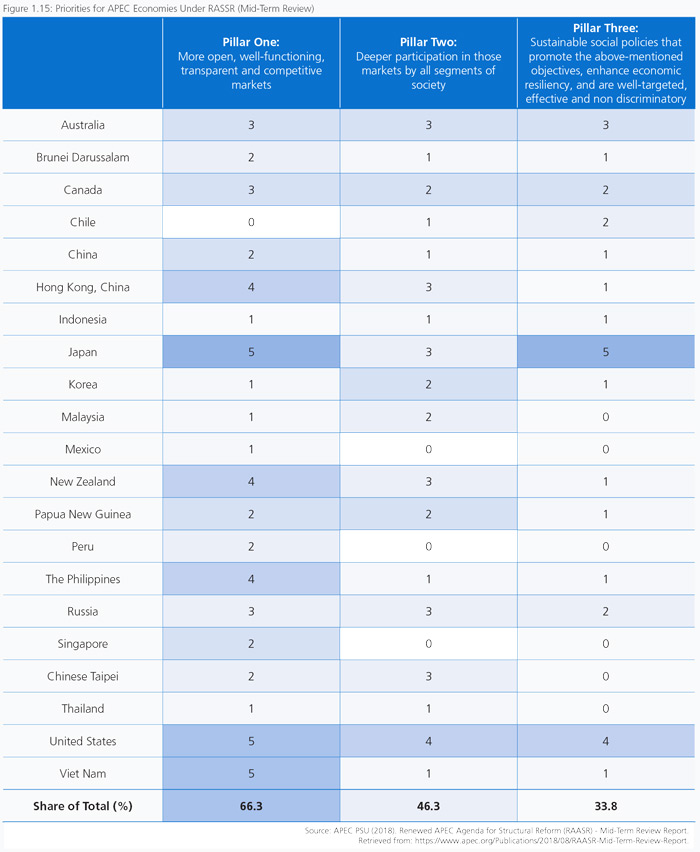
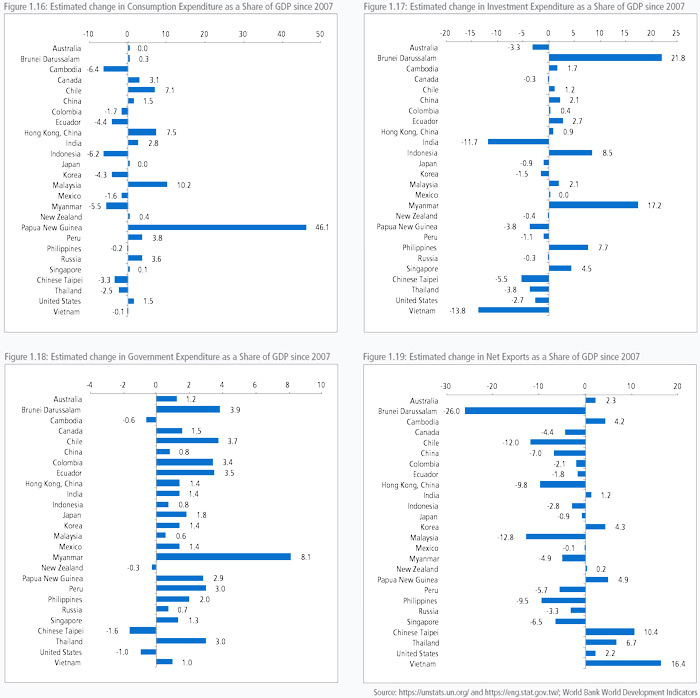
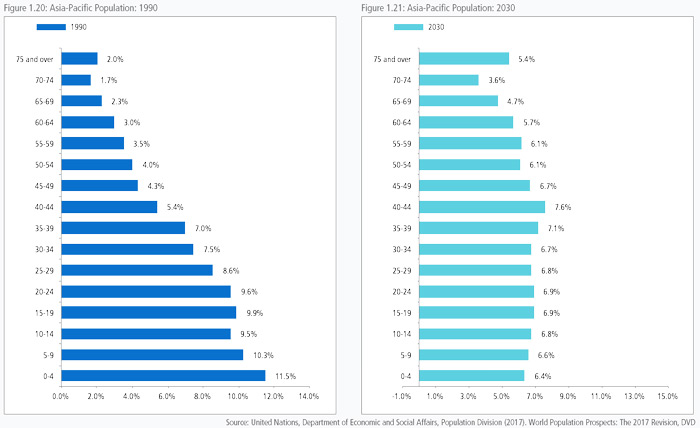
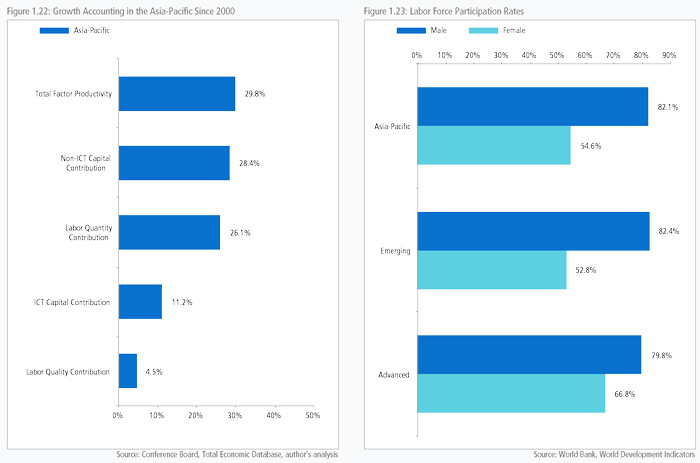
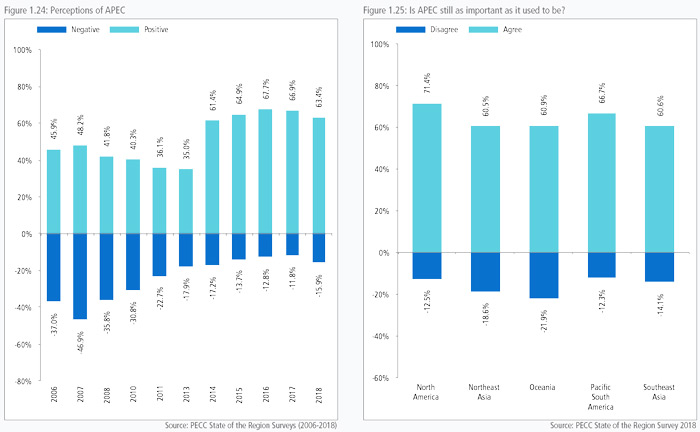
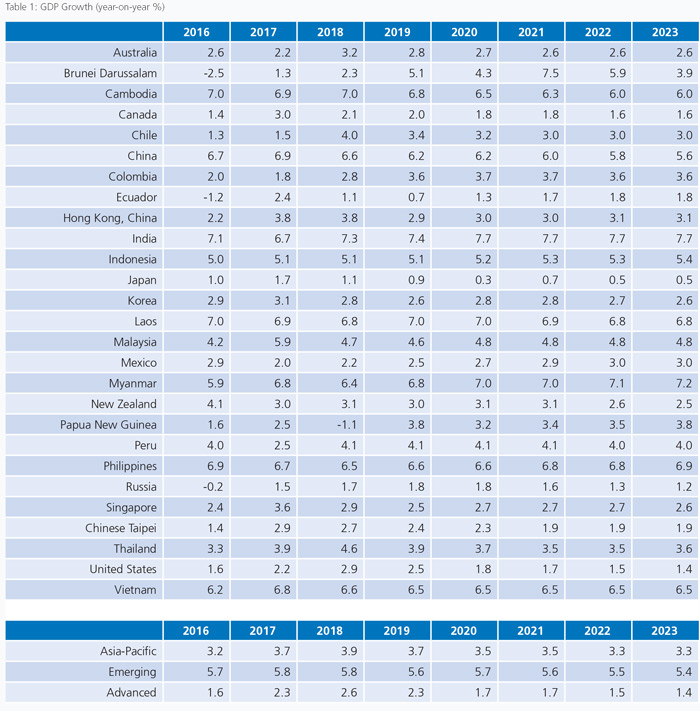
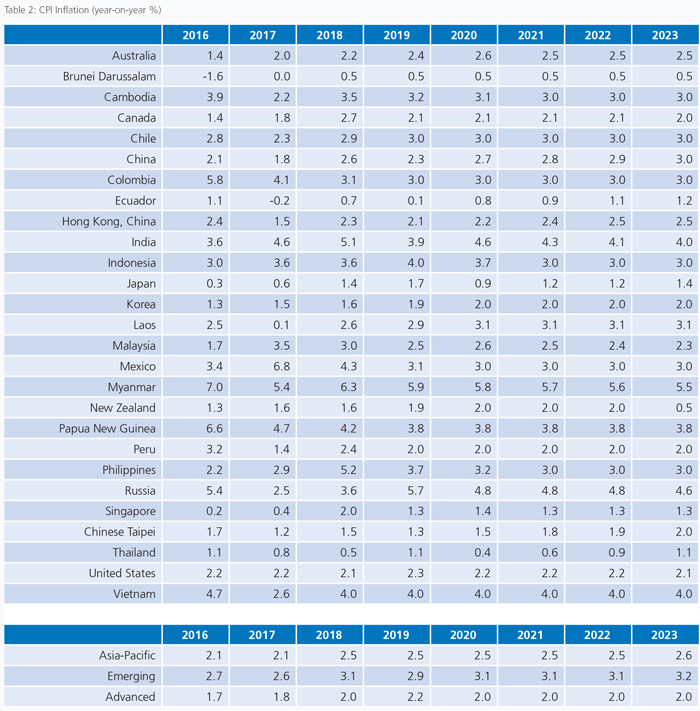
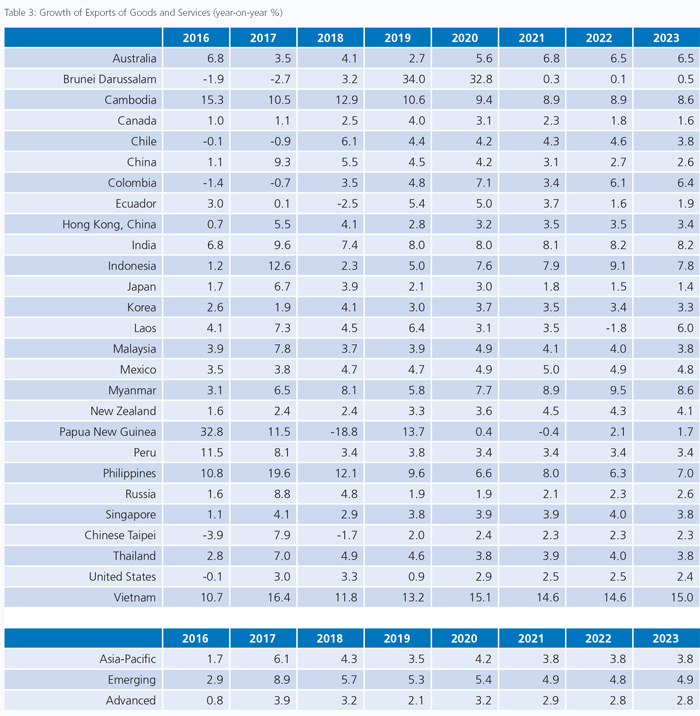
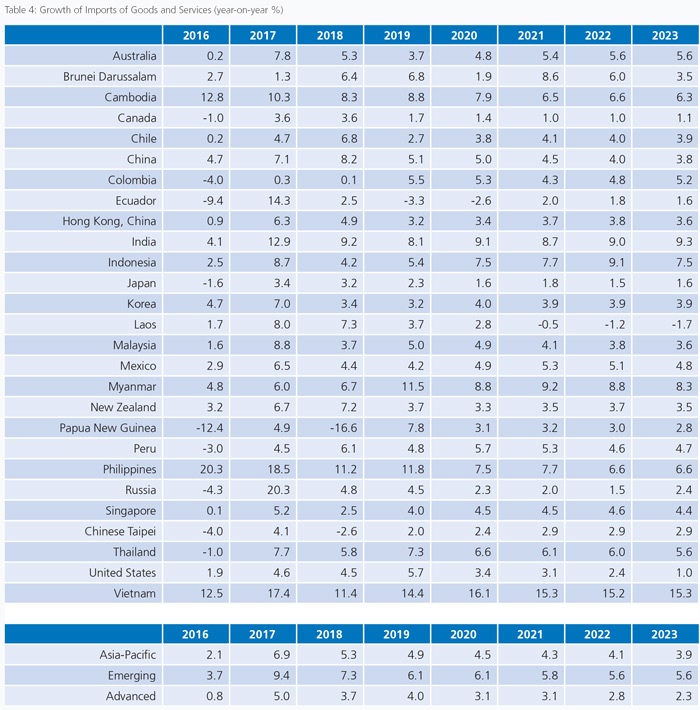
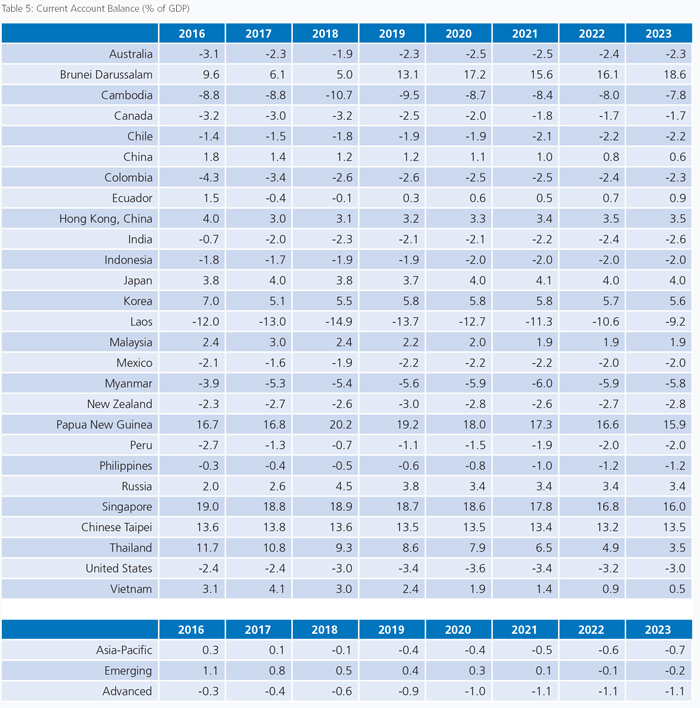
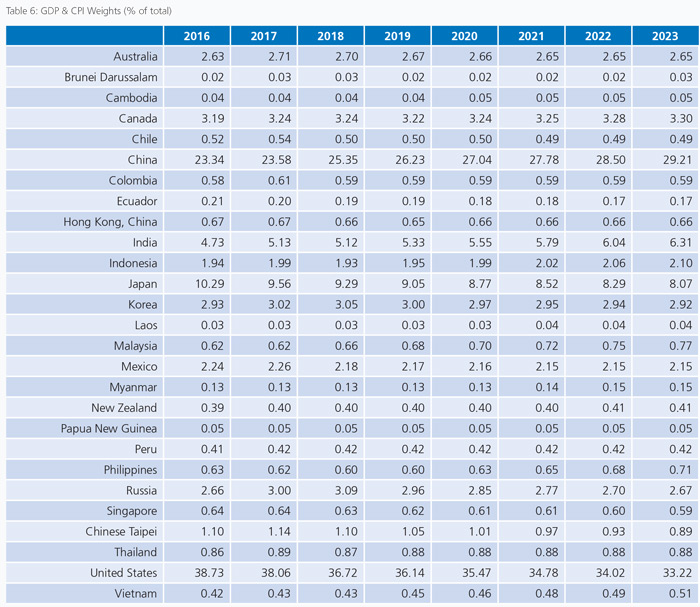
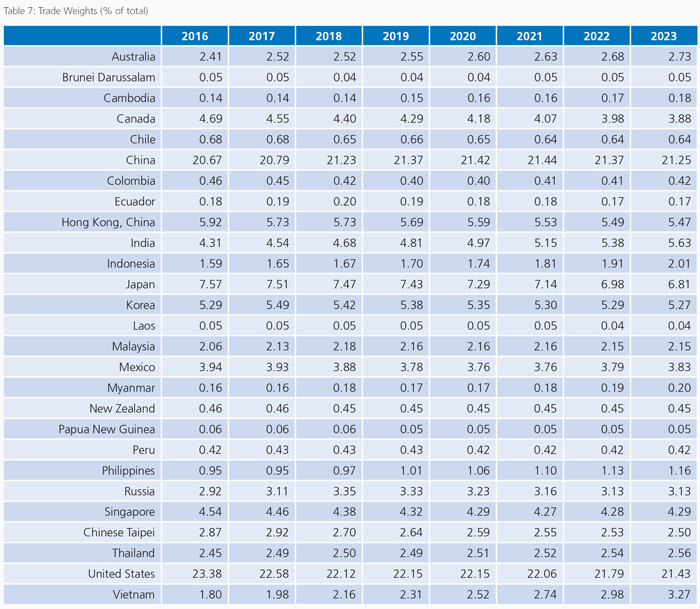


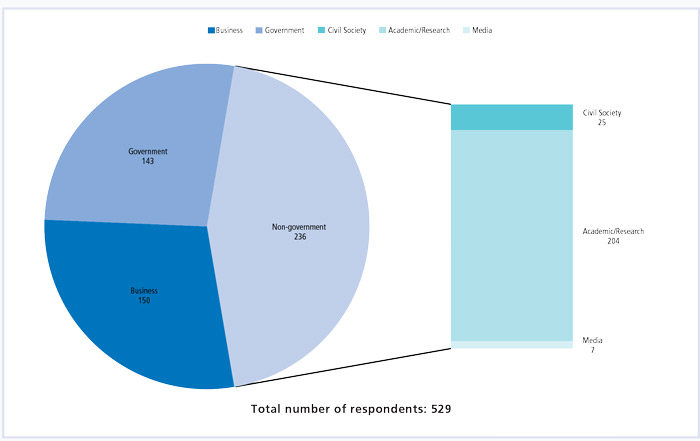
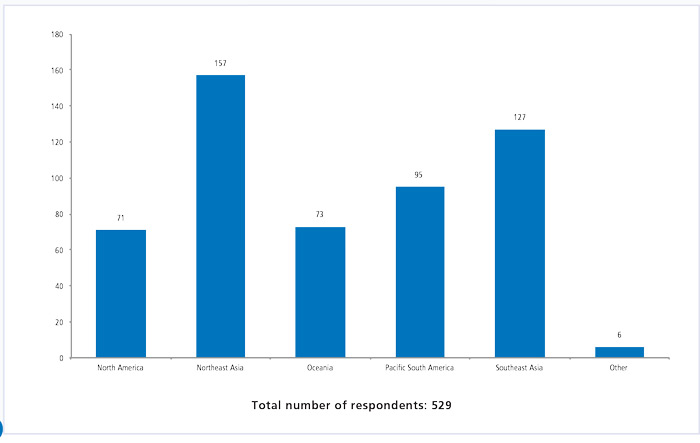
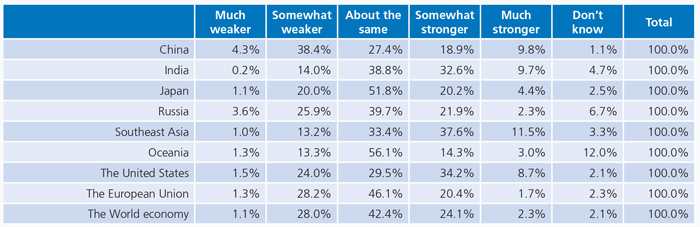
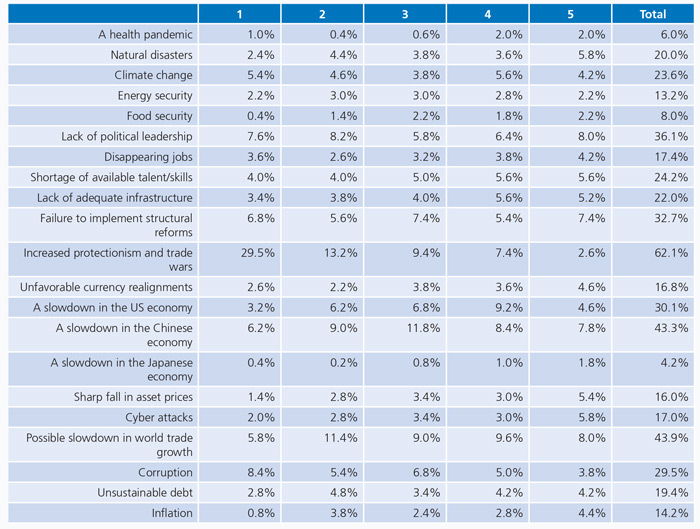
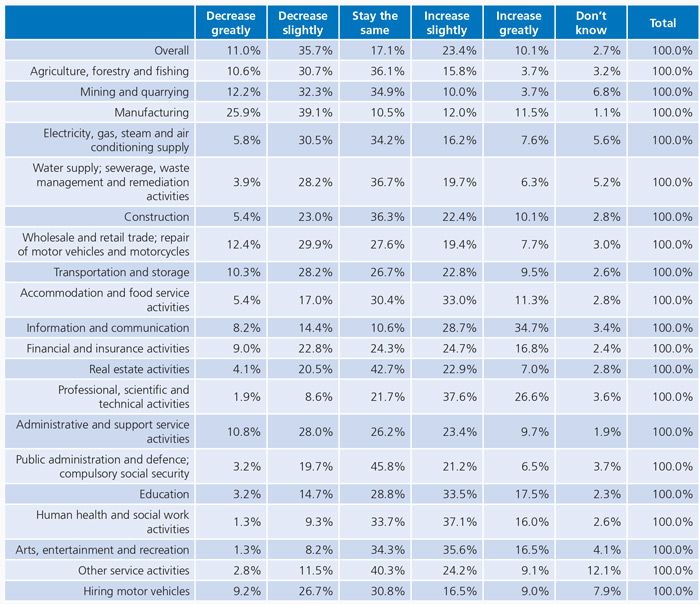
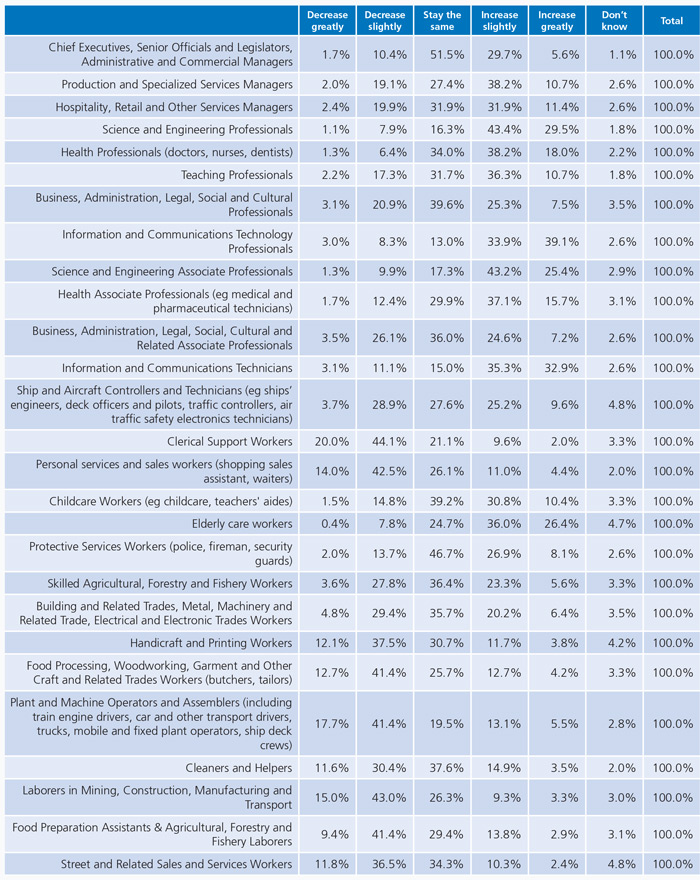
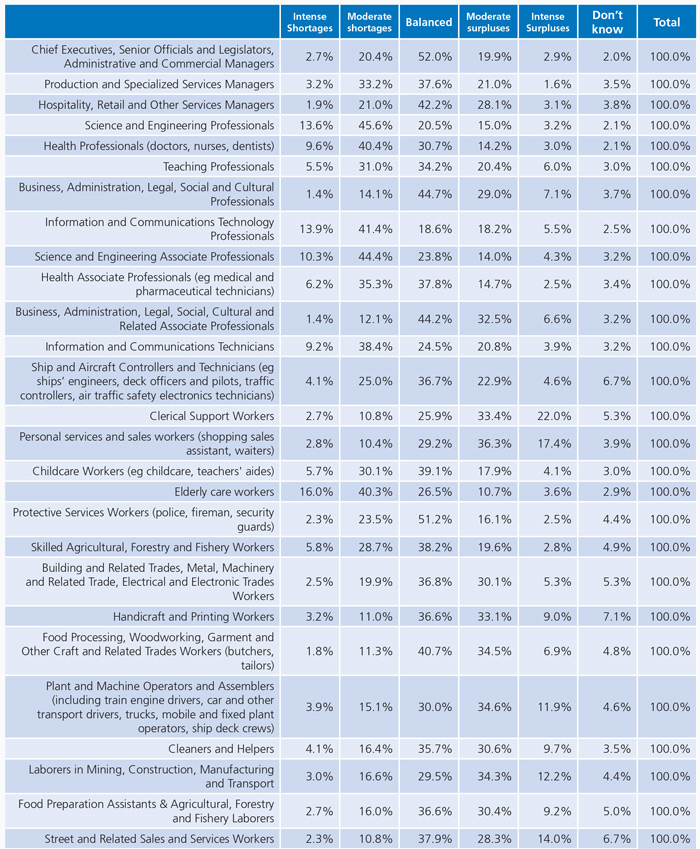
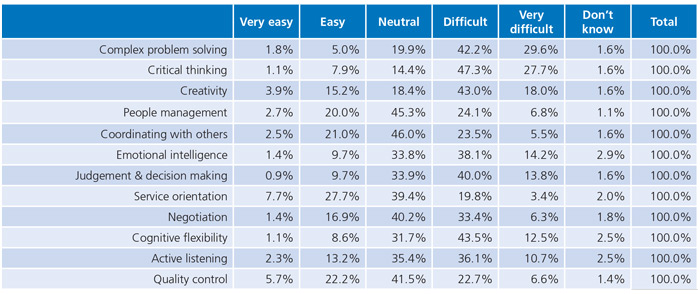
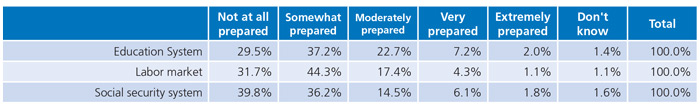
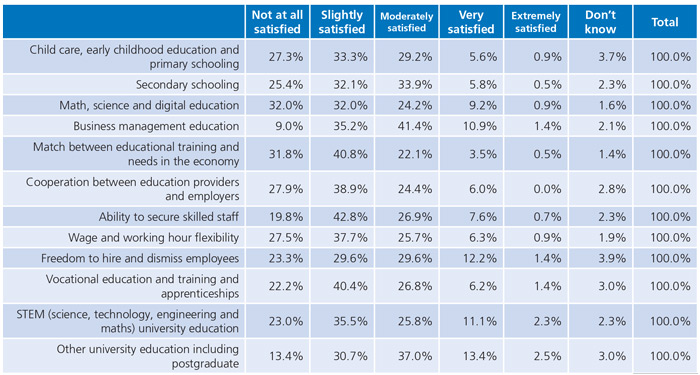
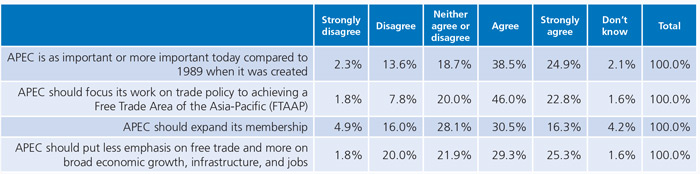

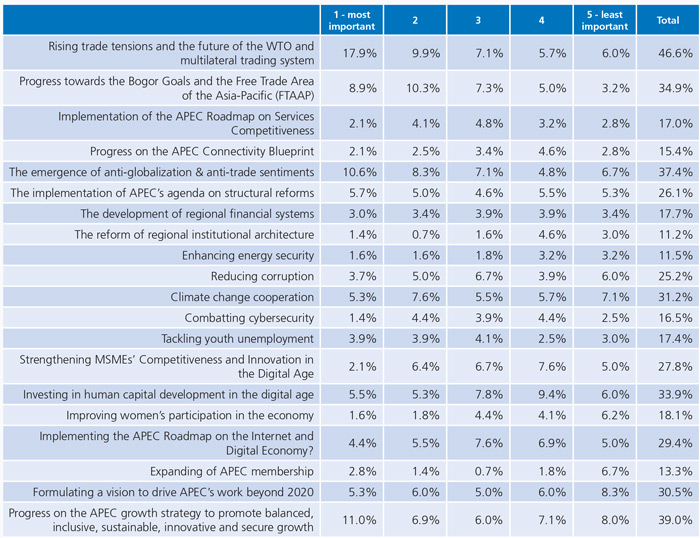
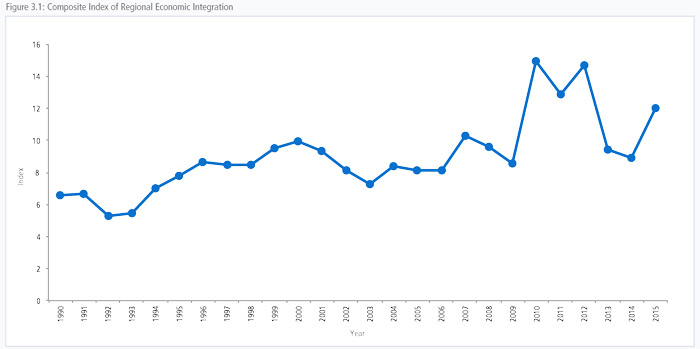
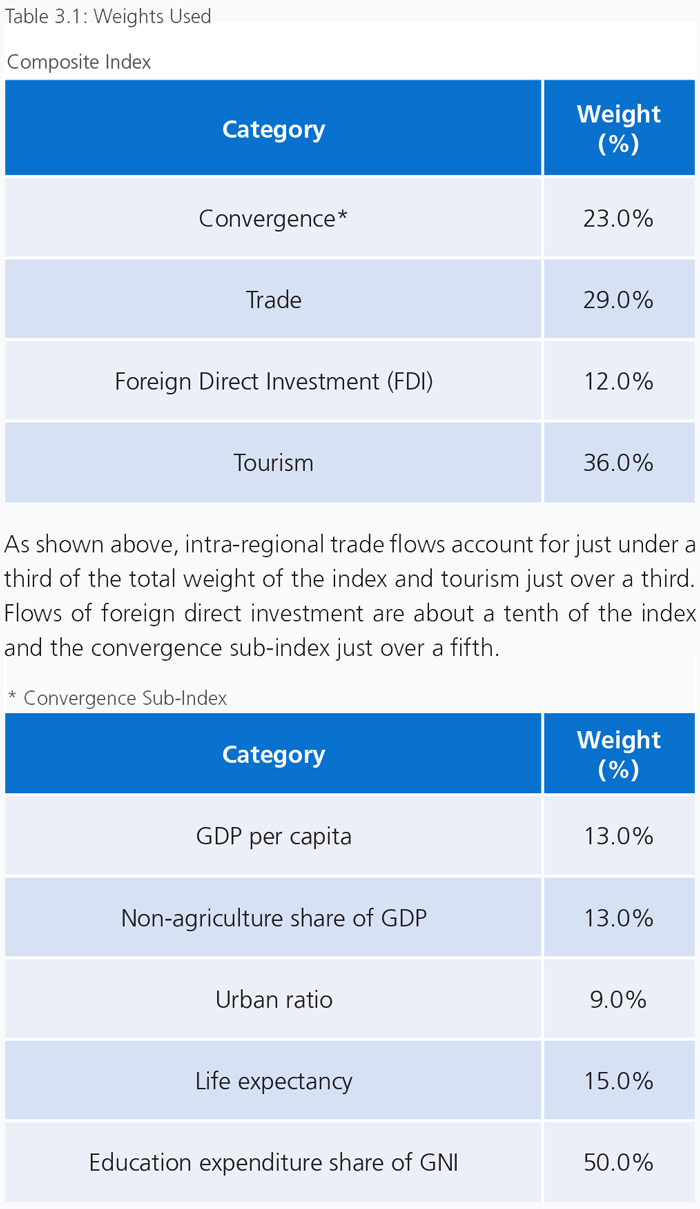 The weights given to each dimension are determined using principal component analysis.