CHAPTER 1 - ASIA-PACIFIC ECONOMIC OUTLOOK
CONTRIBUTED BY MR. EDUARDO PEDROSA, SECRETARY GENERAL, PECC INTERNATIONAL SECRETARIAT AND COORDINATOR, STATE OF THE REGION
The Asia-Pacific economy is expected to grow by 3.6 percent in 2017 and 2018. This is a significant improvement from last year when growth was at around 3.2 percent. Importantly, this forecast is better than previous estimates potentially ending a cycle of downward revisions. Much of this improvement comes from faster than expected growth in the region’s largest economies: The United States, China and Japan. However, there remain important structural concerns about the nature of growth in the region: the extent to which aggregate demand has been boosted by increased levels of debt and the impact of rising interest rates and the end of quantitative easing by the US Federal Reserve; the slowing of trade growth and its future as a driver of growth for the region’s economies; and the impact of the digital revolution and the capacity of economies to adapt to and benefit from rapid technological changes.
This chapter on the Asia-Pacific economic outlook includes analysis of the regional outlook and the results of the Pacific Economic Cooperation Council (PECC) annual survey of the regional policy community. This year’s PECC survey was undertaken from August 10th to September 13th, 2017. It is not a survey of public opinion but of those engaged in regional policy processes from government; business; and the non-government (comprised of academia; media and civil society) sectors.
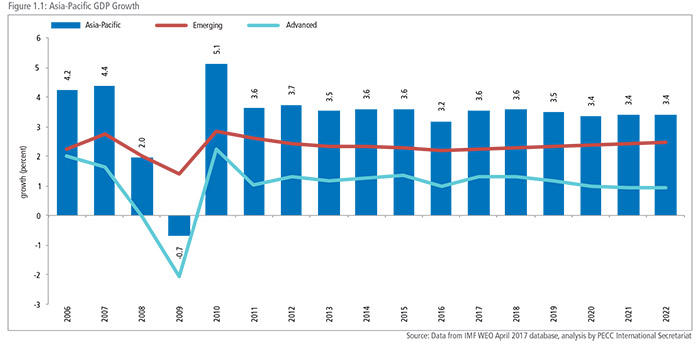
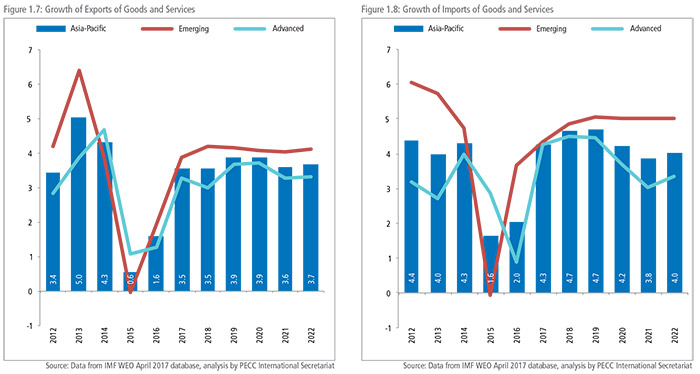
As shown in Figure 1.1, last year’s moderation in growth was largely caused by a dip in growth of the region’s advanced economies. Over the next five years, the forecast is for moderate but sustained growth. The slowdown in growth in 2016 has not resulted, as some had feared, in a lower trajectory of growth, in spite of the end of extraordinarily expansionist monetary policy. Moreover, the external sector is recovering with exports and imports of goods and services expected to grow at 3.5 and 4.3 percent respectively in 2017. This reflects increases in both volume and value terms as discussed below. This is a big improvement over 1.6 percent growth in exports and 2 percent in imports last year. As discussed later in this chapter, there remain many questions on the role that the external sector is likely to play as an engine of growth for the region’s economies.
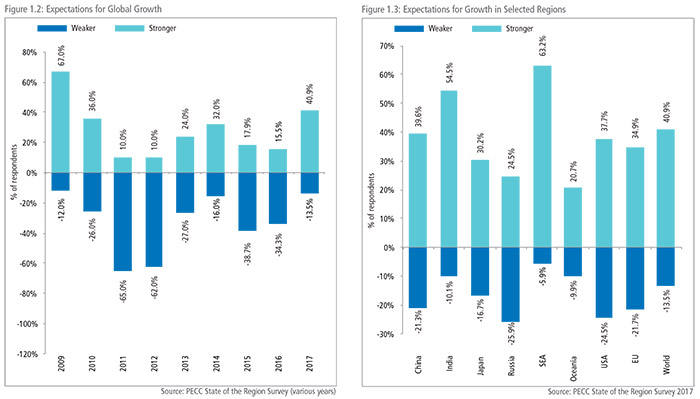
As shown in Figure 1.2, our respondents’ expectations for global growth over the next 12 months are significantly stronger than they were at this time last year. This aligns with most economic forecasts. Over 40 percent of respondents to PECC’s State of the Region survey expected world economic growth to be stronger over the next 12 months, compared to only 16 percent at the same point in time last year. Respondents were most optimistic about emerging economies, especially India and Southeast Asia. Importantly, expectations remain positive about growth in the world’s major economies, notably: the US, China and Japan as well as the EU and India. The survey results point to expectations of synchronized growth in the world – a significant turnaround from 2016 when the policy community was expecting growth to slow in China, Japan, and the EU.
RISKS TO GROWTH
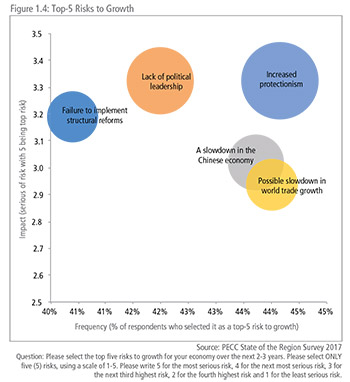
However, there are considerable downside policy risks that the policy community is concerned about. According to the survey, the top-5 risks to growth were:
• Increased protectionism
• Lack of political leadership
• A slowdown in the Chinese economy
• Possible slowdown in world trade growth
• Failure to implement structural reforms
Figure 1.4 shows the top-5 risks to growth where the horizontal axis indicates the percentage of respondents who selected the issue as a risk to growth for their economy while the vertical axis shows their estimate of the seriousness of impact of the risk. The bubble size reflects the overall seriousness in terms of both frequency and impact. Risks in the top right quadrant are those that were more frequently picked and given a relatively high impact.
FEARS OF INCREASED PROTECTIONISM
Over 44 percent of respondents selected increased protectionism as a top-5 risk to growth for their economy. By far, the subregion most concerned was North America – over 70 percent of respondents thought that rising protectionism was a potential risk to growth, more than double the number from 12 months ago.
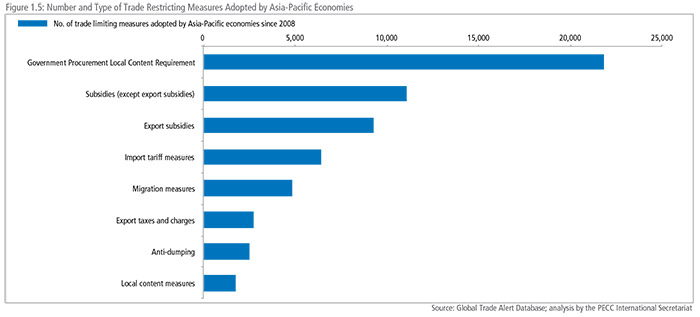
This finding should not be entirely surprising. According to the Global Trade Alert since 2008, Asia-Pacific economies have adopted a total of over 71,000 trade restricting policy measures. This is only a count of measures – not the extent to which they impact trade. However, this year’s Global Trade Alert estimates that 73.5 percent of G20 exports face some type of trade distortion in foreign markets, ten times the trade coverage of protectionism reported by the WTO.1
Figure 1.5 shows the top 10 most frequently used trade restricting measures adopted by Asia-Pacific economies. The types of measures used have not been tariffs but local content requirements in government procurement and subsidies. While some of these measures may comply with global trade rules, they nonetheless have the impact of restricting already tepid trade growth.
While we have not seen tit-for-tat increases in tariffs, there have been threats that such tariffs would be imposed. Such policy measures would have a disastrous impact on global growth; for example, it has been estimated that a 45 percent US tariff on Chinese imports could reduce global GDP by around 0.45 percent. The US economy would also likely suffer a large setback to the tune of 1.7 percent of GDP.2
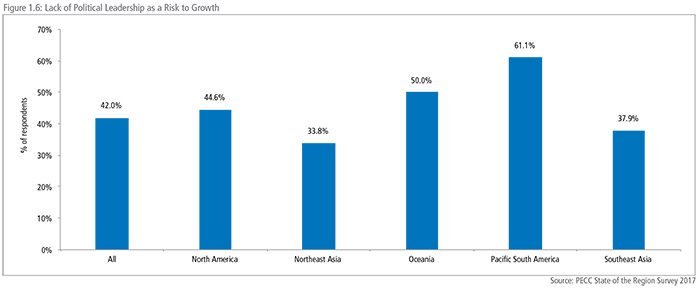
LACK OF POLITICAL LEADERSHIP
Next to ‘increased protectionism,’ ‘the lack of political leadership’ was the second highest risk to growth selected by the regional policy community. There was considerable variation among subregions on this risk, with those from Pacific South America selecting it most often and those from Northeast Asia the least.
Given the other risks to growth, this may well be a comment on the relative ineffectiveness of Leaders’ statements in the face of policy reality. Almost 10 years ago at the first G20 Summit in Washington in November 2008, world leaders underscored “the critical importance of rejecting protectionism and not turning inward in times of financial uncertainty” and committed to “refrain from raising new barriers to investment or to trade in goods and services, imposing new export restrictions, or implementing World Trade Organization (WTO) inconsistent measures to stimulate exports.” Shortly after, APEC Leaders reinforced that message at their meeting in Lima. Since then, every G20 and APEC Leaders’ summit have applied similar language.
The increased use of trade restricting measures calls into question the credibility of the G20 and APEC. This is not to say that such statements are not worth the paper they are written on, but that there is an increasing gap between such statements and the reality on the ground. At their summit in Hamburg in July 2017, G20 Leaders reiterated their political commitment to “keep markets open noting the importance of reciprocal and mutually advantageous trade and investment frameworks and the principle of non-discrimination, and continue to fight protectionism including all unfair trade practices and recognise the role of legitimate trade defence instruments in this regard.” The reality is that such commitments have been honored more in the breach than in the observance.
On the side of forward momentum, there is uncertainty over the future of regional trade initiatives. The US withdrawal from the Trans-Pacific Partnership (TPP) might have ended that particular experiment but when TPP-11 Ministers met on the sidelines of the APEC Ministers Responsible for Trade meeting in May 2017, they agreed “on the value of realizing the TPP’s benefits and to that end, they agreed to launch a process to assess options to bring the comprehensive, high quality Agreement into force expeditiously.”
At the same time, ASEAN and its partners in the Regional Comprehensive Economic Partnership (RCEP) negotiations have been trying to conclude the agreement by the end of this year. The prospects for RCEP completion is discussed further below. In the meantime, outside of the Asia-Pacific region, other agreements have also been concluded or are near conclusion including the EUJapan Trade Agreement, and the Canada-EU Trade Agreement. Additionally, the EU and ASEAN announced earlier this year an attempt to explore restarting FTA negotiations with bilateral deals already struck with Singapore and Vietnam, with negotiations underway with the Philippines and Indonesia. As much as the TPP was an attempt to update the rules for trade in the twenty-first century, it seems that much more writing is being led by Europe than the economies of the Asia-Pacific.
Given the benefits that the Asia-Pacific region has had and still stands to gain from increased integration, resolving the conundrum of the general benefits vs. localized costs should be a priority. As discussed in Box 1.1, the macroeconomic benefits of trade integration tend to be large in percentage terms but there are very specific adjustments that come with integration.
BOX 1.1 THE STATE OF PLAY OF REGIONAL ECONOMIC INTEGRATION INITIATIVES
Contributed by Kenichi Kawasaki, Professor and Senior Fellow, National Graduate Institute for Policy Studies (GRIPS), Japan
A high degree of uncertainty on the future of regional economic integration initiatives has emerged over the past 12 months. This box discusses the economic impacts of several possible scenarios of regional trade agreements (RTAs) based on economic model simulations.
On January 23rd 2017, President Trump withdrew the United States from the Trans-Pacific Partnership (TPP) Negotiations and Agreement, removing a critical piece of the regional trade architecture. However, in May 2017, at the sidelines of the meeting of Asia-Pacific Economic Cooperation (APEC) Ministers Responsible for Trade, the remaining 11 TPP members “agreed on the value of realizing the TPP’s benefits.” A fundamental question is whether or not, absent the continued participation of the world’s biggest consumer market, such an undertaking still makes economic sense. According to economic modeling studies, the implementation of the TPP-11, could boost the GDP of the 11 economies by 3.0 per cent on average by tariff reductions and possible non-tariff measure (NTM) reductions, compared with 4.0 per cent as a result of potential TPP with the US (Kawasaki 2017). Other estimates show similar positive results, for example, Dade and Ciuriak have also suggested that the economic welfare benefits of about C$21 billion would be generated for the 11 economies, which is around two thirds of the estimated benefits from TPP-12 (C$33 billion).
Macroeconomic impacts of TPP would be less affected by the absence of the US because of the possible impacts of NTM reductions. The real GDP gains from tariff reductions by the 11 economies would account for around 40 percent of TPP- 12 (Kawasaki 2017). On the other hand, gains from NTM reductions by the 11 economies would be around 80 percent of TPP-12. This is due to the spillover effects of NTM reductions to third economies. As many NTMs relate to differences in regulations, which mostly cannot be altered on a purely bilateral and preferential basis, the reductions will improve market access for third economies as well operating on a most favored nation (MFN) basis.
The current US president has, on occasion, threatened to impose tariffs on imports from China and Mexico. However, such measures would not save jobs across the economy but would more likely lower growth, not just in China and Mexico, but also in the US (Kawasaki (2017) and PC (2017)). While the economic impacts on other economies would be limited, with the trade diversion effects offsetting the adverse income effects, “significant worldwide increases in protection would cause a global recession.” (PC 2017). The Productivity Commission’s modelling has estimated that worldwide increases in tariffs of 15 percentage points would cause global trade to lower by 22 percent and global output to lower by nearly 3 percent.
The development of the Regional Comprehensive Economic Partnership (RCEP) negotiations as another major vehicle of mega RTAs in Asia-Pacific has been a matter of great interest to many. The economic impacts of RCEP largely depend on the levels of trade liberalization. As a matter of fact, 115 out of 120 possible combinations of bilateral trade agreements among the RCEP economies are already covered by concluded or implemented RTAs and bilateral free trade agreements (FTAs). The remaining five combinations are Australia-India, China-India, India-New Zealand, Japan-China and Japan- Korea. Estimates suggest that if the RCEP economies eliminate all imports tariffs that existed as of 2011, the average real GDP of the RCEP economies would be boosted by 1.9 percent (Kawasaki 2017). However, if RCEP would be limited to the existing RTAs/FTAs among the RCEP economies with the removal of tariffs just in the five remaining combinations mentioned above, real GDP gains would be far smaller at 0.5 percent. Moreover, the Association of South-East Asian Nations (ASEAN) economies would lose rather than gain from those tariff reductions in the latter case due to trade diversion effects.
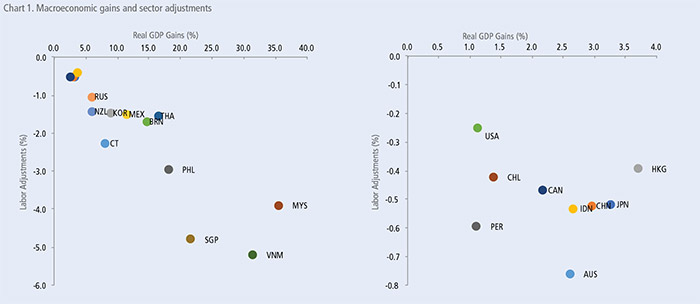
Underlying the uncertainty over the future of trade integration are concerns about the rising income inequality and distributional impacts of trade liberalization. While economic models suggest that initiatives such as the TPP, RCEP and possibly an eventual Free Trade Area of Asia-Pacific (FTAAP) would generate substantial macroeconomic benefits, there would be winners and losers at sectoral levels in accordance with their comparative advantage. Capital and technologyintensive sectors are expected to expand in industrialized economies. Labor-intensive sectors are expected to expand in emerging economies. Primary sectors are expected to expand in physically larger economies. However, the magnitude of those structural changes is likely to be limited in comparison with expected macroeconomic gains. For many years, APEC Leaders have considered it a goal to eventually achieve an FTAAP. While much work has been done on the likely economic gains – which are large – relatively little has been done on the likely adjustments that would take place as a result of the FTAAP. Given the current political spotlight on trade, some initial work has been done to estimate the kind of adjustments an FTAAP might require. Based on modeling simulations, the magnitudes of the adjustments of employment, which is measured in terms of the share of the labor force that needs to shift from certain sectors to other sectors, are estimated to be less than 20 percent of real GDP gains on average among the APEC economies as a result of tariff removals and NTM reductions among the APEC economies (Chart 1) (Kawasaki, 2017). Clearly, further work is needed in this area, which APEC should facilitate, if it intends to continue working on this goal.
The modelling exercises are instructive on the importance of unilateral reforms to economic growth. Breaking down the source of economic impacts of the FTAAP by policy measures, most of the macroeconomic benefits come from the reduction of an economy’s own tariffs and NTMs rather than from improved access to the market of trade partners (Kawasaki 2015). This is especially true of the smaller economies in the ASEAN and the Asia-Pacific.
The key point is that the economic gains from regional economic integration are sustainable. The effects of macroeconomic policy measures, including monetary easing and fiscal stimulus, disappear when those expansionary policy measures return to business as usual. On the other hand, the impacts of structural reform measures, including those resulting from RTAs/FTAs through more efficient resource allocation and productivity improvements, continue over the medium- and long-term horizons.
POSSIBLE SLOWDOWN IN WORLD TRADE GROWTH
Regional export growth is expected to bounce back from postcrisis lows of 0.6 and 1.6 percent growth in 2015 and 2016 to 3.5 percent growth in 2017. Moreover, as shown in Figure 1.7 export growth is expected to further accelerate to 3.9 percent in 2019. A similar forecast is seen on the import side. While this improvement in trade growth is welcomed, it is well below pre-crisis levels and there is a debate on whether the slowdown in trade growth is caused by: business decisions (shortening value chains), slower growth in major markets, or the impact of protectionist policies discussed above.
A central question over the past few years has been the extent to which trade has ‘peaked.’ A special edition of this report in 2015 that focused on trade suggested a need for caution before reaching any conclusion.
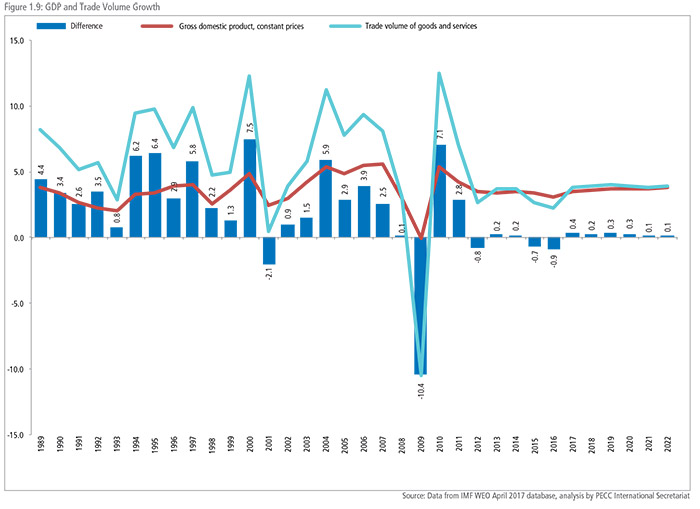
As shown in Figure 1.9 above, trade grew at a slower rate than GDP in 2015 and 2016. While trade growth is expected to outpace overall demand in 2017, the differential is markedly smaller than during the boom years of 1989-2007. The central argument was whether this is a structural or cyclical phenomenon.3 An analysis by the IMF and World Bank suggests that the changing relationship between trade and income at the global level is driven primarily by changes in supply-chain trade.
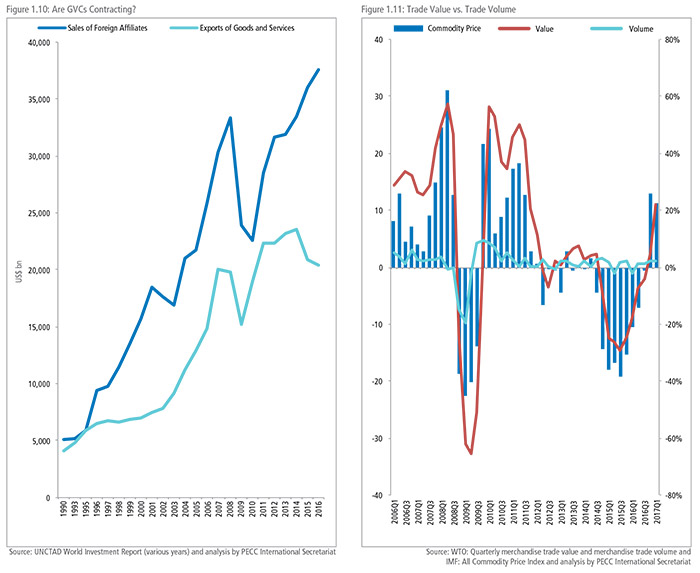
There has been mounting evidence that global value chains have been contracting with more multinational companies ‘onshoring.’ As shown in Figure 1.10, from 1990 to 2013, sales of foreign affiliates of multinational companies moved in lockstep with exports of goods and services. However, from 2014 to 2016, even as sales of foreign affiliates increased by over 12 percent, exports of goods and services decreased.4 UNCTAD argues that the deceleration in international production is a contributing factor behind slower trade expansion.5 The decision to produce onshore, closer to major markets, may be driven by changing commercial realities. However, in some cases it is possible that rhetoric and actual measures by governments listed in Figure 1.5 are influencing the decision-making of businesses.
Another possible explanation for the slowdown in trade growth is depressed prices. For example, crude oil prices peaked in 2008 at a price of over US$133 per barrel. Today, West Texas Intermediate is at less than US$50 a barrel. Figure 1.11 shows year-on-year changes in trade volume, value and commodity prices. At first glance, it appears that changes in trade measured in value terms is more closely linked to changes in commodity prices than changes in trade volume. However, analysis of the numbers suggests that variations in volume explain about 61 percent of changes in variations in value. There is also a link but not that strong a link between changes in the commodity price index and the trade value index.
In recent months, as shown in Figure 1.11, prices of commodities have been rising. While the IMF All Commodity Price index is limited to commodities, prices of other key products have also been rising. For example, the price of 2GB of DRAM rose by 14.2 percent in the first quarter of 2017, showing an upturn in the semiconductor segment.6 Part of this has come from very strong demand growth, with worldwide sales of semiconductors reaching US$97.9 billion in the second quarter of 2017, a 23.7 percent increase compared to the second quarter of 2016.
A SLOWDOWN IN THE CHINESE ECONOMY
For several years, a slowdown of China’s economy has been a top- 5 risk to growth in PECC’s annual survey. Even though China’s headline growth number has slowed from 10 percent annual growth to around 6.7 percent, the region’s largest emerging economy continues to account for around 40 percent of the region’s total growth. After China, growth in the United States contributes around 20 percent of the increase in the region’s output. As discussed in Box 1.2, one of China’s objectives is to transform itself from being the world’s factory to become the world’s market. That would involve a series of structural reforms which are already underway but not easy to manage in such a large economy.
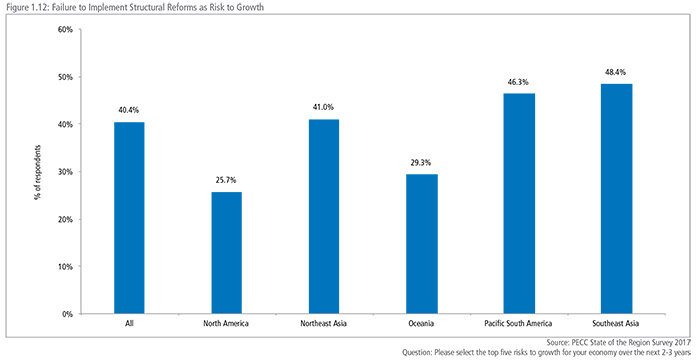
FAILURE TO IMPLEMENT STRUCTURAL REFORMS
The fifth most serious risk to growth was the failure to implement structural reforms. Southeast Asian and Pacific South American respondents were most concerned, with almost half selecting it as a top-5 risk to growth.
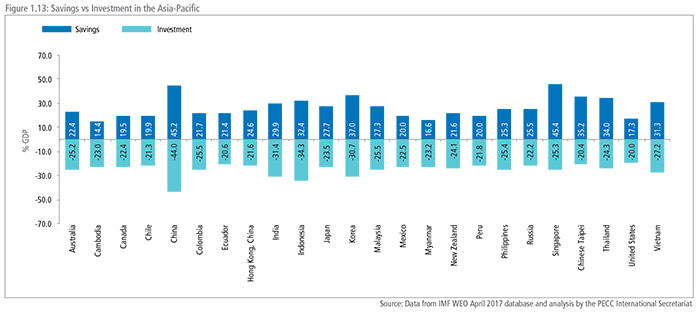
A PECC taskforce established in response to the Global Financial Crisis (GFC) argued that the crisis occurred - at least as a partial explanation – due to unbalanced economic growth. To rebalance growth and avoid a reemergence of such imbalances, economies should pursue different structural reforms: to encourage either more savings and less investment in the case of deficit economies and the opposite in the case of surplus economies. It was argued that the magnitude of such changes was relatively small compared to broad categories of domestic expenditures. The same report argued that while temporary stop-gap measures such as fiscal and monetary stimulus were necessary to sustain aggregate demand, they needed to be replaced by productivity enhancing structural reforms.
In the years following the GFC, while low interest rates and unprecedented insertions of liquidity into the financial system have helped sustain economic growth, it resulted in massive increases in debt. That stimulus has helped governments avoid swallowing the bitter bill of often painful - and politically difficult - but necessary structural reforms. For example, in 2009, APEC Leaders committed to “strengthen social resilience to help individuals overcome shortterm difficulties“ and to “improve outcomes in education and skills-training to enhance long-term economic security; consider income supplements or earned income tax credits that encourage work and enterprise; and design social safety nets that provide short-term economic security but avoid long-term dependency.”
One metric of imbalances in recent years has been the current account. Current account imbalances remain largely in check and far from the peaks in the mid-2000s when they began to reach close to 6 percent of GDP for the United States, and over 8 percent in China. Today, China’s current account surplus is estimated to be at around 1.3 percent of GDP and the US deficit at around 2.7 percent of GDP, within the boundaries of what is considered sustainable. Moreover, as was noted in PECC’s Pacific Economic Outlook in 2001, “current account imbalances reflect private economic decisions to save and invest and are no economic problem in themselves…however, [they] risk generating negative political reactions in deficit economies.”
Moreover, the savings needs of an economy and its propensity to consume are linked to both the availability of social safety nets, credit, as well as population structure. Given the rapid aging of societies in the Asia-Pacific, it should not be surprising that households tend to save more, especially given the underdevelopment of the financial sector and lack of breadth or depth (and often both) of social safety nets such as medical and unemployment insurances, as well as pensions.7 The future trajectory of savings-investment balance and therefore the current account balance remains unclear. Generally, with aging populations, it would be expected that the savings rate would decline. However, the household savings rate will increase if uncertainties about the future rises, or social safety nets are degraded or viewed as likely to be insufficient for future needs. One possible scenario is that the aging of the population leads to strains on the finances of public pension and medical insurance programs, which in turn causes benefits to be reduced. As people save more to compensate, this indirect effect of aging may more than offset the direct effect of aging (which is to cause the household saving rate to decline). It all depends on the relative strengths of the direct and indirect effects of population aging on household savings.
In October 2016, the IMF warned that the global debt of the nonfinancial sector (general government, household, and non-financial firms) was at a record high of 225 percent of world GDP. Almost two-thirds - US$100 trillion - is debt of the private sector.8 While no universal agreement exists of what is an excessive level of debt, there is little doubt that this issue will need to be dealt with in the coming years. On September 20th, 2017, the US Federal Reserve announced that it would begin a ‘balance sheet normalization program’ – in other words, ending quantitative easing. Importantly, the Federal Reserve’s announcement noted the strength in the US economy which was expected to continue in the coming months despite the devastation wrought by a succession of hurricanes that hit the US mainland.
Even though some central banks are likely to continue quantitative easing, the September decision represents an end to an extraordinary period of monetary stimulus. There are risks that as interest rates rise and financial conditions tighten, borrowers will face challenges servicing that debt, especially if growth rates remain sluggish and revenue growth fails to match rising debt obligations.
Data from the Bank of International Settlements (BIS) for a few selected Asia-Pacific economies suggest that over the past ten years, household debt has increased by 40 percent but debt levels in the non-financial corporate sector have increased by a significantly larger percentage of 84 percent. While both household and corporate debt levels have increased in all those sampled economies, the trend has been more notable in some economies than others.
A critical point in resolving the debt issue as interest rates rise will be to raise growth rates and productivity levels. The Global Infrastructure Hub estimates that globally, the infrastructure requirement from 2016 to 2040 would be around US$94 trillion - on average $3.7 trillion per year and 19 percent higher than is currently being invested. The estimated increases by a further US$3.5 trillion will be required to meet the United Nations’ Sustainable Development Goals for electricity and water.9 Of this, 54 percent of that infrastructure investment is needed in Asia. This is not limited to the emerging economies but the more advanced economies as well.
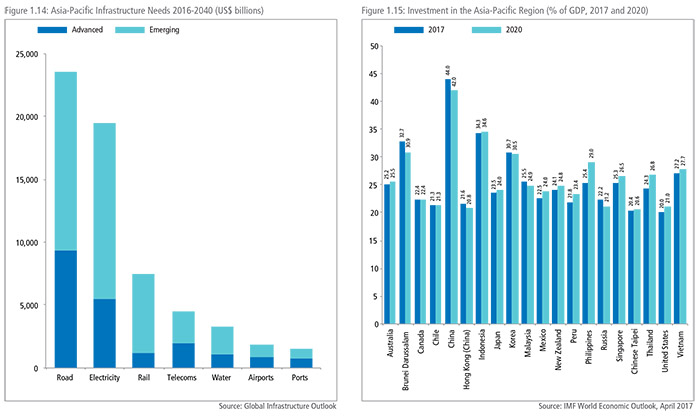
As shown in Figure 1.14, while emerging economies account for most of the region’s infrastructure investment requirements over the next 24 years, the region’s advanced economies still need to invest around US$20 trillion in infrastructure. For example, the Global Infrastructure Outlook estimates that the United States needs to spend around US$12.3 trillion in infrastructure over the next 25 years. However, the gap between estimated infrastructure expenditure and the total needed is also the highest for the US where the gap is estimated at around US$3.8 trillion or 31 percent of its need. While investment, as a percentage of GDP in the US, is expected to climb to 21 percent over the next few years, it is well below the levels in other advanced income economies such as Japan and Australia, which are expected be investing about 24 and 25 percent of GDP respectively. Investment in infrastructure was a campaign theme for President Trump and it could bring a tremendous boost to growth in the world’s largest economy. However, as discussed above, the savings-investment balance in the US remains in deficit, with investment of around US$500 billion more than in savings. A significant increase in investment would push the US current account into a greater deficit – not a problem in itself but likely to attract domestic criticism.
On the other hand, investment in China had been a significant driver of growth in the immediate post-GFC period helping to sustain growth in the face of a deteriorating external market. In 2011, gross capital formation was estimated to have reached a peak of 48 percent of GDP and has been declining since then. It is expected to reach about 42 percent of GDP by 2020 in line with China’s ambition to move from being the world factory to the world market (see Box 1.2). Indonesia is looking at a period of sustained investment growth and the rate is expected to be above 34 percent of GDP over the next four years. This is a marked improvement to the long period after the Asian Financial Crisis when investment fell to levels around 25 percent of GDP. Likewise, in the Philippines, investment as a percentage of GDP is expected to grow to around 29 percent. Addressing the infrastructure deficit has been behind the thinking of initiatives to improve connectivity in the region such as ASEAN Masterplan for Connectivity, the APEC Connectivity Blueprint and the Belt and Road Initiative. As previously discussed in this chapter, the nature of trade in the region is changing with global value chains shortening and cross-border trade shifting from an emphasis on high value and low volume to low value and high volume.10 While this may not be a consistent phenomenon, as the opportunities for cross-border e-commerce and digital trade increase, it is increasingly likely that more trade flows will be of lower value but higher in volume, which underscores the need to think about changing infrastructure requirements.
BOX 1.2 THE BELT AND ROAD INITIATIVE: A NEW FRONTIER FOR WIN-WIN COOPERATION
Contributed by Ruan Zongze*, provided by CNCPEC
China’s economy is expected to grow by 6.7 percent in 2017 continuing in its role as the leading contributor to global growth. In recent years China has increased its pace of its reform while widening the footprint of development by encompassing both sea and land areas, as well as its eastern and western regions. The aim is to continue to open, transforming China from a “world factory” into a “world market.”
Injecting Impetus into World Economy
The world economy is at a critical juncture, undergoing overall recovery yet facing multiple risks and challenges. Therefore, providing positive energy and injecting new momentum into world economic growth, while directing globalization toward a more balanced, inclusive, and sustainable development has become a major issue facing the international community.
The Belt and Road Initiative (BRI) is the “Chinese prescription” for addressing these issues. It has been four years since China put forward the BRI. Despite the rising anti-globalization sentiments and protectionism, the BRI stands out by firmly adhering to the initiative’s openness and inclusiveness, characterized by wide consultation, joint contribution and shared benefits. Over the years, the BRI has gradually entered a new phase of comprehensive and pragmatic cooperation. So far, more than 100 economies and international organizations have voiced their positive response and support to the initiative, while China has signed cooperation agreements with 69 of them. As such the BRI has ultimately offered a new paradigm and momentum for promoting the sustainable development of global economy toward a new type of international relations with win-win cooperation at its core.
Complementary to the BRI are the Asian Infrastructure Investment Bank (AIIB), the Silk Road Fund and the BRICS New Development Bank, which operate independently. They have also become key drivers for emerging economies to facilitate infrastructure construction, promote world economic growth and contribute to the reform of international economic governance. In the year since the AIIB started operations it has approved the first four projects, totalling about US$500 million and covering such areas as energy, transportation and urban development in Bangladesh, Indonesia, Pakistan and Tajikistan. On March 23, 2017, the AIIB announced its approval of 13 new members, with its membership reaching 70, more than that of the European Bank for Reconstruction and Development (EBRD) and the Asian Development Bank (ADB), thus becoming the world’s second largest multilateral development institution. The Silk Road Fund focuses on the medium and long-term investment under the BRI and is the largest multilateral cooperation fund with high standards sponsored by the Chinese government. In early 2016, the first investment project of the Silk Road Fund, the Karot hydropower project which is part of the China-Pakistan Economic Corridor, was initiated.
Development Opportunities for Participating Economies
Through the BRI, over the past three years, China has increased positive interactions with economies along the routes, and offered an historical opportunity for common development. The focus of BRI economies is policy coordination, facilitating connectivity, unimpeded trade, financial integration and enhancing people-to-people connectivity. In 2016, the total imports and exports between China and BRI members amounted to 6.3 trillion yuan; while the direct investment from China to those economies reached US$14.5 billion and the cumulative investment was over $18.5 billion, which produced nearly $1.1 billion of revenue and 180,000 jobs. Investment cooperation between China and those economies continued to rise in 2017. In the first quarter of 2017, non-financial direct investment by Chinese enterprises in 43 economies along the Belt and Road witnessed an increase of US$2.95 billion, accounting for 14.4 percent% of China’s total foreign investment over the same period, an increase of 5.4% from the previous year.
The BRI has successfully established several cooperative platforms and bilateral and multilateral mechanisms at different levels, linking China’s development strategy to that of the Belt and Road members and regions. The BRI has become connected in its strategic planning with multiple economies and regions: including the Eurasian Economic Union (EEU); the “Prairie Road” of Mongolia; the “Bright Path” of Kazakhstan; the Juncker Investment Plan of the EU; the “Two Corridors and One Ring” of Vietnam; the “Vision 2030” of Saudi Arabia; the “Northern Powerhouse” of the United Kingdom; Turkey’s Middle Corridor Initiative; Australia’s plan to develop its northern region; and Laos’ national strategy to transform from a land-locked to a land-linked state. As the BRI’s flagship project, the China-Pakistan Economic Corridor sets a strong example for the construction and overall deployment of Belt and Road projects in other regions. The development of the China-Mongolia-Russia Economic Corridor has also been proceeding apace.
The BRI connects the two ends of the Eurasian continent: one end is the vibrant East Asian economic circle, the other is the developed European economic circle, while the middle section is the hinterland with huge potential. The BRI matches the development demands of China with those of the economies along the Belt and Road. For example, as the “Silk Road on the track,” the China-Europe freight railway line is an artery across the Eurasian continent, which has established connectivity, enhanced trade and investment, upgraded industrial capacity, and forged a super development area on the Eurasian continent.
Important Practice for a New Type of International Relations
Twenty years after the end of the Cold War, the world trend toward multi-polarization is increasingly irresistible, and human society will become more pluralistic, inclusive and balanced. However, peace and development for mankind still faces a multitude of obstacles: the international situation is intricate and complex, and global challenges are continuously emerging, thus increasing the uncertainty of the future. Resolving global challenges, therefore, requires global efforts.
Under such a historical context, China has grasped the opportunity to launch the idea of building a community of shared future by proposing the BRI which shapes a new type of international relations and improving global governance. The underlying concept of the BRI is not a collection of shortterm projects but to strive to build a grand future of common destiny. Although a zero-sum mentality still manifests itself in current international relations, the BRI concept of wide consultation, joint contribution and shared benefits aims to build a global network of partnerships in place of alliances. It is also conducive to reshaping the pattern of relationships among economies toward a new focus on win-win cooperation and common development.
In summary, the BRI embodies the common resolve by China and the international community to further promote economic globalization, support open and free trade, and build a community of shared future, which bears particular significance given the current challenging international context.
*Ruan Zongze is Executive Vice President and Senior Research Fellow of China Institute of International Studies (CIIS). He is also Chief Editor of China International Studies. This article was translated from the Chinese-language journal Qiushi, 2017(10).
PROSPECTS FOR FREER TRADE
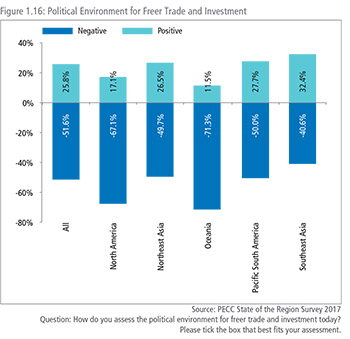
In spite of the macroeconomic benefits of freer trade discussed in Box 1.1, further integration initiatives are hampered by a less than benign political environment. Over half of all respondents to PECC’s survey had a negative assessment of the political environment for freer trade and investment today.
As shown in Figure 1.16, the most negative were respondents in North America and Oceania. However, unlike last year’s survey, no sub-region of the Asia-Pacific had an overall net positive assessment of the political environment for freer trade. The least negative were Southeast Asians and those from the Pacific South America. This potentially gives some higher hopes for initiatives such as the ASEAN Economic Community and the Pacific Alliance and their plans to deepen integration, such as the AEC 2025 and the RCEP, the Pacific Alliance’s negotiations with other regional economies through an associate member status with Australia, Canada, New Zealand, and Singapore.
WHAT PROSPECTS FOR THE FTAAP?
Despite the negative prognosis on the political environment for freer trade in the region, the regional policy community remained somewhat optimistic on the prospects of the two most likely pathways for achieving the Free Trade Area of the Asia-Pacific.
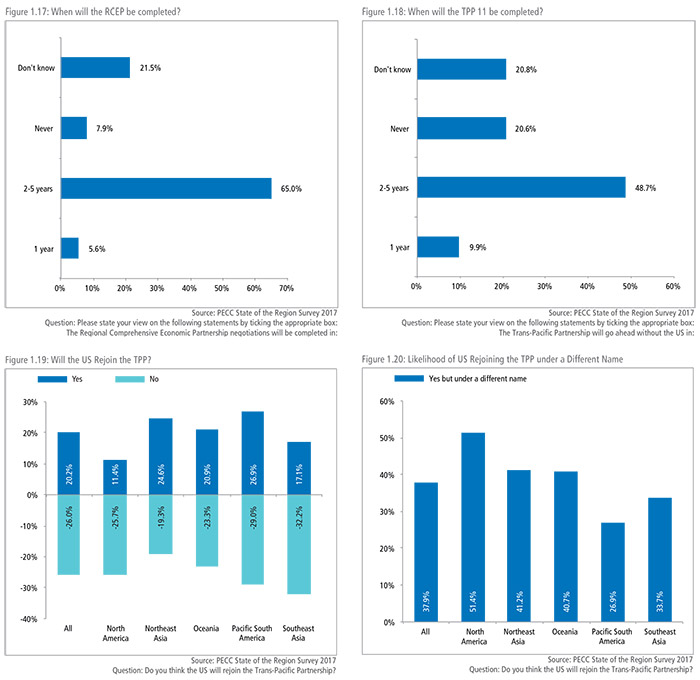
Close to two-thirds of respondents expect that RCEP, which brings together ASEAN’s Plus-1 agreements into a single trade area, will be completed within the next 2-5 years. Even though this is beyond the revised end of 2017 deadline, that there remains a positive view on RCEP completion is encouraging given the dour view on the political environment for freer trade around the region. Opinions across the region were evenly shared with no sub-region or sector thinking that the RCEP could be completed within a year or never.
A similar set of responses was given with respect to whether the TPP would go ahead without the US. Close to 50 percent of respondents thought that the TPP-11 (the TPP without the US) would go ahead within the next 2-5 years but a sizeable 21 percent thought it would not happen. The most optimistic about the prospects for the TPP-11 were respondents from North America and Oceania with 18 and 19 percent respectively thinking it could happen within a year.
Just over a quarter of respondents thought that the US would not rejoin the TPP but a fifth thought that it would rejoin eventually. Almost 38 percent of respondents thought the US would join but under a different name. Moreover, as shown in Figure 1.20, most North Americans thought that the US would rejoin the TPP but under a different name.
PRIORITIES FOR THE APEC LEADERS’ MEETING As APEC
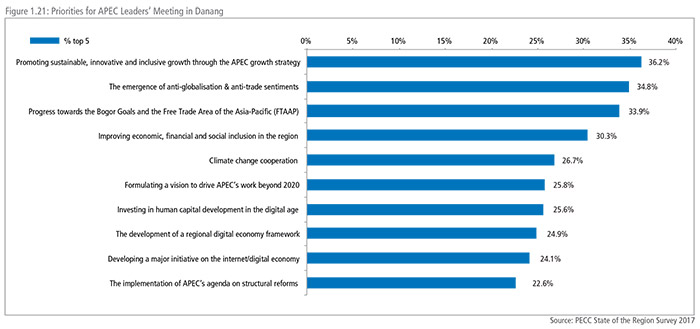
Leaders gather for their meeting in Danang, it is most likely that the disconnect between the political environment for freer trade and the need for strategies to boost growth is likely to come to the fore. Since PECC started its annual survey of the policy community, the achievement of the Bogor Goals or the FTAAP have tended to be the number one priority for APEC Leaders’ discussion. However, this year, the top-5 priorities were:
• Promoting sustainable, innovative and inclusive growth through the APEC growth strategy
• The emergence of anti-globalization & anti-trade sentiments
• Progress towards the Bogor Goals and the Free Trade Area of the Asia-Pacific (FTAAP)
• Improving economic, financial and social inclusion in the region
• Climate change cooperation
Although the Bogor Goals and the FTAAP were still considered a priority, they came somewhat lower than the need to discuss promoting sustainable, innovative and inclusive growth in the region. Also notable was that the policy community also thought that APEC Leaders need to discuss the emergence of antiglobalization and anti-trade sentiments. This indicates a strong recognition of the need for APEC to have a balanced agenda that takes into account the concerns of all stakeholders in the regional economic integration process to ensure that growth is more inclusive.
The top four priorities are not mutually exclusive even if some perceive them to be. As discussed in Box 1.1, APEC’s long term of vision of the Free Trade Area of the Asia-Pacific (FTAAP) would result in much stronger growth for all APEC economies but there are also adjustments that need to take place to ensure that the benefits of that growth are more inclusive.
APEC can address the emergence of doubts about the benefits of globalization by complementing its work on trade with an equally robust work on social policies such as education, social safety nets and labor market policies.
BOX 1.3 INCLUSIVE GROWTH AGENDA FOR THE ASIA-PACIFIC REGION
Contributed by CTPECC
The Asia-Pacific region is increasingly becoming the center of the global economy, driving world economic growth. However, structural changes in the economy and industry caused by the Global Financial Crisis have slowed regional economies efforts to resolve adverse issues hindering quality growth.
Economies in the region have been seeking feasible policy measures to promote inclusive growth. This means economic growth that promotes opportunities equally throughout society and distributes the benefits of increased prosperity in monetary and non-monetary terms more equitably.
Inclusive growth should develop in concert with overall economic growth so that the two can benefit from a synergistic effect. If the two diverge, there is a risk that only a select few end up enjoying the benefits of faster growth resulting in undesirable outcomes including increased social tensions undermining the consensus for solid growth strategies.
According to research carried out by the Asian Development Bank, promoting economic growth is a necessary condition for reducing poverty. Moreover, the extent of the success of poverty reduction strategies depends not only on the speed but also the form of growth. Inclusive growth places similar emphases on equal opportunities and economic growth. Economic growth should incorporate the following: 1) help mitigate possible distortions introduced by the market, competition and unexpected market failures, and provide more opportunities for the less well-off in society to grow; and 2) ensure a social safety net for those classified as the chronically poor, to provide for their specific needs.
To sum up, inclusive growth emphasizes equal opportunities for all thereby giving everyone a chance to develop. It promotes creating sufficient number of jobs through solid and continued economic growth, and offering comprehensive social inclusion.
Solid and continued economic growth is driven by the private sector, while the public sector is responsible for providing good infrastructure, human capital and economic stability, and policy measures such as taxation as incentives to cope with market imbalances, reduce the impacts of external factors, and maintain a healthy environment more conducive to investment and business.
Inclusive growth was listed as a core principle of the APEC Growth Strategy in the 2011 Leaders’ Declaration. Other principles included balanced, innovative, secure and sustainable growth. The idea of principles is to ensure that all people, in the process of globalization and regional economic integration, have access to opportunities and successes. The strategy also included bolstering the development of micro, small and medium-sized enterprises (MSMEs), promoting the entrepreneurial spirit, boosting human capital development and encouraging employers to hire more manpower. Implementation is expected to improve social safety nets and support disadvantaged groups. The APEC Growth Strategy is therefore geared toward “complete social inclusion.”
Furthermore, to sustain high levels of economic growth, innovative growth driven by the digital economy cannot be ignored. New and innovative digital products and services have brought transformed lifestyles and businesses, causing a digital revolution. The digital economy has rapidly entered the mass market, improving the efficiency of individuals, enterprises and governments, each in their own ways. In view of various priorities and needs in the region, the inclusive growth agenda in the Asia-Pacific should address the following key elements: the digital economy, MSMEs, women’s empowerment, and jobs and skills.
Digital Economy
TThere is currently a huge gap in economic development in the Asia-Pacific region. Several economies are still in the emerging and middle-income category. With appropriate investment, digital technologies and innovative business models could contribute to overcoming obstacles to economic development and financial inclusion.
Digital economy by definition refers to the economy supported and promoted by digital computing technologies. The traditional economic system is constrained by the law of diminishing returns. However, the digital economy will change the rule of the game to enjoy the “law of increasing returns”, simply because all data can be processed and digitalized to be knowledgeable products. In addition, the digital economy will also help increase government efficiency, transparency and inclusiveness. The digital economy will certainly require an optimal budget allocation, but in the following decade it will be a core factor in promoting inclusive growth.
MSMEs
Most businesses in the Asia-Pacific region are characterized as MSMEs. They provide the highest percentage of jobs. Hence, they are important drivers of inclusive growth and increased competitiveness. During the digital transformation of the economic and business environments of small enterprises, policymakers should provide business information, training, and access to funds to increase the competitiveness of MSMEs at good times and enhance resilience at bad times. This will also enable these enterprises to integrate more smoothly into global value chains and allow them to take more independent and critical roles in the regional economy.
Women Empowerment
This will be a crucial factor driving economic prosperity and growth in the Asia-Pacific region. Women constitute half of the world’s population, yet their participation in the global labor market is not proportionate. There remains considerable growth potential in this area. Increasing the labor participation of women will certainly bring added value, create socio-economic benefits and ultimately contribute to inclusive growth.
The public, business and labor should work together to bring about equality in work and life to encourage and empower women into the workplace. Promoting professional skills training to increase the areas in which women can develop further will also enhance the quality of family life.
Jobs and Skills
To increase the employment rate and competitiveness of the unemployed and young graduates, we need to make certain investments in human capital development. This entails making available relevant and specific professional skills training, providing assistance for the physically and mentally disabled, as well as offering a diversity of choices in education and vocational training.
Establishing links between academic and technical competencies, providing practical and accessible training options, helping people gain new skills are all important objectives. Investments made now to better equip the human resources adapt to the fast-changing nature of jobs will go a long way toward addressing the potential gaps in the future labor market.
Only 12 percent of respondents selected ‘Building political support on key issues for the WTO Ministerial’ as a top-5 priority for APEC Leaders. This is even less than the 18 percent who selected the WTO as a priority the last time a WTO Ministerial was scheduled. Exactly 10 years ago, as many as 52.1 percent of respondents to PECC’s survey selected the WTO for APEC Leaders’ discussion. In the interim, fewer and fewer stakeholders have seen it as a priority for the region. This might put into question whether the WTO’s negotiating function has become irrelevant but the breakthrough on the Trade Facilitation Agreement is a useful counter to this argument.
It is clear at least from this survey that high-level business support for negotiators to make concessions is going to be limited. The risk for the global system is that the WTO faces a crisis where damage to its reputation as the forum for trade negotiations also damages its role as a forum for dispute settlement. On a systemic level, this would leave further liberalization to preferential trade deals, which inevitably leave those not involved in the agreement facing reduced market access. This is a time when, in spite of limited support from the business community, government officials should be taking a leadership role to find a breakthrough in setting the rules of trade. It has been more than two decades since the last major round of multilateral trade negotiations were concluded leaving the rules of international commerce struck in the 20th century – highly problematic given the rapid pace of change and growth of e-commerce and the digital economy.
The region should be thinking about the relationship between bilateral and regional trade agreements and the multilateral trading system. APEC’s initial modus operandi had been to rely on ‘concerted unilateralism’ to achieve its goals of free and open trade and investment. However, as the negotiation of bilateral and regional trade deals increased much liberalization has been within the context of bilateral or plurilateral trade deals. One of APEC’s valuable roles has been to promote agreements that are consistent with WTO rules and serve as building blocks for the WTO. APEC could again reassert the need for such trade agreements to be with WTO rules and disciplines and APEC’s goals and principles. In its earlier phase, APEC Leaders sought advice from the APEC Eminent Persons’ Group on how to deal with regional and bilateral trade agreements in the context of APEC. The advice was that “further liberalization within the existing sub-regional trading (SRTAs), and any linkups between them, would be constructive and supportive of the overall APEC process only if they were within the principles of “open sub-regionalism.” In practical terms that has been much harder to achieve.
APEC members could play a leading role in thinking through how various trading systems relate to the multilateral trading system which should come with a strong assertion of APEC’s interests in seeing concrete outcomes at the forthcoming WTO Ministerial Conference to be held in Buenos Aires in December 2017. While the WTO Ministerial Meetings and outcomes tend to be esoteric in nature, trade, in recent years, has become a central issue in many domestic political debates. It would be useful for APEC Leaders to demonstrate (as they did in Lima) that they are cognizant of the concerns of those who feel that they have not benefited from the integration process and are willing to take concrete steps to address their concerns.
One area where experimentation at the sub-regional level could be of considerable value would be in dealing with e-commerce and the digital economy. The TPP offered one route for updating rules for e-commerce and internet-based trade. Even if it enters into force as the TPP-11, some of the fastest growing markets for internet and digital trade would not be covered. The WTO moratorium on e-commerce only applies to customs duties and not the application of value-added or sales taxes. However, as e-commerce continues to grow at an exponential rate, governments are beginning to address the application of domestic tax regimes on e-commerce and digital trade. Many of these policies apply ‘national treatment’ standards on foreign e-commerce such as a threshold for annual sales but they also tend to use 20th century solutions such as establishment of a commercial presence in markets. This creates considerable frictions especially for MSMEs trying to enter into the global marketplace. This has led some of those frustrated with the lack of progress at the multilateral level to call for a WTO 2.0 or an e-WTO.11
Addressing technological change is hardly a new issue for APEC. For example, in 2000, at their meeting in Brunei Darussalam, APEC Leaders adopted Action Agenda for New Economy that “outlined programs that will help our economies use advances in information technology to boost productivity and stimulate growth and extend services to the whole community” and in 2014 in Beijing, they endorsed the APEC Initiative of Cooperation to Promote the Internet Economy to name just two. One area of work that APEC could chose to focus on in the coming years is promoting more inclusive trade – by focusing on the barriers that disproportionately impact the region’s micro and small and medium enterprise. This was the same idea pushed for in the idea of a WTO 2.0 or e-WTO.
Today, around 45 percent of the population in the Asia-Pacific has access to the internet, up from 25 percent 5 years ago. However, that still leaves millions without access to the internet. The 9th Sustainable Development Goal to “Build resilient infrastructure, promote inclusive and sustainable industrialization and foster innovation” includes a sub-target to “strive to provide universal and affordable access to the Internet in least developed countries by 2020. As discussed in Chapter 2 of this report, the region faces multifaceted challenges if it is to benefit from the digital and internet economy. The ability of the internet and digital economy to facilitate a more inclusive and progressive form of globalization and integration is significant but the region needs to take a proactive role in setting priorities and rules to achieve this.
<< Previous
Next >>