The State of Trade in the Region
*Patrick Low and Eduardo Pedrosa
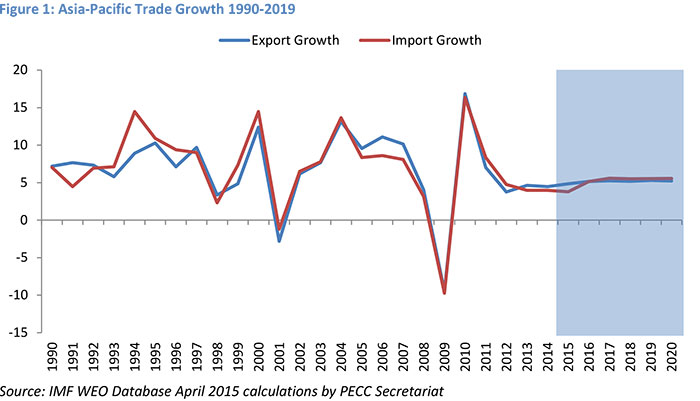
The Asia-Pacific regional economy is forecast to grow by 3.9 percent in 2015 a modest improvement from the estimated growth of 3.6 percent in 2014. Similarly growth in the exports of goods and services is also expected to improve slightly from an estimated 4.5 percent in 2014 to around 4.9 percent this year (Figure 1). Looking ahead, the growth in the export of goods and services is expected to rebound to an average growth of around 5.2 percent over the next few years.
While the region’s export performance is expected to be slightly better than the immediate post-Global Financial Crisis (GFC) years, this performance is well below the growth rates posted in the 1990s and early, pre-crisis 2000s. However, the aggregate numbers mask significant differences in trade performance across the Asia-Pacific region, with a number of economies expected to do better – in all likelihood helped by their ability to capture tasks from rapidly evolving global value chains.
The forecast for trade performance underscores the need for economies to continue the process of policy reforms if the external sector is to play anywhere near the kind of role it previously had in driving growth over the medium-term. Figure 2 reports on the results of a survey of the Asia-Pacific policy community conducted by the Pacific Economic Cooperation Council (PECC). According to the survey, the top 5 trade issues for APEC to address over the coming years are:
- The facilitation of participation of SMEs in global value chains
- The achievement of the Bogor Goals and the Free Trade Area of the Asia-Pacific (FTAAP)
- Services sector reforms and liberalization
- The design of trade policy in response to global value chains
- How economies can move to upgrade their participation in global value chains
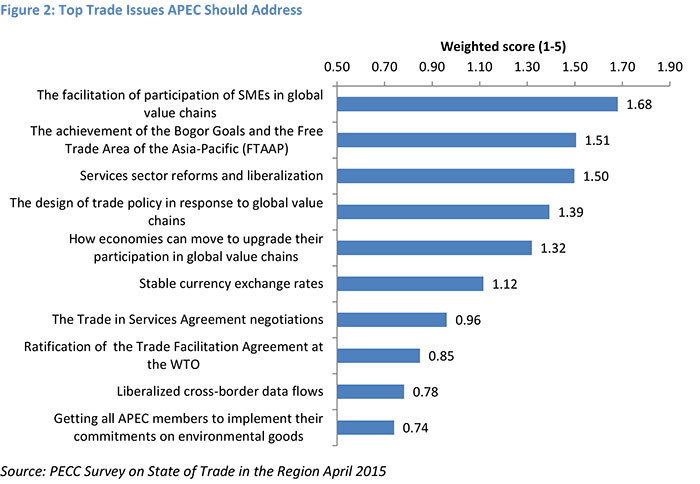
Worryingly for multilateralism, there was little support for APEC taking actions to promote issues on the global stage. Only 25 percent of respondents considered the WTO DDA a top 5 priority, compared to some 52 percent who placed facilitation of SME participation in global value chains in that category. The only multilateral issue that made it to the top 5 was the Trade in Services Agreement negotiations. Only 16 percent identified the expansion of the Information Technology Agreement as fitting into the top category. Support for APEC making the WTO DDA a priority remains the lowest amongst the business community, with only 21 percent of respondents selecting it as a top 5 priority compared to 24 percent of respondents from government and 28 percent from the non-government sector.
The lack of interest in the WTO DDA continues a trend from previous PECC surveys which ranked the DDA as a low priority.
These rankings echo views expressed on the major impediments to trade in the region as well as the extent to which the benefits of trade have been limited due to the lack of the participation of small and medium enterprises in global trade.
Determinants of Export Performance
While conditions in export markets are a key factor in determining an economy’s export performance, so too are domestic conditions. Generally speaking, while policies and conditions in export markets were seen in the survey to be a slightly more important factor in determining an economy’s export performance, the margin was surprisingly small (Figure 3).
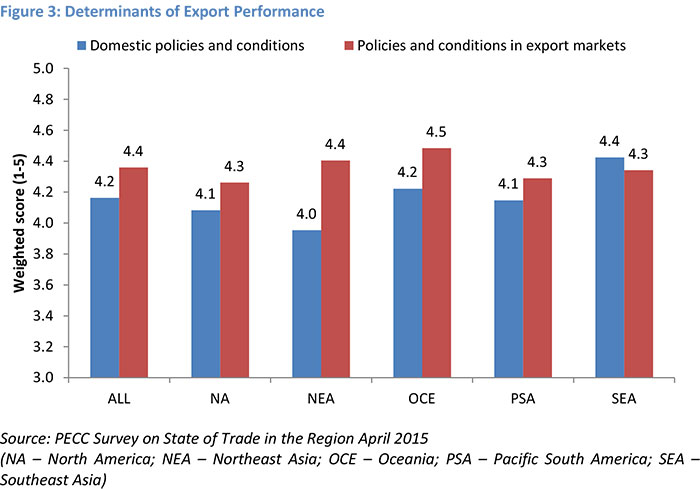
Question: How important are the following factors in determining your economy’s exports performance? Please select 1 if you think it is very unimportant, 2 unimportant, 3 neither important nor unimportant, 4 important and 5 very important.
On the whole, respondents placed slightly higher importance on policies and conditions in export markets in determining export performance. However, there was one important exception to this – Southeast Asians thought that domestic conditions were a more important factor. This finding is further reflected in other sections of the survey. When asked if they thought that the benefits of trade had been limited due to supply side factors, Southeast Asia was the one sub-region that agreed with the proposition. This indicates an important agenda ahead for the region as a whole to address those supply side constraints if the region is to meet its goals of economic integration.
Policy Community Bullish on Trade
Expectations for export growth over the next 12 months broadly echo the forecast, with export growth more or less the same as it has been for the past few years (Figure 4). Respondents from Pacific South America were the most pessimistic, with 46 percent expecting weaker export growth. Interestingly, respondents from North America were the most bullish, with 45 percent expecting stronger export growth.
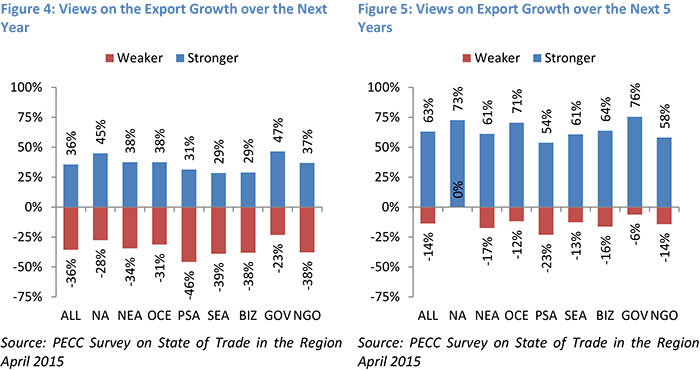
However, looking further ahead to the next 5 years (Figure 5), there was a widely held view that the export sector will bounce back, with 63 percent of all respondents expecting stronger growth compared to just 14 percent who expected weaker growth. Again, North Americans were the most optimistic, with 73 percent expecting stronger export growth.
Has Trade Reached a Peak?
Asia-Pacific opinion-leaders’ bullishness on trade contradicts a major talking point among trade policy experts that trade has reached a peak. As suggested earlier, trade growth is well below the levels seen over the past two decades and is growing more or less in step with the broader economy although the most recent data suggests that trade growth has indeed flattened and is now less responsive to changes in income. However, a look at the data over the longer term suggests the need for caution before reaching the conclusion that this is due more to structural rather than cyclical factors. As the survey results suggest, the Asia-Pacific policy community expects trade to bounce back once the global economy fully recovers from the post-GFC hangover.
When that happens remains to be seen. No doubt there are important structural changes in major economies that might support the argument that trade has indeed reached a peak in terms of its dynamism in relation to growth. One such argument is that the boost to trade from the introduction of millions of new workers and consumers into the global economy is over. While some of the new players in the global economy have probably peaked in terms of their contribution to the growth of trade, there are many more who could yet add to the global workforce. Indeed, shifts in comparative advantage that will occur as incomes in economies rapidly integrating into global value chains rise, imply that some lower value-added tasks should move to locations with lower costs. This is not a peak but a shift.
Another critical factor to weigh in this equation is the impact of the ‘creeping protectionism’ we have witnessed since the Great Recession. While wholesale beggar-thy-neighbor tariff wars were avoided, evidence from both the WTO and unofficial monitors such as the Global Trade Alert suggest that protectionism is on the rise. These are not necessarily in the form of tariffs, but manifested through other more subtle measures – likely those that impact sophisticated value-chains. As suggested by the PECC survey, the most important seem to be regulations affecting the service sector and restrictions on investment.
The challenge ahead is that while tariffs have come down significantly in the region, there remain significant non-tariff barriers including those that affect the service sector and investment. While it is up to respective governments to decide whether or not they wish to reduce these barriers, these are the exact type of barriers that are likely to impede an economy’s participation in global value chains and prevent them from benefiting from the integration process.
Role of Trade in Growth
More specifically, the question should be the extent to which the export sector will be a driver of growth over the coming years. That exports would not continue in the same role that they did in driving growth in the pre-Global Financial Crisis period was one of the assumptions made in setting out a new growth strategy for the region.
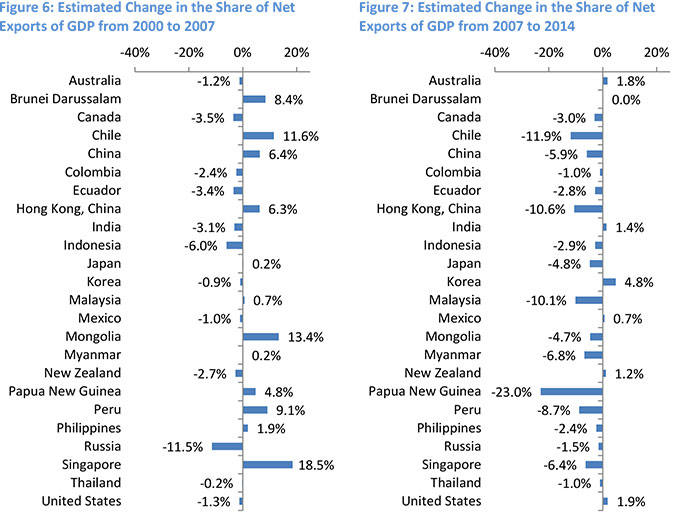
Figures 6 and 7 show the changes that have been taking place in the share of net exports in total GDP. Figure 6 shows the change that took place between 2000 and 2007 and Figure 7 shows the estimated change that took place between 2007 and 2014.
The period 2000 to 2007 was one during which the external sector contributed significantly to the growth of a number of regional economies. For China, for example, the share of net exports went from about 2.4 percent of the economy to 8.8 percent – a swing of 6.4 percentage points. For the US economy, the external sector was a net drag on growth. In 2000, net exports account for - 3.7 percent of the economy. By 2007, this had gone up to about - 5 percent of the overall economy. This was the period during which the US current account deficit had peaked at about 6 percent of GDP.
This period also coincides with the upper end of the commodity super cycle during which very strong demand from emerging economies, especially China, led to very strong export growth from commodities exporters. For example, in Chile, net exports jumped from 1.8 percent of GDP in 2000 to 13.4 percent in 2007.
Based on the IMF’s forecasts for economic growth, it is clear from Figure 7 above that for many of the region’s economies, the role that net exports plays in driving growth is likely to continue to diminish for many economies.
One of the key assumptions in this forecast is that China will succeed in its objective to increase the share of consumption in the economy. The assumption here is that the share of consumption will rise from about 37 percent of GDP this year to about 40 percent in 2020. That assumes annualized growth in consumption of about 7.9 percent over the next 5 years, at the same time the growth rate of investment is expected to slow to around 4.9 percent.
This situation contrasts strongly with the perception of the policy community which expects export performance to recover over the next 5 years.
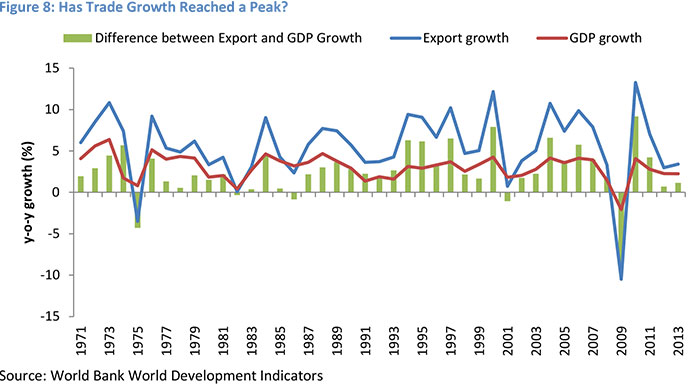
Over the course of the past 45 years there are several moments at which trade slowed significantly and grew only marginally faster than the broader economy (Figure 8). Even though exports grew at roughly twice the pace of the broader economy from 1970 to 1974, it came to a stunning halt in 1975 as the global economy slowed down as a result of the oil crisis. The following decade from 1975 to 1986 saw exports growing at an average of just 1 percentage point above GDP growth. From 1986 till the dot-com bust of 2001, exports grew at about 3.8 percentage points higher than GDP. Even including the Great Recession the 2000s saw exports growing at about 2.4 percentage points higher than GDP. Today, that differential is closer to 1.5 percentage point.
One observation is that periods of low overall growth for the world economy tend to be accompanied by slower export growth – and that the elasticity of export growth with respect to the growth of the overall economy tends to go down during lower growth periods.
This is not to say that there are not significant structural changes taking place within the global economy. Prior to the GFC there was much talk of imbalances in the global economy, with some economies overly reliant on consumption to drive growth, others were too dependent on investment and others on net exports. In dealing with the crisis, one of the key concerns has been the need to ‘rebalance’ aggregate demand across the region and indeed the world economy.
Rebalancing has been interpreted to mean different things. In this context it means avoiding the types of domestic internal imbalances such as over-consumption or over-investment that led to international imbalances in trade and capital flows. A task force established by PECC in response to the crisis suggested that the arithmetic of rebalancing is favorable because imbalances that exert great stress on global financial relations are relatively small compared to broad categories of domestic expenditures in large economies. But achieving solid, balanced growth will require economies to exit their stimulus programs and to adopt complex and varied structural reforms. These will be difficult to implement technically and politically.
One problem in analyzing the extent of rebalancing taking place is that even some 6 years after the depth of the crisis, significant stimulus remains in play distorting the picture even further. Indeed, interest rates remain exceptionally low and liquidity in capital markets very high. Even though the US has announced an end to its third round of quantitative easing, the EU and Japan still have highly accommodative monetary stances in support of aggregate demand.
Risks to Trade
| Question: Please select the top five risks to trade growth for your economy over the next 2-3 years. |
Question: If you thought that economic conditions in major export markets were a risk to growth, which of the following markets are you most concerned about? |
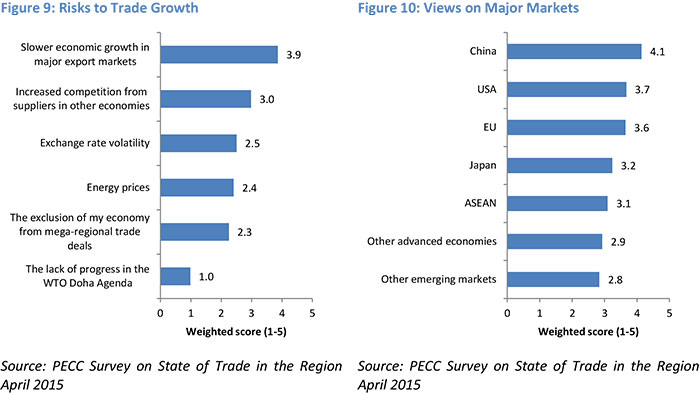
Slower economic growth in major export markets was perceived as by far the highest risk to trade growth, followed by competition from suppliers in other economies and exchange rate volatility (Figure 9). More systemic issues such as an economy’s exclusion from trade deals and lack of progress in the WTO Doha Agenda were rated as much lower risks.
Close to 96 percent of respondents selected slower growth as a major risk to export growth for their economies. By far, respondents were most concerned about China, followed by the US, and then the EU (Figure 10). There was little difference among sub-regions on their concerns, with respondents from Oceania and Northeast Asia expressing the most concern about conditions in China. This finding reflects a concern among regional policy experts on the Chinese economy over the past few years. This reflects China’s importance as a trade partner for many regional economies as well as the actual slowing down taking place in the world’s second largest economy.
Oil: Slippery Business
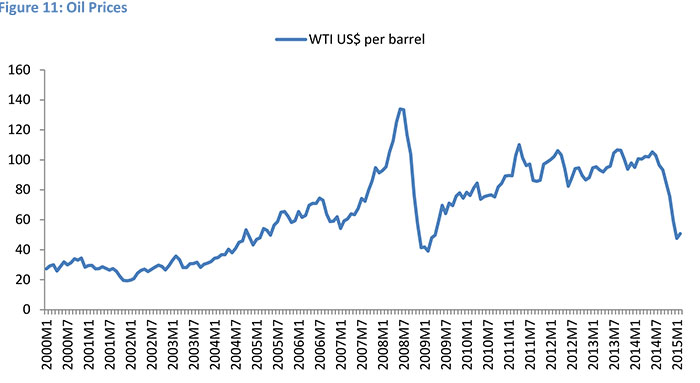
Surprisingly, energy prices were not scored that highly as a risk. Since reaching its most recent peak of close to US$110 per barrel in September 2013 (Figure 11), the price of oil has now dropped by more than 50 percent to around US$50. The last time prices reached this low was in 2009 during the depths of the Global Financial Crisis when demand for energy plummeted along with just about everything else.
This time around the global economy is not in the depths of a recession, but a combination of demand and supply side factors have pushed prices down. The impact on global trade is likely to be considerable, given that energy is one of the most traded products.
One of the critical factors has been on the supply side with North America, particularly US shale products, adding to global energy production while traditional petroleum exporters have maintained production levels. On the demand side, continued lackluster growth in the European Union and a lower trajectory of growth for China need to be considered against the somewhat halting recovery in the US economy.
A key question is the extent to which the drop in energy prices is likely to be sustained. Lower oil prices have caused a number of energy extraction projects to be postponed or cancelled outright – some estimates are that this could amount to as much as US$1 trillion in capital funding.2 Some specific examples of postponed projects include the development of the Corner field development at the Kai Kos Dehseh oil sands project in Alberta, Canada and the Petronas-led Pacific NorthWest LNG terminal proposed for Lelu Island.
These postponements have specific consequences for the Asian market, as the projects were intended to be part of a US$36-billion undertaking to ship LNG from the West Coast to Asia, with the long term prospect of developing transpacific energy trade.
Impediments to Trade
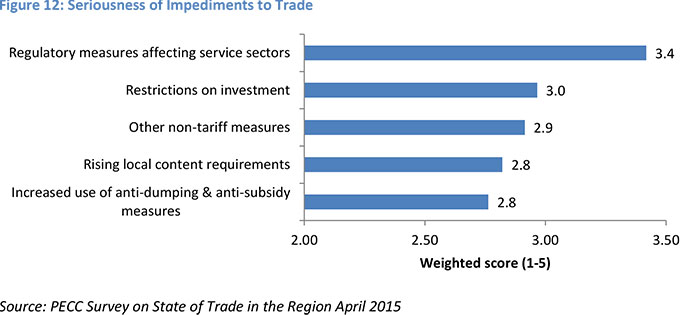
Regulatory measures affecting service sectors such as telecoms, finance and transport were ranked as the top trade impediment, followed by restrictions on investment and then other non-tariff measures (Figure 12). Concerns regarding impediments to services reflect their growing importance of services in the Asia-Pacific trade. Work to understand global value chains is revealing the importance in production across the board – whether in light manufacturing such as computers, or mining or even agriculture.
Question: Please rank how seriously these trade impediments affect exports from your economy in foreign markets
Importantly, this was not a sentiment of respondents from advanced economies alone; it was rated as the most serious impediment to exports by respondents from all sub-regions with the exception of Pacific South America where it was marginally the second most important serious impediment to exports.
Exports of commercial services have been growing at a considerable pace. In 1989, APEC’s exports of commercial services were about US$254 billion. By 2013, they were US$1.8 trillion – growing at an annualized rate of 8.6 percent, slightly higher than the growth of merchandise goods.
| Question: Please rank how seriously these trade impediments affect exports from your economy in foreign markets (Score 1-5) |
Question: Please rank how seriously these trade impediments affect exports from your economy in foreign markets (Score 1-5) |
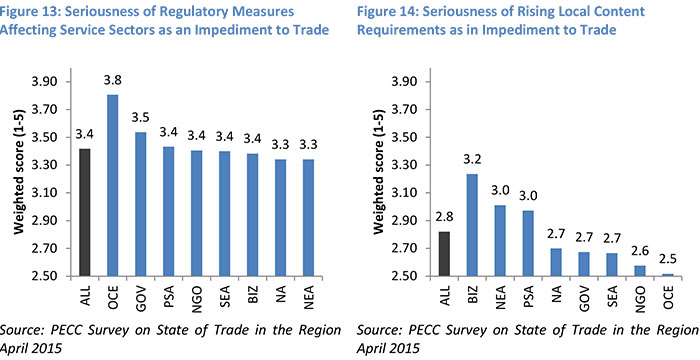
Figure 13 indicates that there was broad agreement regarding the seriousness of regulations affecting services. However, as Figure 14 reveals, there was considerable divergence between respondents from business and government on local content requirements (LCRs). While respondents from government ranked LCRs as the least serious impediment, business respondents ranked it the second most important.
This finding highlights the need for further understanding on the role that local content requirements play as an impediment to trade among government officials. Indeed, the relatively low importance that LCRs are given by sub-regions reflects an across-the-board lack of understanding of this issue – at least from the business perspective.
Trade and Inclusive Growth
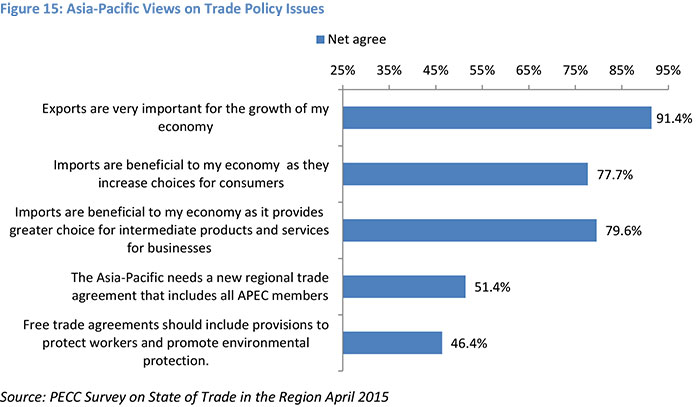
The perception of trade in the Asia-Pacific policy community remains overwhelmingly positive. Close to 94 percent of respondents agreed with the statement that exports are very important for economic growth, and only 2.5 percent disagreed (Figure 15).
That exports were seen in a positive light should not be surprising. One important point, however, was that positive views were also expressed about imports, with 81 percent of respondents agreeing that imports are beneficial because they increase consumer choice. Almost the same percentage agreed that imports are beneficial because they provide greater choice for intermediate products and services for businesses; i.e. they are important as enablers of participation in global value chains.
Question: Please state your level of agreement with respect to the following statements. Chart shows ‘net agree’ – the number of those who agreed with the statement minus those who disagreed
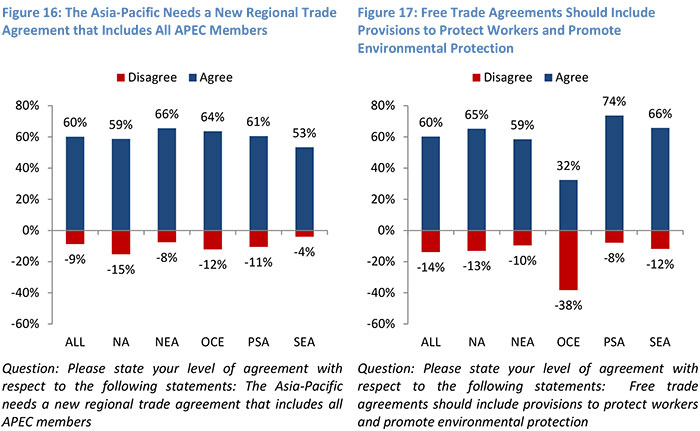
One of the controversial points in the current trade debate is whether or not free trade agreements should include provisions that protect workers and promote environmental protection. Some templates, notably agreements signed by the US, tend to include such provisions, while those originating in East Asia do not include them. There were some surprising differences of opinion on this issue. For example, 65 percent of North American respondents agreed with the proposition as did 66 percent of those from Southeast Asia. However, respondents from Oceania tended to disagree with the idea, with only 32 percent agreeing and 38 percent disagreeing.
A New Asia-Pacific Trade Agreement?
The regional policy community was broadly in agreement with the idea that a new trade deal that includes all APEC members was needed. The most enthusiastic about this idea were respondents from Northeast Asia – perhaps not surprisingly, as neither the TPP nor the RCEP includes three major Northeast Asian economies: Hong Kong-China, Chinese Taipei, and Russia.
Limits on the Benefits of Trade
In almost a mirror image of the positive statements about trade, respondents tended to disagree with statements on the potential harmful impacts of trade.
There was broad disagreement with the proposition that trade harms economies because it creates unemployment (Figure 18). Eighty percent of respondents disagreed and only 9 percent agreed. Interestingly, respondents from Northeast Asia tended to have more sympathy with the notion, with close to 20 percent agreeing with the proposition, compared to just 4 percent in Southeast Asia.
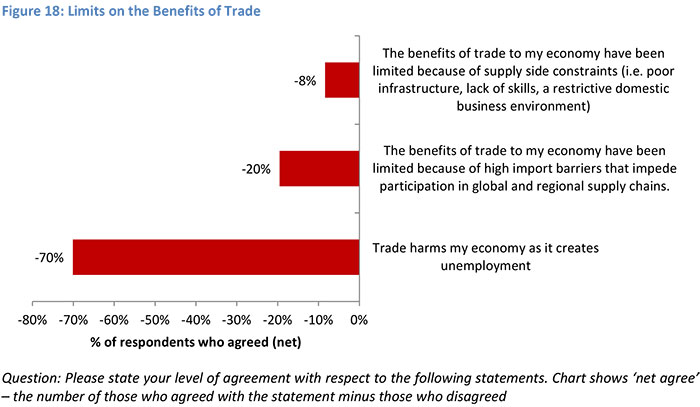
One important finding echoes a similar question asked in a PECC survey a few years ago: ‘The benefits of trade to my economy have been limited because of supply side constraints.’ While Asia-Pacific-wide only 37 percent of respondents agreed with the statement, 68 percent of those from Pacific South America agreed, as did 49 percent of those from Southeast Asia (Figure 19).
This highlights the need, at least for those sub-regions, to address those supply-side constraints in order for those economies to really benefit from regional economic integration. Some of this is being done through the ASEAN Masterplan for Connectivity, and in the case of the broader region, through APEC’s own Connectivity Blueprint.
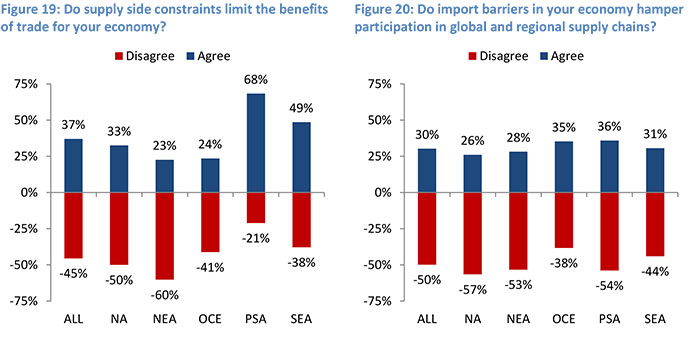
Perceptions on the role that import barriers play in limiting participation in GVCs and therefore the benefits to the broader economy, were fairly evenly spread across the Asia-Pacific’s sub-regions (Figure 20).
Priority Actions for Achieving an FTAAP
Although 60 percent of respondents agreed that the region needs a new agreement that includes all APEC members and only 9 percent disagreed, there remains little certainty as to how to go about achieving this. This is despite the fact that the FTAAP has been a major agenda item for APEC since 2004, when it was raised as a prospect by the APEC Business Advisory Council (ABAC). Last year in Beijing, APEC leaders agreed to a Roadmap for APEC’s Contribution to the Realization of the FTAAP. Elements of the APEC work suggested in the Roadmap include:
- providing an analysis of potential economic and social benefits and costs;
- performing a stocktake of RTAs/FTAs in force in the region;
- analyzing the various pathways towards the FTAAP;
- assessing impacts of the “spaghetti bowl” phenomenon on economies;
- identifying trade and investment barriers; and
- identifying challenges economies may face in realizing the FTAAP.
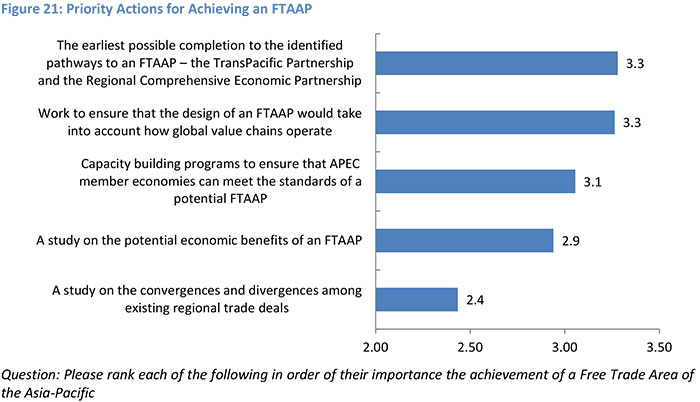
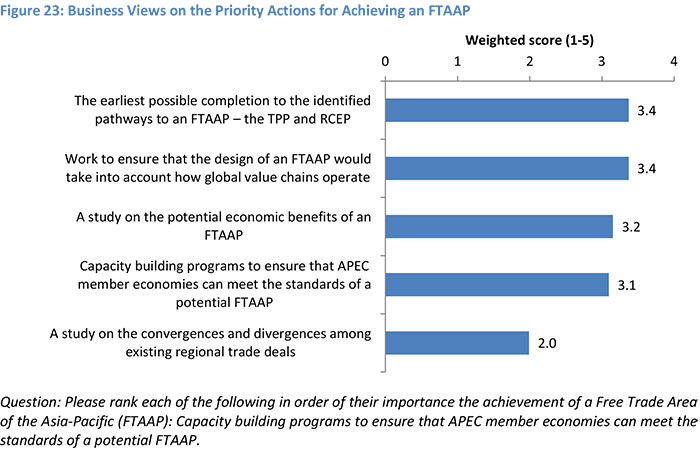
Of the list of actions that could be taken by APEC economies to achieve an FTAAP, the most important was the earliest possible completion of its identified pathways – i.e. the Trans-Pacific Partnership and the Regional Comprehensive Economic Partnership (Figure 21). Since neither has been completed, there remains a considerable amount of uncertainty over the FTAAP. The 2014 State of the Region report considered various options – an expanded TPP, an expanded RCEP, or a type of umbrella agreement.
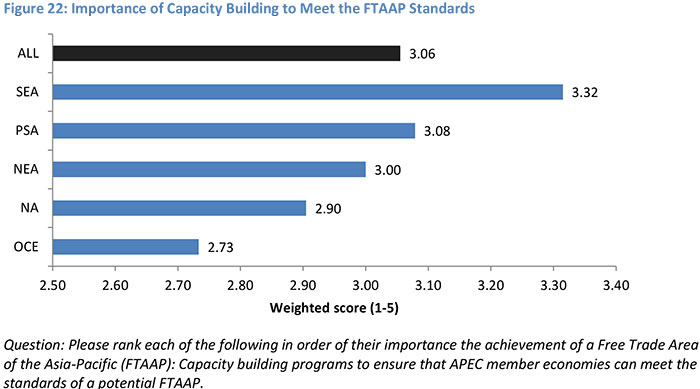
While the completion of the pathways was overall rated as the most important step towards achieving an FTAAP, not all sub-regions shared this sentiment. For example, among the Southeast Asian policy community, the most important action was capacity building to ensure that APEC member economies can meet the standards of a potential FTAAP (Figure 22). Perhaps for them, anything less would be putting the cart before the horse – should they be unable to meet the standard, other actions would be superfluous.
Beyond the current negotiations on the TPP and RCEP, over which APEC as an institution has little sway, the type of work that the policy community rated as important was to ensure that the design of the FTAAP takes into account how global value chains operate. Indeed, respondents from business saw this as just as important as the completion of the identified pathways (Figures 21 and 23).
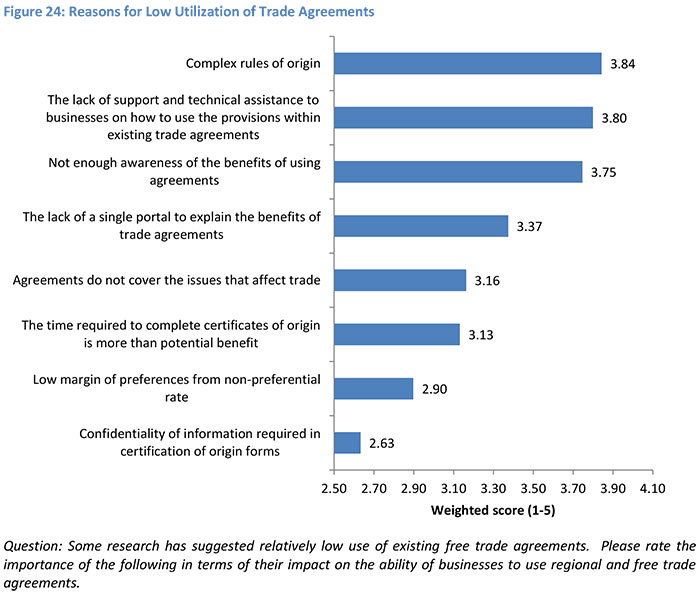
Utilization of Trade Agreements
Somewhat related to the importance of designing an FTAAP that takes into account how GVCs operate is whether FTAs are worth the time spent on them. Estimates suggest that usage of preferences granted in FTAs is around 22 percent3 (Figure 24). Among possible eight reasons why FTAs are not widely used, complex rules of origin was ranked as the most important at 3.8 out of 5, followed by a lack of assistance to firms, also at 3.8, and then a lack of awareness about the benefits of the agreements.
Further analysis of the utilization of rules of origin suggest some caution. While some rules are simple at face value, such as the ASEAN 40 percent regional value content rule (RVC 40), this was overhauled in 2003. An alternative change in tariff classification rule (CTC) “applicable to all products which cannot comply with the 40% local/ASEAN content requirement” was introduced in four sectors (wheat flour, wood-based products, aluminum products, and iron and steel), and later extended to ASEAN priority sectors.
These findings point to several potential areas of fruitful work for APEC. Numerous studies and surveys have continually underscored the problem that firms, especially SMEs, face in using the preferential tariffs available through trade deals. APEC’s strong engagement with business gives it an advantage in this field. Furthermore, given the prevalence of value chains in regional trade, how the rules of origin impact GVC participation would be another area upon which to focus – something highlighted as a priority for APEC to address. The lack of support and lack of awareness should be troubling, given the amount of time spent negotiating deals.
The state of trade in the Asia-Pacific remains largely positive. However, slowing trade growth is indicative of potential concerns that regional economies are not adjusting quickly enough to the evolution of global value chains. Indeed, while the regional policy community spends a large amount of time on different integration processes, the region would likely be best served by supporting more inclusive processes – whether multilaterally, or even the mega-regionals.
The low utilization rates of trade agreements – primarily due to complexity in compliance with rules, as well as low awareness levels, should give pause on the next steps taken in the integration process. Moreover, since the policy community sees the completion of the TPP and RCEP as the most important steps the region can take to achieve an FTAAP – something those outside the negotiations can do little about – the groundwork can be laid for useful policy-making by understanding the policy imperatives of global value chains. Indeed, since formal trade negotiations continue to be held up by the trade policy issues of the 20th, if not the 19th century, there is ample space for innovative approaches to economic integration – something APEC is ideally designed for.
APEC’s continuing focus on economic integration supported by capacity building to address supply side constraints – whether through improving education policy or better infrastructure, has the potential to ensure that the benefits of trade are more broadly shared throughout the region’s economies.