Section 1 - Status of Asia-Pacific energy use and energy trade
Energy use in Asia-Pacific economies
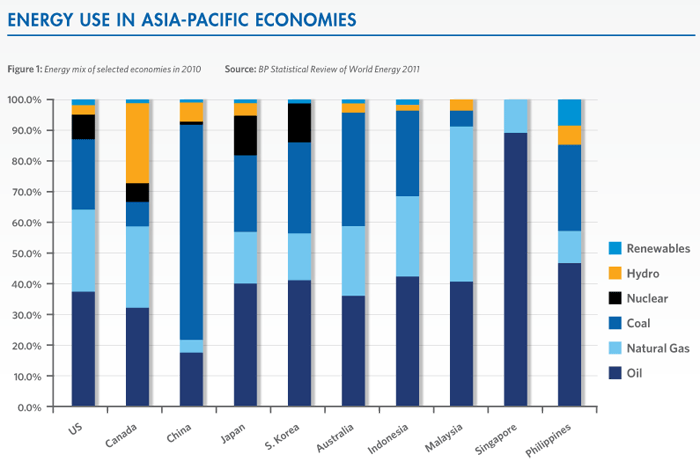
Figure 1 illustrates the mix of energy use in some of the major economies in the Asia-Pacific region. The use of fossil fuels is predominant in the Asia-Pacific region, with hydro-electricity, renewables and nuclear energy typically accounting for less than 20% of overall energy use. Oil is the fuel of choice in most Asia-Pacific economies (the key exception is China which relies heavily on coal), accounting for 30-40% or more of energy needs in most economies. Coal constitutes more than 20% of overall energy use in the majority of Asia-Pacific economies, while natural gas typically accounts for 10-20% of the energy mix (China is again the exception, with only 4% of its energy needs met by natural gas).
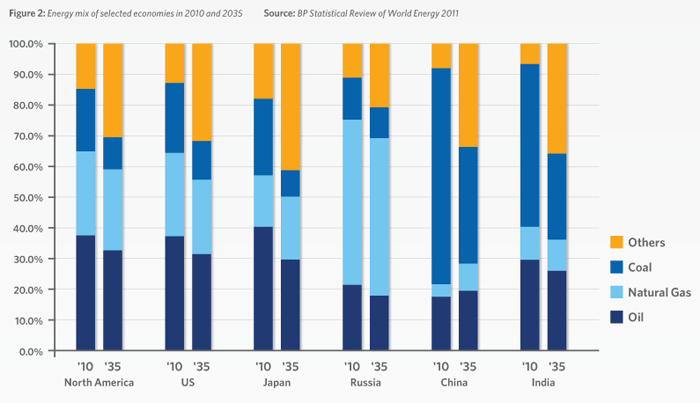
The basic patterns of energy use in the Asia-Pacific region are unlikely to change materially in the foreseeable future. Figure 2 illustrates how the energy mix in Asia-Pacific economies (including Russia) can be expected to change between now and 2035, under IEA’s New Policies Scenario. In this scenario, the use of non-fossil fuel sources of energy (nuclear, hydro-electricity and renewables) increases appreciably in each of the major economies. Nevertheless, fossil fuels continue to dominate the energy mix, accounting for 60-80% of the energy mix in most economies. The share of coal, in particular, as well as oil decreases in almost all countries- particularly dramatic is the reduction in the share of coal in China’s energy mix from around 70% in 2010 to 38% in 2035. By contrast, natural gas shares remain relatively stable, reflecting its status as a cleaner fuel relative to oil and coal.
The significance of energy trade to the Asia-Pacific economies is underscored by the fact that much of the fossil fuel needs of Asia are met by imports1. In particular, 94.3% of the region’s oil needs are met by imports. Natural gas imports are fairly significant, accounting for 37.2% of total natural gas use, while coal imports are comparatively less significant, only accounting for 14.9% of total coal use. Aggregating across all 3 fuels, 41.2% of fossil fuel needs of the Asian economies are met from imports.
Status of Asia-Pacific energy trade
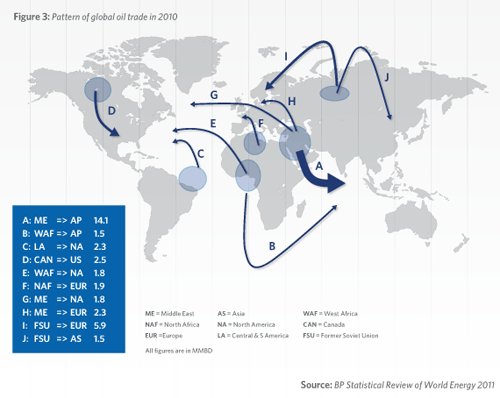
To place Asia-Pacific energy trade (specifically, fossil fuel energy imports of Asian economies) in context, it is useful to begin by looking at patterns of global energy trade. Figure 3 demonstrates the major interregional oil flows in the global economy in 2010. By far the largest single flow of crude oil trade is from the Middle East (ME) to Asia (AS), of around 14.1 million MMBD; this reflects both the large base of demand in Asia and its limited domestic crudes. The only other significant inter-regional flows of crude into Asia are from West Africa (WAF) and from the Former Soviet Union (FSU), approximating 1.5 MMBD each. The North American market not only produces significant proportions of its own crude requirements, but also has access to short haul and long haul crudes from Latin and Central America (LA, 2.3 MMBD), Europe (EUR, 1.0 MMBD, not shown on the map), West Africa (1.8 MMBD) as well as the Middle East (1.8 MMBD). Europe is a recipient of FSU crude (5.9 MMBD), North African crude (1.9 MMBD) and ME crude (2.3 MMBD), apart from being an exporter of crude to other regions.
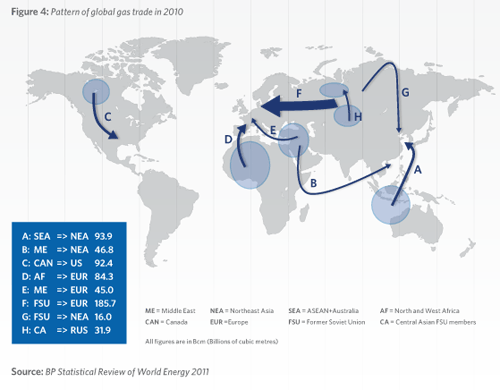
Figure 4 illustrates the major flows of natural gas (both pipeline and LNG) in the world in 2010. In contrast to oil, the global gas market is regionally segmented to a significant degree, and intra-regional flows of gas are important, with gas flows from Canada to US (92.4 Bcm), from Southeast Asia and Australia (SEA) to Northeast Asia (93.9 Bcm) and from Central Asia to Russia (31.9 Bcm). The largest flow of gas is from Russia and the Central Asian FSU countries to Europe (185.7 Bcm), though Europe also receives significant gas imports from Africa (84.3 Bcm) and the Middle East (45.0 Bcm). In addition to gas imports from SEA, Northeast Asia receives imports from the Middle East (46.8 Bcm) and, increasingly, from the Former Soviet Union as well (16.0 Bcm). Note that North and South America are effectively ‘gas islands’ isolated from the rest of the world, with few significant transpacific or transatlantic gas flows.
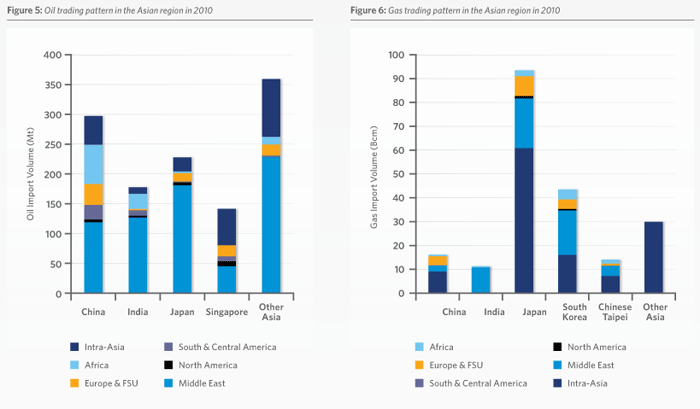
Figure 5 shows the areas from which major Asian oil importers obtain their product. The Middle East is by far the biggest source of oil imports, but there are also significant intra-regional flows, while China and India import some of their oil from Africa and China also imports oil from South and Central America.
Figure 6 illustrates where Asian economies source their gas imports. Intra-regional gas flows are the most important, with gas flowing from the Southeast Asia belt (Indonesia, Malaysia, Brunei, and Australia) to Northeast Asia (China, Japan, South Korea). The Middle East is the only other significant exporter into Asia, accounting for almost all of India’s gas imports and a significant proportion of the gas imports of South Korea and, to a lesser extent, Japan.
The above figures demonstrate that transpacific energy trade (i.e. trade between North America and the Asian economies) is comparatively insignificant relative to both global energy trade and energy imports into the Asian region. Transpacific oil and natural gas trade are particularly limited in their scale, respectively accounting for only 1.2% of global oil trade and 0.3% of global natural gas trade in 2010 (BP Statistical review of World Energy, June 2011). Transpacific coal trade is relatively more significant in global coal trade, but even so, accounts for only 4.6% of overall trade in coal. Aggregating across all 3 fuels, transpacific energy trade only accounts for 1.4% of global energy trade, more than twothirds of which is from North America to Asia.
<< Previous
Next >>