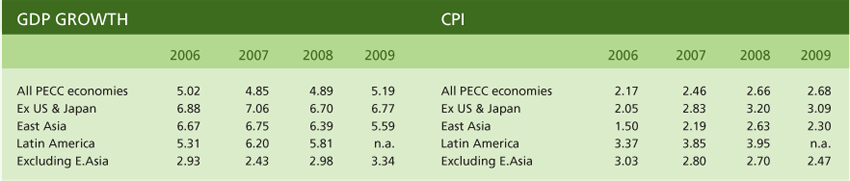
Annex 1: Economic Outlook Data Tables
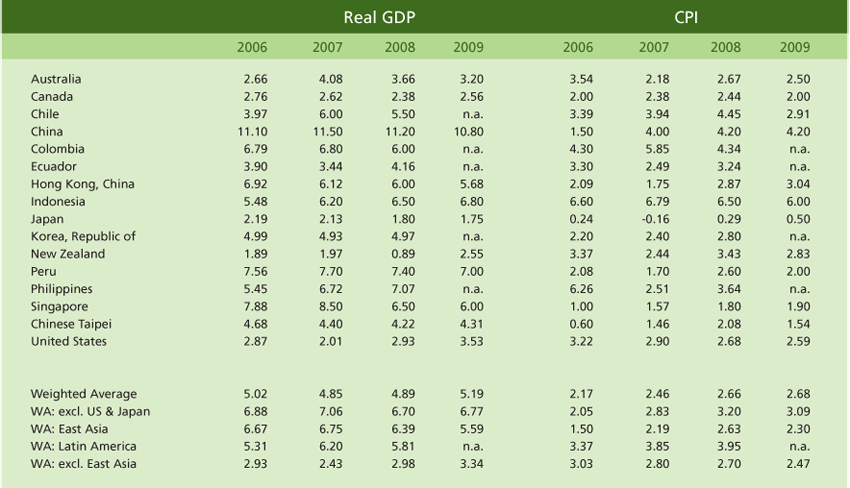
Note: National currency based. The weighted average is based on the respective economies' 2004-2006 total trade merchandise (see Appendix Table 8).
Source: PEO Forecasters.
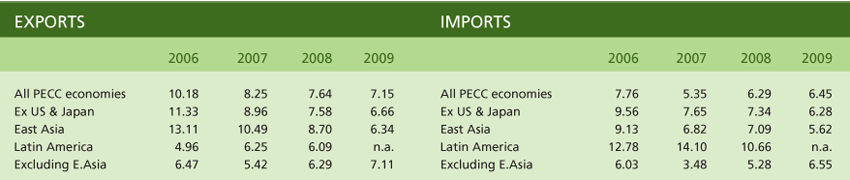
T2: Real export and import growth for PEO economies, 2006-2009 (%)
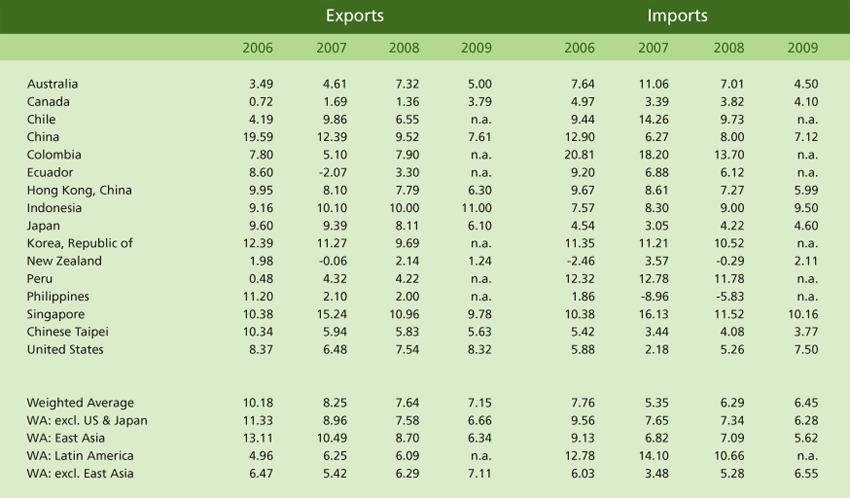
Note: Export/Imports of goods and services. National currency based. The weighted average is based on the respective economies' 2004-2006 total trade merchandise (see Appendix Table 8).
Source: PEO Forecasters.
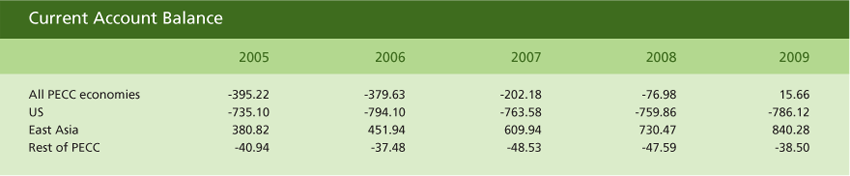
T3: Current account of the balance of payments for the PECC economies, 2005-2009 (US$B and % of GDP)
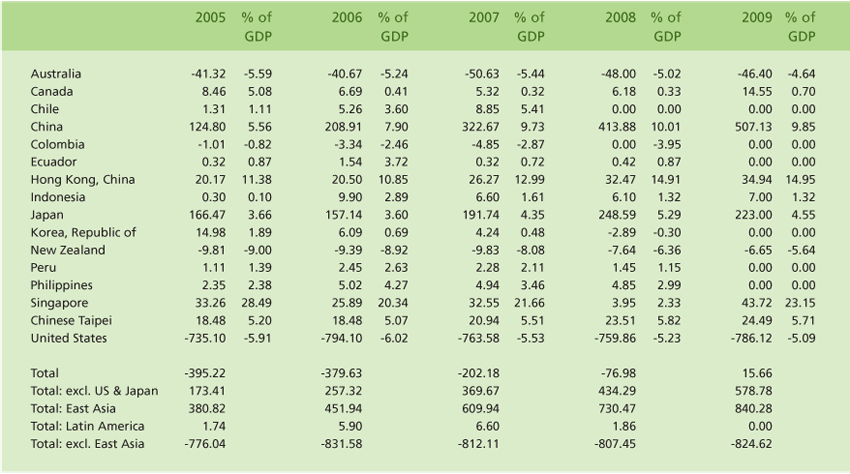
Source: PEO forecasters.
T4: Forecast of contributions to real GDP/GNP growth rate for PECC economies, 2008-2009 (% per year)
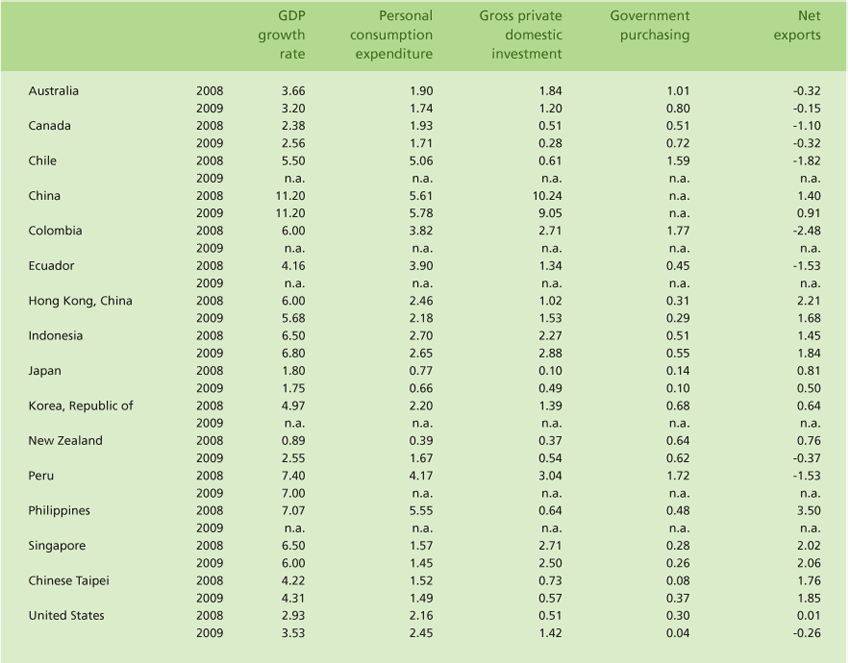
Note: National currency based. Components of GDP/GNP do not add up to overall growth rates for some economies, due to statistical discrepancies.
Source: PEO Forecasters.
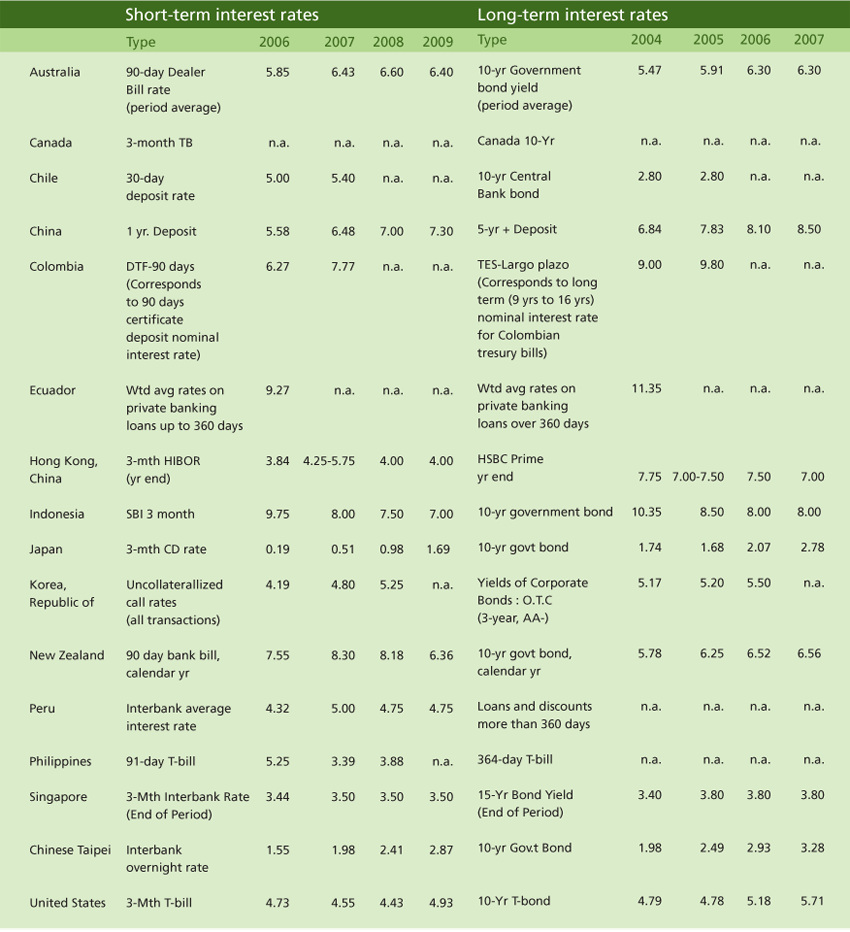
T5: Actual and forecast levels of short-term, long-term interest rates for PECC economies, 2006-2009 (%)
T6: Exchange Rates, 2006-2009 (Local Currency Per US$)
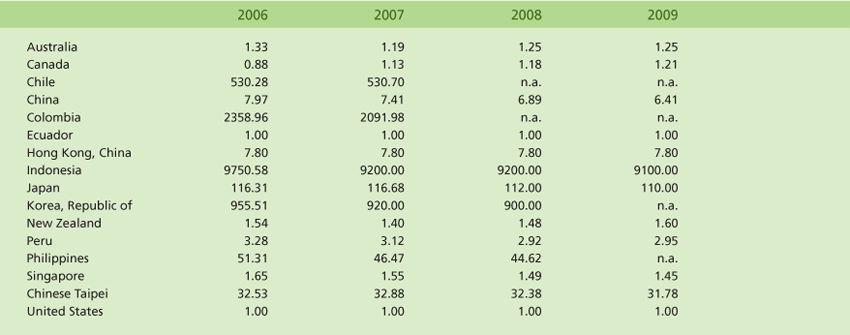
Source: PEO Forecasters.
T7: GDP Deflator Index
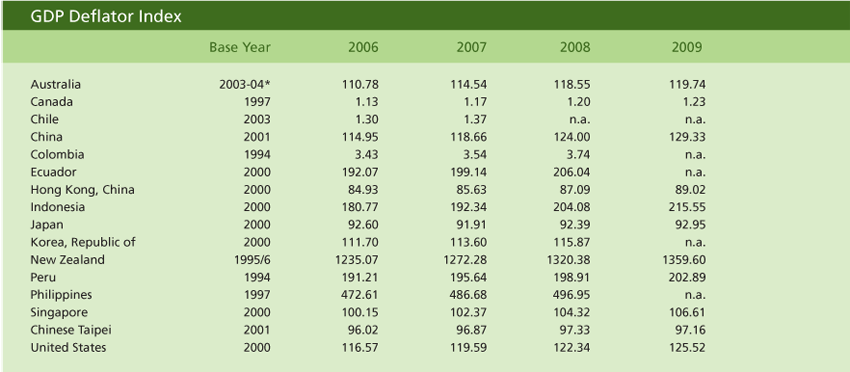
Note: Base year = 100 unless otherwise noted.
* Australian financial year, covering Q3-Q4 of 2003 and Q1-Q2 of 2004.
Source: PEO Forecasters.
T8: Trade Weights, 2004-2006 average (%)
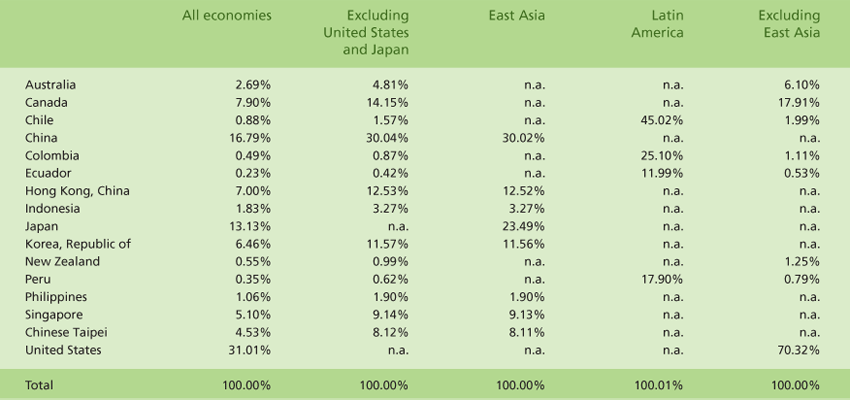
Source: Compiled from WTO Statistics. Trade Weights is the total merchandise (imports and exports) of each economy over the total trade merchandise of PEO economies.
T9: Asia Pacific Carbon Dioxide Emissions
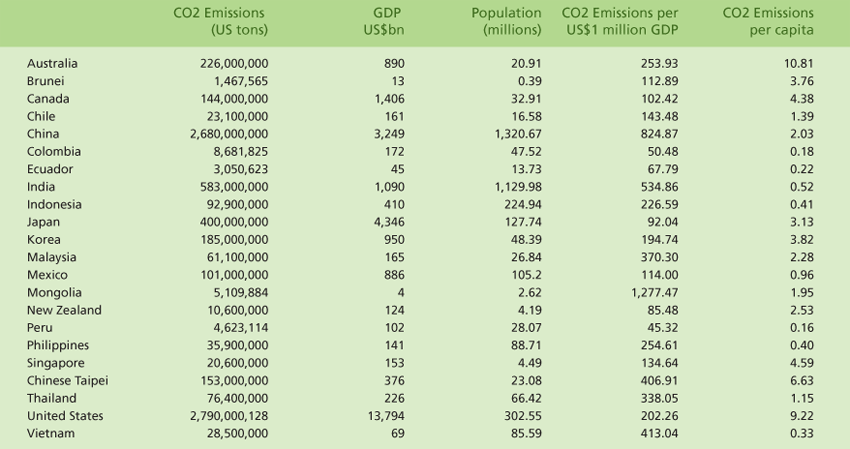
Source: CO2 Emissions Data from CARMA (www.carma.org), Population and GDP data from IMF World Economic Outlook (October 2007 release)
<< Previous
Next >>