Under the Paris Agreement, the 194 Parties to the United Nations Framework Convention on Climate Change (UNFCCC) committed to shifting the world’s course towards “sustainable development” and “holding the increase in the global average temperature to well below 2°C above pre-industrial levels and pursuing efforts to limit the temperature increase to 1.5°C above pre-industrial levels.”
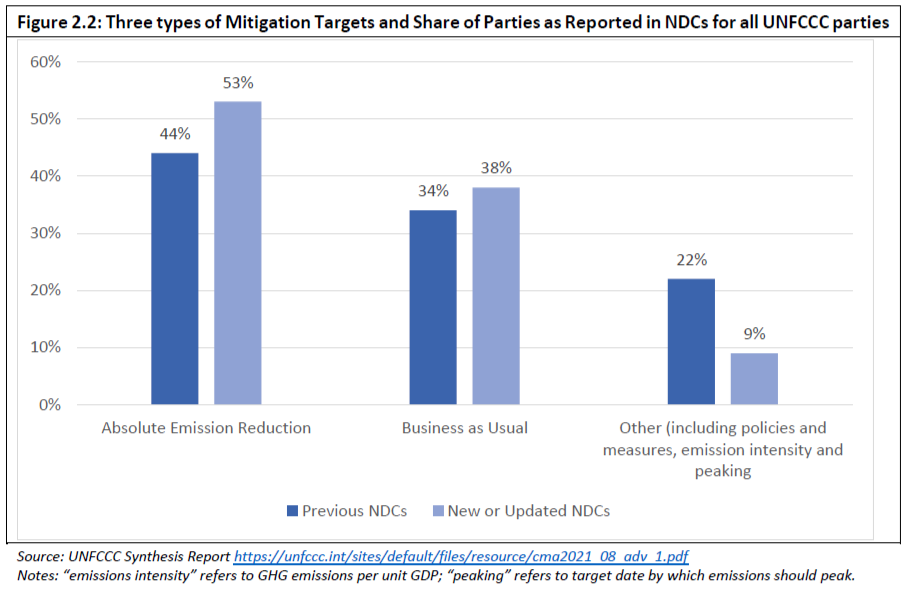
Parties to the upcoming UNFCCC COP26 summit in November have committed to a range of GHG emission reduction targets. National Determined Commitments (NDCs) presented by Parties included absolute reductions of emissions from a base year, reductions from a hypothetical “business as usual” (BAU) trajectory over the 2020 – 2030 period or reductions in emissions intensity per unit of GDP and “other policies and measures”. The most common emission reduction target (43%) was that expressed as a planned reduction from a projected “business as usual” outcome. Absolute emission reductions relative to a base or reference year or absolute quantified reductions without reference to any base year was the next most popular (35%). Just over a fifth of all NDCs chose other types of targets including reductions in emission intensity, target dates for planned peak emissions, and a range of other policies and measures or a combination of these.
Promoting renewable energy generation were most frequently mentioned by Parties, followed by measures for energy efficiency improvement. Almost all Parties outlined mitigation targets in specific priority areas, such as energy supply, transport, buildings, industry, agriculture, LULUCF and waste. In comparison with previous NDCs, new or updated NDCs communicated an increased focus on adaptation planning. Adaptation priorities for most Parties, according to the NDCs, focus on food security and production; terrestrial and wetland ecosystems; human health; freshwater resources; key economic sectors and services; disaster risk management and early warning; human habitats and urban areas; coastal areas and sea level rise; ocean ecosystems; and livelihoods and poverty.
Most NDCs indicated support for renewable sources, particularly for solar and wind technologies, in the electricity sector; promotion of electric vehicles in the road transport sector; and enhancement of energy efficiency across the industry, residential and other sectors. NDCs commonly identified markets and market-based incentives (MBIs) such as emission taxes or “cap-and-trade” of emission certificates as a means of efficient decarbonization by putting a price on emissions.
Turning to actual government climate-related expenditures over the past several years (2011 – 2018), the most striking feature is the overwhelming amount spent on just two renewable technologies -- solar and wind energy. The other striking feature of the spending pattern is that climate adaptation only accounts for 5% of total government climate-related expenditure. Empirical evidence suggests that by overemphasizing climate mitigation efforts, the UNFCCC and COP agreements such as the Kyoto Protocol and the Paris Agreement have led to a bias against investment in climate adaptation. This suggests the importance of policy cooperation among APEC member economies designed to bring about greater attention to climate adaptation efforts.
Advanced APEC member economies such as Australia, Japan, New Zealand and the US have had relatively rapid growth in renewable energy as a share of total power generation which is in excess of the world average in 2020. Some developing APEC members such as Mexico, Chile, Malaysia, Thailand, and Vietnam exhibited extremely high rates of growth in both wind and solar power generation, significantly in excess of the global average growth rate in 2019 due mainly to the small base that renewable energy had in total power demand in 2018. Over the decade, despite the high percentage increase in renewable power generation in the developing APEC member economies, incremental power demand was overwhelmingly met by fossil fuels (in excess of 80%). Meeting the development and poverty alleviation objectives of these economies - where per capita electricity consumption rates are low and universal access to grid electricity is still lacking -- are policy priorities that are not likely to be compromised at the negotiations at COP26.
In formulating and implementing regulations to promote energy efficiency initiatives, it is critical that all such new regulations meet the tests of unbiased cost-benefit analysis. The guiding principle to policy interventions is that they must improve societal welfare. Many economies and multilateral organizations such as the Organization for Economic Co-operation and Development (OECD) and APEC have developed best practice regulatory guides. These guides highlight similar key themes: the need to clearly define the policy problem and the rationale for government intervention; consideration of a range of policy options, including a do-nothing approach; and assessing the full range of social costs and benefits of the proposed policy options.
Many APEC member economies have adopted policies such as subsidies for electric vehicles (EVs), higher taxes for fuels such as gasoline and diesel, taxes on internal combustion engine (ICE) vehicles, tax-payer funded charging stations and other policies to encourage electric vehicles (EVs). There is currently much optimism about the prospects for EVs to replace ICE vehicles in passenger transport. However, there are also more skeptical views that suggest the disadvantages of EVs such as limited driving range, long charging times and high costs will limit the uptake of EVs. If EVs constituted a significant percentage of the global vehicle fleet from its very low levels now (less than 1%), research suggests that the demand for the many mineral commodities and rare earths would reach untenable levels. Cooperation among APEC member economies to ensure transparent and adequate standards for human and labor rights and local environmental pollution controls to handle the mining and processing of such minerals and rare earths will be crucial.
The implementation of carbon capture and storage or sequestration (CCS) technology to mitigate CO2 emissions has much appeal. However, the technology for CCS is far from demonstrated commercially and there exist few projects in the world today. While the technology to achieve carbon capture and storage exists, the economics are proving prohibitive. The key hurdle is the 15–30% of energy that is consumed to capture CO2 from the power plants. Best practice methods from economies such as the US which has extensive experience in enhanced oil recovery using injected CO2 may well prove beneficial to other oil and gas producers in APEC who have the requisite geology and upstream oil and gas activity.
International enthusiasm for the “hydrogen economy” to mitigate CO2 emissions is very high and APEC member economies such as Japan and the US are leaders in R&D investments in this area. However, extracting, transporting, and using hydrogen to reduce carbon emissions costs more than the human welfare benefits predicted to accrue in the long run future. Early projects carried out by Japan to import blue and green hydrogen from the Middle East will provide its fellow APEC member economies data on the safety and economic viability of utilizing hydrogen in various end-use sectors to replace fossil fuels.
Increased ambition expected of Parties under the Paris Agreement at COP26 lies in the implementation of Article 6 of the agreement which calls for “voluntary cooperation” among Parties. Article 6 could also establish a policy foundation for international emissions trading systems, which could help lead to regional and global prices on carbon. Joint implementation of projects between advanced and emerging economies would offer the benefits of lowering costs of emission reduction since it is typically cheaper to curb emissions in emerging. It would also lead to technology transfer and financing opportunities for the developing economies that lag behind on decarbonization. Carbon market mechanisms can allow businesses to trade both carbon credits and carbon offsets within economies and across borders.
It is well established that market-based instruments have more positive effects on firm productivity than discretionary “command-and-control” mechanisms. MBIs to promote carbon pricing in the transition to low-carbon energy systems provide firms with more flexibility in meeting low-carbon goals than non-MBI approaches. Climate change policies via MBIs promote productivity gains across the economy as least productive firms drop out. The conventional role for government in skills development and re-deployment, providing information on newer technologies as a public good, improving access to finance for SMEs based on durable and credible carbon-pricing policies cannot be over-emphasized.
As of early 2021, there were 64 carbon pricing initiatives. The share of global emissions under carbon pricing is 21.5%. The carbon prices in these different initiatives range widely, from less than $1/tCO2e to over $130/tCO2e although in most cases carbon prices are relatively modest. Less than 4% of global emissions are covered by a carbon price at or above the range US$40 - 80/tCO2e – the range which the World Bank suggests is needed in 2020 and $50 – 100/tCO2e by 2030 to meet the 2°C temperature goal of the Paris Agreement. There is evidence of a growing engagement by private businesses in carbon pricing. The corporate sector is increasingly using internal benchmark carbon prices as a tool for business decision making and to identify low-carbon investment opportunities.
While participation by the private sector in using internal carbon prices to guide investments is important to promote low-carbon energy transitions, the context in which private sector participation is successful depends on government policy stability and long-term credibility. APEC member economies could play a lead role in carbon pricing by establishing region-wide carbon markets to promote emission mitigation in a market-friendly manner. Indeed, the group could do much to advocate market-based instruments over discretionary regulations and policies to achieve emission mitigation objectives in a more cost-effective manner.
There are two other dimensions regarding private sector investments in carbon emission commitments. First, many firms have made public commitments to account for their emission profiles, including those from “scopes 1, 2 and (partially) 3” which is discussed in Section 3c. Secondly, firms are under increasing oversight and pressure by financial intermediaries such as private banks and hedge funds but also by Central Banks and multilateral development and financial institutions such as the World Bank and the IMF (discussed in Section 4d and 4e).
APEC member economies could do well to liaise and adopt compatible carbon market initiatives that allow for carbon credits and offsets to support fungibility and liquidity. Aligning different carbon pricing systems once they are operational is difficult. Different carbon pricing systems and governance institutions may become too deeply entrenched for easy harmonization of rules to be achievable. In this context, the concept of carbon emission trading hubs might provide a more promising approach than “top-down” multi-lateral harmonization agreements. Regional markets with a wide range of heterogenous economies at various stages of development, such as the APEC region, would improve the efficiency and liquidity of trade in carbon certificates. Trading hubs in financial and trading centers such as Hong Kong (China) and Singapore would help in the development of regional voluntary carbon markets. These hubs would traverse the developed economies such as Australia, Canada and Australia as well as the largest developing Asian economies with low per capita emissions such as India, Indonesia and Vietnam.
Among the most important policy concerns challenging the introduction of carbon pricing around the world is the issue of “carbon leakage”. Carbon leakage occurs when differences in emission regulations across jurisdictions can lead to re-location of carbon-intensive industries away from those jurisdictions which have tighter restrictions on carbon emissions and towards those that have either laxer or non-existent emission regulations. Carbon leakage will doubtless also be a central issue at the UN’s 26th Conference of Parties (COP26) when it meets in November. Carbon trade tariffs are being proposed in a number of legislative and political forums as a means to mitigate competitiveness concerns and carbon leakage, and to help encourage jurisdictions with laxer emission regulations to adopt higher mitigation standards for energy-intensive exports. The actual design details of any particular carbon border adjustment mechanism (CBAM) legislation will determine whether such unilateral moves are WTO-compliant. The WTO arbitration and appeals process may not be able to resolve trade complaints promptly and in good order. The threat of tit-for-tat reprisals and the imposition of further trade barriers by those outside any “climate club” holds serious consequences for the outlook of the multilateral rules-based trading system. APEC member economies could constructively strive for a cooperative outcome that avoids such threats to free trade and reciprocity norms under the aegis of the WTO.
Estimates for “green finance” requirements vary widely and the investments required to support “transition” of the global energy system are immense. An agreement on climate change finance is now viewed as critical to the success of the upcoming COP26 conference to be held in Glasgow in November 2021 and the financing gap remains a key obstacle to the success of the talks.
There is a large literature on what has been broadly termed “green finance”, the respective roles and importance of public and private sectors, and the variety of financial instruments deployed. However, there is no precise and commonly accepted definition of the term. Most green finance portfolios tend to emphasize mitigation despite a recognized need to increase adaptation finance. Of the $78.9 billion in climate finance transferred by high income economies in 2018, only 21% was spent on adaptation. APEC member economies could play a strong and positive role as a group in supporting adaptation finance at the COP26 summit.
The lack of clear criteria in the classification of the activities underlying green finance and comparability across economic sectors, industries and projects increases the uncertainty associated with financing investment decisions and distorts or obviates clear policy signals. There is a critical need for harmonization of green finance standards to lower transaction costs, enhance the efficiency of financing investments which support seamless investment flows across jurisdictions, and support member economies’ climate mitigation and adaptation policies and projects. APEC member economies which overwhelmingly support SDG goals could play a role in promoting harmonized green finance standards and definitions.
The empirical evidence provides little support to suggest that ESG ratings provide adequate measures of “green finance” for climate change mitigation and adaptation efforts. APEC regional economies can play a crucial role in ensuring that ESG investments lead to real initiatives in emission mitigation and climate adaptation efforts.
The publicly articulated positions of key players from both developed and developing economies are widely divergent and fraught with tensions over a host of unresolved issues. Only eight of the G20 members have submitted significantly more ambitious climate targets. Australia, Brazil, China, India, Saudi Arabia, South Africa, and Russia, have yet to do so. The BASIC bloc of leading developing economies which comprise Brazil, South Africa, India, and China, have argued consistently that industrialized economies were able to get wealthy before carbon emission reductions were called for and that developing economies cannot be expected to make sacrifices that would put their legitimate aspirations for economic development at risk.
The largest emitters among the developing economies have signaled that the achievement of their targets has conditional elements which include access to enhanced financial resources, technology transfer and technical cooperation, and capacity-building support. The prospects for trade tariffs being imposed on developing economies’ exports of energy-intensive goods by the EU, US and other developed economies are also of great concern to many economies that may be outside of a putative “climate club”.
The vast difference in per capita CO2 emissions between developed economies such as Australia, Canada and the US which stand at over 15 tons and those of developing economies such as India, Indonesia, Mexico, the Philippines, Thailand and Vietnam at the other end of the spectrum at less than 3 tons (i.e. lower by a factor of five) suggest that the call for all economies to reduce emissions at COP26 will be received with much reservation regarding equity and historical responsibility. In the wake of debilitating economic lockdowns with the covid pandemic, the key policy challenges for many developing economies lie less with concerns about increasing CO2 emissions caused by economic growth than with re-invigorating economic growth in the first place so that the objectives of poverty alleviation and meeting popular aspirations for better standards of living are not compromised. It would be appropriate for APEC member economies to propose climate mitigation and adaptation policies and measures at COP26 which are consistent with the rapid resumption of economic growth and free trade to meet broadly-shared development and environmental goals.
2. Paris Agreement: Nationally Determined Commitments
APEC’s Putrajaya Vision of an ‘open, dynamic, resilient and peaceful Asia-Pacific community by 2040, for the prosperity of all our people and future generations’ includes as one of its drivers strong, Balanced, Secure, Sustainable and Inclusive Growth: Central to this is the promotion of ‘economic policies, cooperation and growth which support global efforts to comprehensively address all environmental challenges, including climate change, extreme weather and natural disasters, for a sustainable planet.”’
Central to these global efforts is the Paris Agreement on Climate Change. The purpose of this study is to identify key areas for regional cooperation in climate mitigation and adaptation initiatives. Specifically, it will cover three topics:
- Paris Agreement Nationally Determined Commitments (NDCs)
- Carbon Markets, Carbon Prices and Carbon Trade Border Adjustments
- Green Finance
Each of these areas of potential policy and regulatory cooperation for APEC economies are deep subjects in their own right and each carries a voluminous literature. This study will adopt a literature review approach to yield summary conclusions and recommendations accessible to the broad and non-specialist policy and business community.
To complement the analytical work of this study, PECC undertook a survey of business, government, and non-government views on a range of climate change issues.
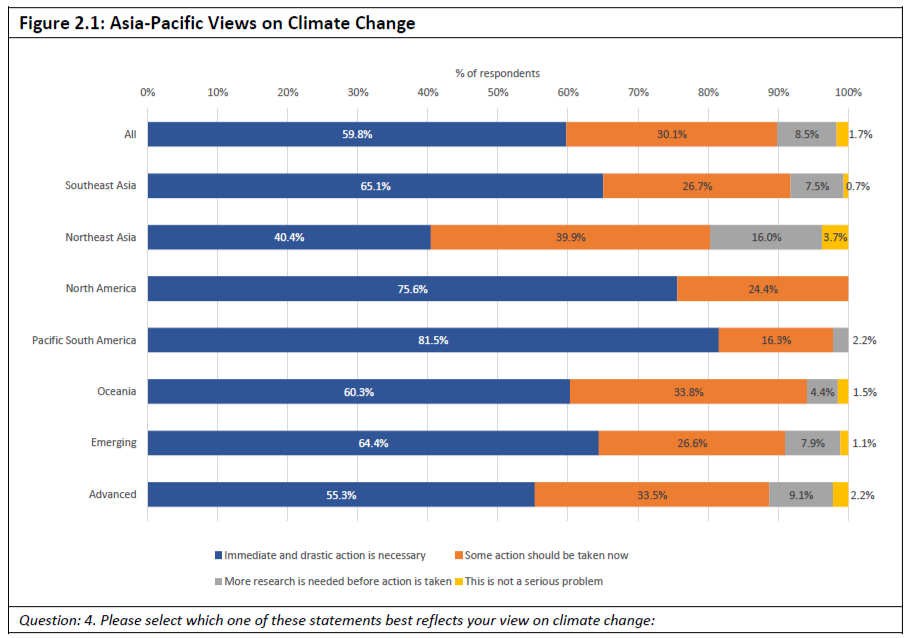
As is clear from the results shown in Figure 2.1, the view from across the region, with some variation, was that there is a strong expectation that ‘immediate and drastic action is necessary’ to address climate change.
Under the Paris Agreement, all parties are required to set GHG emissions reductions targets defined as nationally determined contributions (NDCs). Parties are expected to pledge increasingly ambitious NDCs every five years.
a. NDCs: varying ambitions among parties
The UNFCCC secretariat prepared a synthesis report on NDCs submitted by Parties and published on 17 September 2021.81 The report collated information from the 164 latest available NDCs, representing all 191 Parties to the Paris Agreement, including the 86 new or updated NDCs communicated by 113 Parties, recorded in the interim NDC registry as at 30 July 2021, covering 93.1 per cent of the total global emissions in 2019. The rest of this section of the report is based on the synthesis report unless referenced otherwise.
Almost all parties provided information on mitigation targets, in particular for 2025 and/or 2030. The mitigation targets range from economy-wide absolute emission reduction targets to strategies, plans and actions for low-emission development. According to the synthesis report “many Parties” strengthened their commitment to reducing or limiting GHG emissions by 2025 and/or 2030, demonstrating increased ambition to address climate change.82 More Parties than previously communicated absolute emission reduction targets, with some moving to economy-wide targets, resulting in most Parties having economy-wide NDCs. The Parties increased the coverage of sectors and types of GHGs. While new or updated NDCs increased the share of parties adopting absolute emission reduction or emission relative to “business as usual” (BAU) targets,83 those parties that adopted other means of reducing emissions included a range of policies and measures, emission intensity targets and target dates by which emissions should peak.
Many Parties included absolute emission reduction targets expressed as an emission reduction from the level in a specified base year, ranging from 13 to 88 per cent. A few other Parties specified a year or time frame in which their emissions are expected to peak or reach a maximum level of absolute emissions (e.g. by 2030).
Some Parties expressed their target as a carbon budget in addition to the absolute target, establishing an overall limit on GHGs to be emitted over a specified period of time (e.g. between 2021 and 2030). Some Parties included relative targets for reducing emissions below a ‘business as usual’ level by a specified target year, either for the whole economy or for specific sectors, ranging from 11.5 to 53.5 per cent. A few Parties had emission intensity targets for reducing specific GHG emissions per GDP unit relative to a base-year (e.g. 1990) level or listed other policies and measures to reduce emissions. Some Parties included two levels of emission reduction targets, with less ambitious ones being offered unconditionally and more ambitious targets conditional on the availability of international assistance in funding resources, technology transfer and capacity building.
Among all Parties NDCs, the most common emission reduction target (43%) was that expressed as a planned reduction from a projected “business as usual” outcome. Absolute emission reductions relative to a base or reference year or absolute quantified reductions without reference to any base year was the next most popular (35%). Just over a fifth of all NDCs chose other types of targets including reductions in emission intensity, target dates for planned peak emissions, and a range of other policies and measures or a combination of these.
Table 2.1: Status of APEC NDCs and Targets
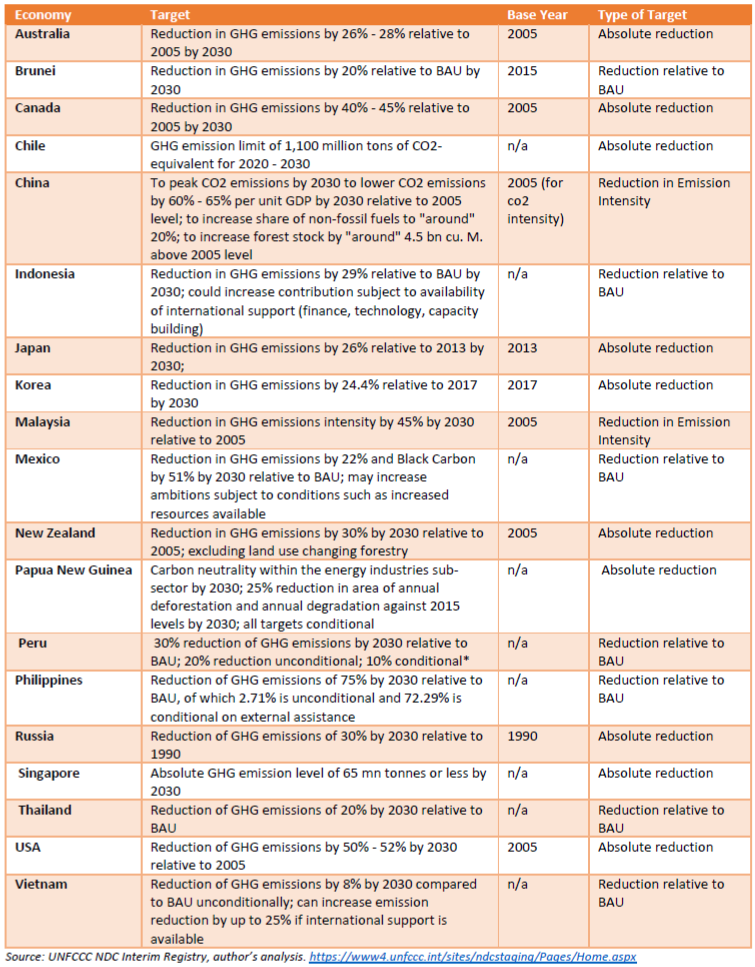
In Table 2.1, the APEC members NDC’s are listed with their main targets. Under the Biden administration which brought back the U.S. into the Paris Agreement (after President Trump’s previous decision for a US exit), the economy now is ranked as having one of most ambitious 2030 targets based on the change in absolute volumes of emissions by 2030. Canada and Japan are among the other economies in the region that have relatively ambitious targets in terms of planned emission reductions. In contrast, key developing economies – most notably India and China – can increase their emissions substantially to 2030, as their targets are related to emissions intensity per unit GDP. This intensity target allows for rising emissions by improving energy efficiency so as to continue economic growth, albeit with lower associated emissions.
Table 2.2: Total and Per Capita Emissions for Asia-Pacific Economies
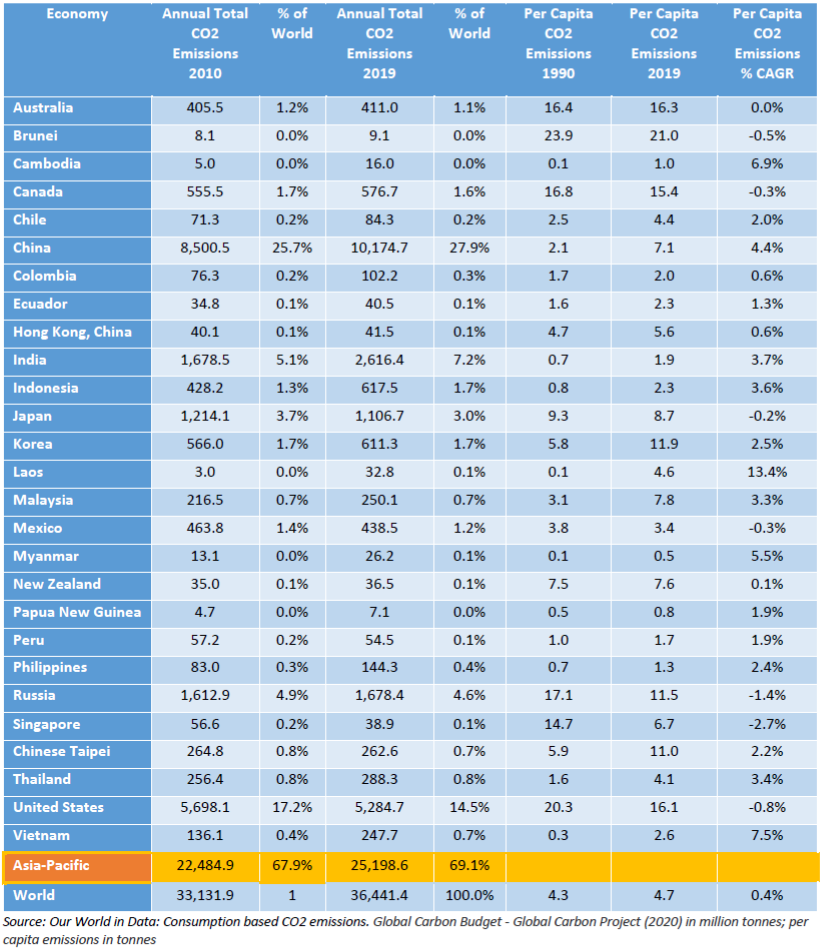
Asia-Pacific economies account for approximately 69 percent of global emissions (a broad definition of the region including all APEC members, members of the East Asia Summit and PECC is used here). Measured on the basis of total emissions emerging economies with large populations tend to account for a larger share of global emissions, but measured on a per capita basis their annual emissions are significantly lower than advanced economies (see Table 2.2). The average global per capita emissions in 2019 was 4.7 metric tons, which is less than a third of the metric for the developed economies such as Australia, Canada and the US (in excess of 16 metric tons). Some of the lowest per capita emissions are in Asia among the large developing economies such as India (1.7 metric tons), Indonesia (2.3 metric tons) and Vietnam (2.6 metric tons) In negotiations on emission reduction commitments at COP26, the issue of per capita emissions and the role of equity and historical responsibility regarding past emissions will play a significant role for developing economies.
b. Comparing Emission Reduction Targets
Parties to the UN Convention have adopted different types of emission reduction targets for 2030 in their NDCs for COP26. As mentioned above, NDCs presented by Parties including absolute reductions of emissions from a base year, reductions from a hypothetical “business as usual” (BAU) trajectory over the 2020 – 2030 period or reductions in emissions intensity per unit of GDP and “other policies and measures”. This makes it inherently difficult to compare across various Party NDCs in terms of planned emission reductions compared to what would have happened in the absence of an emission reduction policy scenario. For example, the base year a Party chooses to compare its future target against can make a very significant impact on the Party’s proposed quantum of emission reductions.
Furthermore, the many assumptions involved in constructing a hypothetical BAU emission trajectory over the next decade or longer can be difficult to objectively verify as a fair representation of what can be expected given uncertain long run forecasts economic growth rates, development trajectories of low-emission technologies including renewable energy and electric vehicles and technological progress in energy efficiency performance across various economic sectors.
Promoting renewable energy generation were most frequently mentioned by Parties, followed by measures for energy efficiency improvement. Almost all Parties outlined mitigation targets in specific priority areas, such as energy supply, transport, buildings, industry, agriculture, land use, land use change and forestry (LULUCF) and waste.
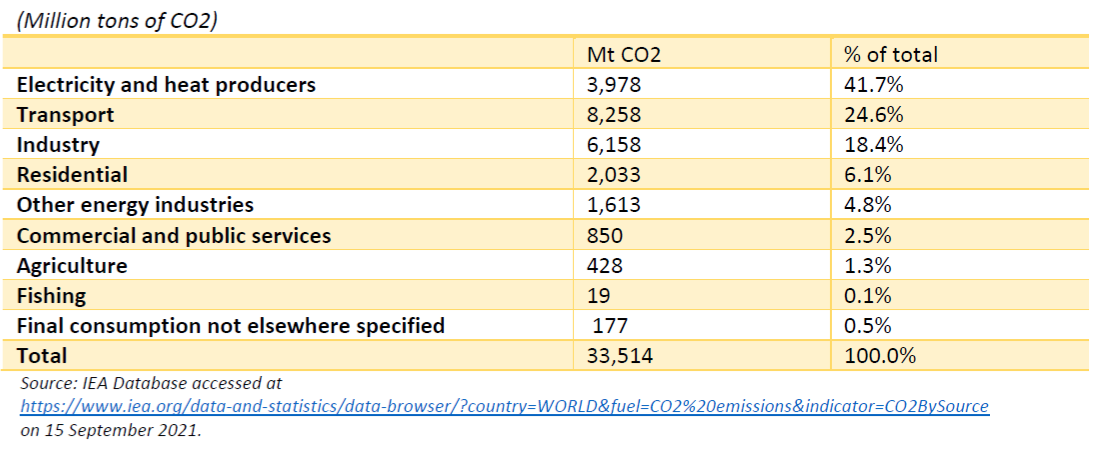
Global carbon emissions by sector are reported by the IEA in Table 2.3. Different economies will exhibit varying sectoral emission patterns as a function of their economic configurations. As can be seen, the electricity and heat generation sector is the most emissions-intensive, accounting for over 40% of total emissions. Transport is the next most important one, emitting almost a quarter of all emissions. Industry accounts for over 18%, followed by residential, other energy industries, and commercial and public services in that order. Agriculture and fisheries are minor emitting sectors.
Table 2.3: Global CO2 Emissions by Sector (2018)
Perceptions of Emissions
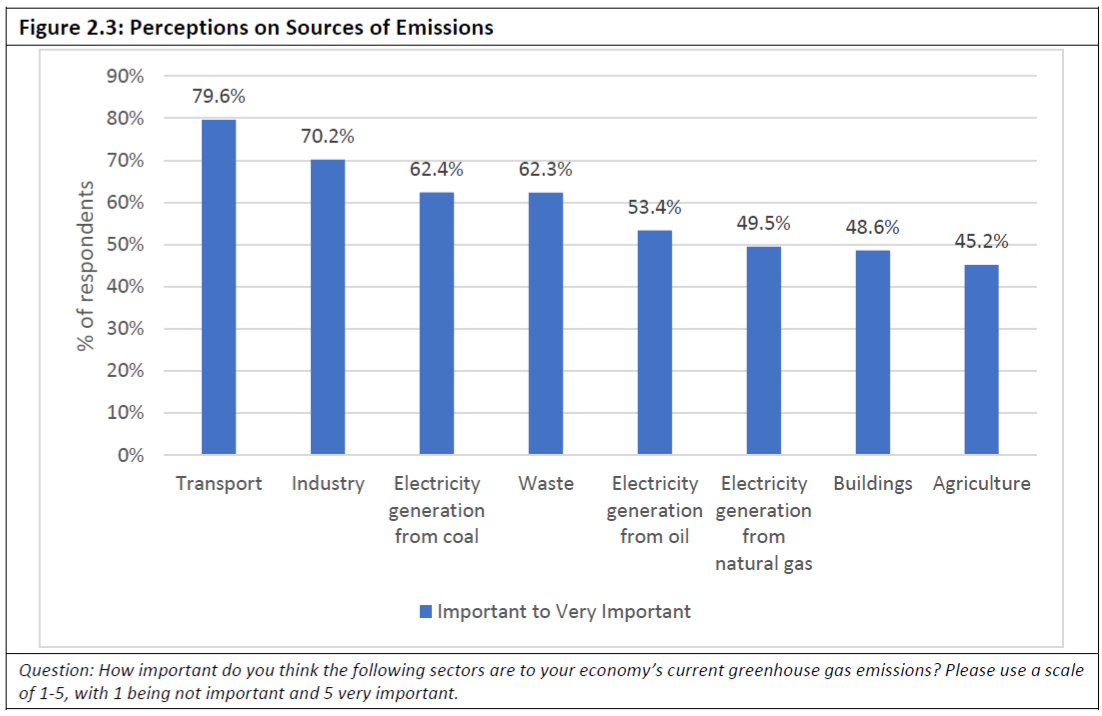
Interestingly survey respondents saw transportation as the single most important sector of emissions followed by industry as shown in Figure 2.3. However, the three main current sources of electricity generation which are the single largest emitter were divided in the survey. The survey revealed important results about some disconnects between perceptions and actual emissions, for example, emissions from waste were seen as just as an important emitter as electricity generation from coal.
There were also considerable variations across sub-regions on the relative importance of different sources of emissions, for example 64 percent of respondents from Oceania had agriculture as an important source of emissions compared to 28 percent of Northeast Asians.
In general, most Parties indicated policy focus for emission reductions in the key sectors of electricity and heat generation, transport and industry which is broadly in line with the IEA data on sectoral emissions.84 Most NDCs indicated support for renewable sources, particularly for solar and wind technologies, in the electricity sector; promotion of electric vehicles in the road transport sector; and enhancement of energy efficiency across the industry, residential and other sectors.
NDCs commonly identified markets and market-based incentives (MBIs) such as emission taxes or “cap-and-trade” of emission certificates as a means of efficient decarbonization by putting a price on emissions. Among MBIs mentioned in some NDCs, the reduction or complete halt of subsidies in the fossil fuels sector is also mentioned. A few Parties communicated specific discretionary measures, such as phasing out use of coal to produce electricity by 2025; banning new registration of internal combustion engine (diesel and gasoline) vehicles by 2030 or later (see discussion of electric vehicles in Section 1c); and requiring new buildings constructed to consume almost zero energy.
Most Parties where agriculture and forestry are important sectors identified domestic mitigation measures in the LULUCF sector, with some developing economy Parties referring to reducing deforestation (which include REDD+ activities)85 as a priority with high mitigation potential. In terms of measures for enhancing carbon sequestration in soil or vegetation, afforestation, reforestation and revegetation, sustainable forest management, and reduced deforestation and forest degradation were most frequently indicated. A few Parties communicated quantitative targets for increasing forest cover without competing for land in the agriculture sector. In addition to the medium-term focus (to 2025 and 2030) of most NDCs, many Parties provided information on long-term mitigation visions, strategies, or targets for up to and beyond 2050. Of those Parties, some reported targets of “net zero emissions” by 2050 or beyond.
In comparison with previous NDCs, there was an increased focus on adaptation planning. Adaptation priorities for most Parties, according to the NDCs, focus on food security and production; terrestrial and wetland ecosystems; human health; freshwater resources; key economic sectors and services; disaster risk management and early warning; human habitats and urban areas; coastal areas and sea level rise; ocean ecosystems; and livelihoods and poverty.
For APEC member economies which have significant agricultural sectors, both for export as well as domestic agricultural produce, there is broader momentum in creating missing markets in “natural capital” that is relevant to both the adaptation and mitigation streams of climate change action. The rate of build-up of CO2 in the atmosphere can be reduced by taking advantage of the fact that atmospheric CO2 can accumulate as carbon in vegetation and soils in terrestrial ecosystems. Under the UNFCCC any process, activity or mechanism which removes a greenhouse gas from the atmosphere is referred to as a "sink". Human activities impact terrestrial sinks, through land use, land-use change and forestry (LULUCF) activities.86
Land management via LULUCF activities can improve both environmental and economic outcomes of the agricultural sector. Increasing diverse plant and tree shelters on land, for example, can support and protect biodiversity and improve the quality of the soil and crops and cattle. Limiting the access of cattle to rivers and pumping water for cattle to water stations, for example, can support recovery of river ecology and biodiversity, improve soils and reduce parasites in cattle.
There are three steps to creating markets from better land and water management:
- clear and accurate measurement, reporting and verification (MRV) processes of environment and economic outcomes – there have been a remarkable advances in the application of digital, spatial and remote sensing technology which can be brought to bear
- the verifiable measurement of economic outcomes means that risk can be accurately measured and used to price financial instruments, like loans, bonds and equity. Governments can assist in scaling up sustainable farm loans, aggregating and securitizing such loans as collateralized debt obligations.
- identifying the role of government – three aspects are important: governance assuring the quality of environmental and economic data measurement and verification; proof of concept; and extending the maturity profile of loans and finance since some of the economic payoffs can take years to grow (e.g. lifting diverse tree cover on land as a short term cost as land is taken out of use and the benefits to soil, grass and crops takes five years or more to occur). There may be a role for a natural capital finance corporation to spur markets in natural capital and what form it should take.
The benefits of creating markets in agriculture or an economy’s “natural capital” are significant if existing agricultural markets are incomplete or absent. It improves environmental and economic outcomes in the agricultural sector with co-benefits in both mitigation and adaptation efforts. It increases the resilience of agricultural assets such as forests and farms in the face of damaging climate change (i.e. adaptation), It supports carbon abatement through LULUCF activity, and can create a source of income through carbon credits (i.e. mitigation). It provides a way for farmers to show consumers that their products are “sustainable”. Hence this would sustain domestic and international markets in agriculture. It sustains lending to agriculture by reducing risk to that sector.
This is an issue that affects all economies and is a natural area to work on with others, including those with whom relations are under pressure. There is cooperative work in Australia, China and the United States, and it is appropriate for on-going policy agendas in forums like APEC and G20. If it can be shown that the risk associated with sustainable natural capital is measurable and lower than otherwise, it should be reflected in the international rules for risk in finance, such as the Bank for International Settlements rules for banks and those for securities. (The role of central banks in assessing climate change risk and regulating reporting standards by private firms across all sectors, agriculture and industry, is discussed further in sections 4e).
There was also a greater emphasis in some NDCs on the mitigation co-benefits of adaptation action plans. Adaptation actions with mitigation co-benefits include climate-resilient agriculture, reducing food waste, vertical farming, enhancing coastal ecosystems and moving to the “circular economy” for better waste management. Urban infrastructure management to improve drainage and mitigate flooding are some of the other examples of adaptation planning that would produce co-benefits for mitigating emissions. Among other adaptation measures with co-benefits for emission mitigation mentioned in some of the NDCs is carbon dioxide capture and storage.
While the NDCs indicate priorities of various Parties in mitigation and adaptation activities, what has been the evidence to date regarding actual spending on various sectors? Data gathered by the Climate Policy Initiative (CPI), a climate policy thinktank, offers estimates of global spending on climate change initiatives in its “Global Landscape of Climate Finance” annual reports. According to data gathered by CPI, the public sector constituted between 39% and 46% of total spending, the rest by accounted for by the private sector.87
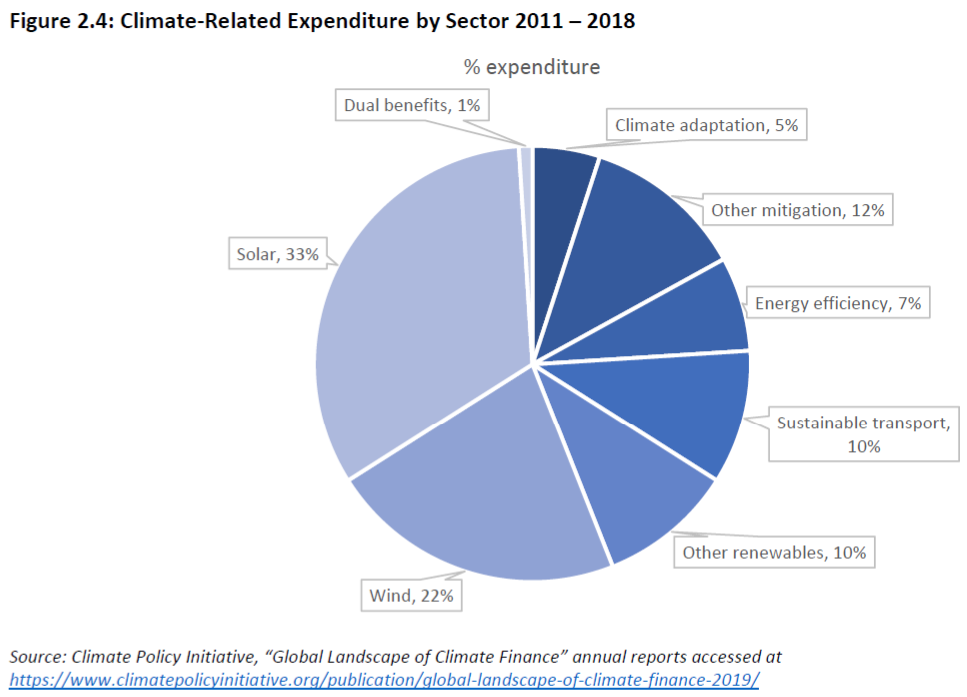
The most striking feature of expenditure on climate initiatives is the overwhelming amount spent on just two renewable technologies -- solar and wind energy – accounting for 55% of all spending during 2011 – 2018 shown in Figure 2.4. If spending on “other renewables” (biomass and waste, biofuels, hydroelectricity, “others”) is included, then spending on renewables accounts for 65%. The other striking feature of the spending pattern is that climate adaptation only accounts for 5% of total climate-related expenditure.
In emphasizing climate mitigation over climate adaptation to reduce the impacts of future climate change on human welfare, the implicit assumption is that greenhouse gases are the primary driver of climate change and trying to “fight climate change” by reducing greenhouse gas emissions is the overriding priority.88
The second approach, climate adaptation, involves developing better infrastructure for dealing with climate change and extreme weather, as has been done throughout human history (eg. by building dykes or levees to handle flooding, weatherizing houses to handle hurricanes or tropical storms, upgrading urban drainage systems, etc.). By overemphasizing climate mitigation efforts, the UNFCCC and COP agreements such as the Kyoto Protocol and the Paris Agreement may have led to a bias against investment in climate adaptation.89
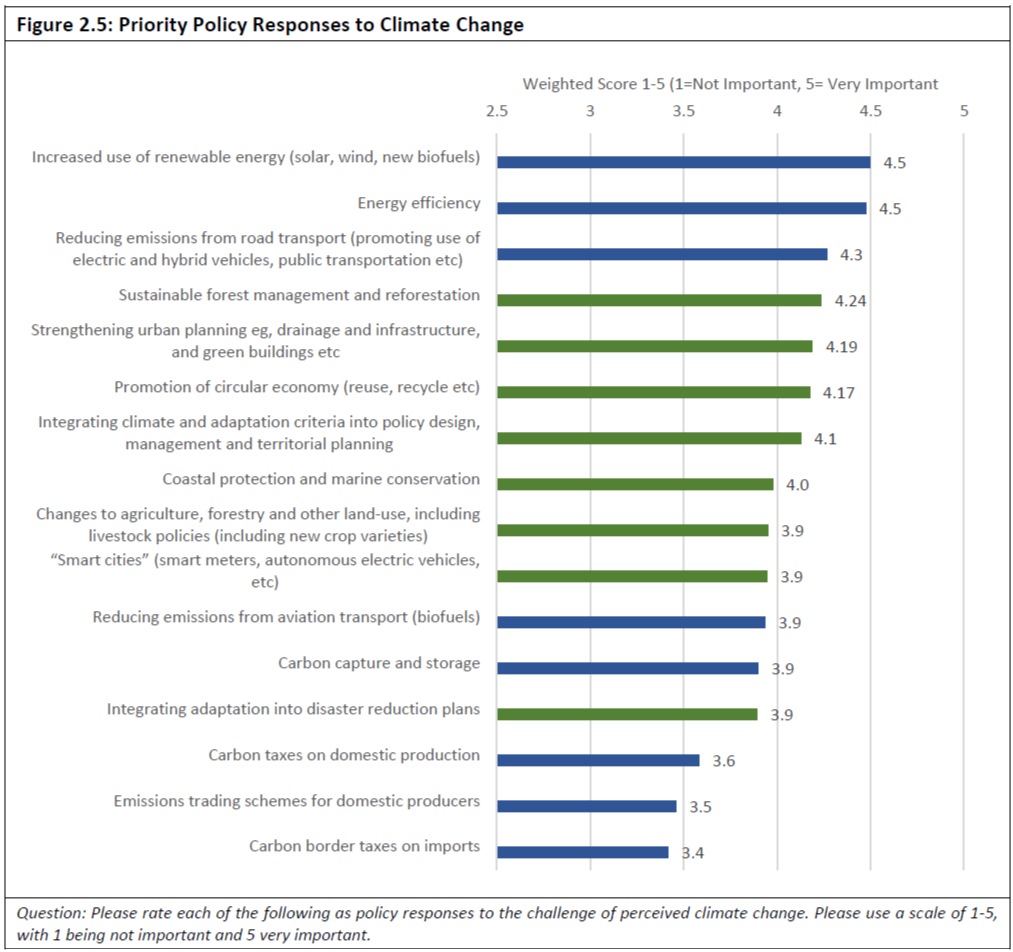
According to PECC’s survey, while stakeholders put highest importance on emission reducing measures, adaptation measures closely follow behind (Figure 2.5). The Asia-Pacific view is that:
- There is an equal need to promote the greater use of renewable energies as well as energy efficiency
- The next highest priority is to reduce emissions from road transport
- These are followed by a series of adaptation measures of almost equal importance: sustainable forest management; strengthening urban planning; and promoting the circular economy (reuse, recycle, etc.)
Interestingly, market-based schemes like emissions trading and carbon taxes came far down the list of priorities. This was an important finding given the trends around the world and statements from key institutions on the need for setting a carbon price. There is clearly a gap that needs to be filled.
At the sub-regional level there were no significant differences in priorities. There were some minor differences likely based on relative importance of sectors to economies, for example, “Changes to agriculture, forestry and other land-use, including livestock policies (including new crop varieties)” was rated a relatively more important policy by respondents from Oceania and Pacific South America compared to respondents from Northeast Asia.
c. Assessing the Potential for Achieving NDCs among APEC member economies
It is important to clarify just what is meant by “low carbon energy transitions” prior to looking at how APEC member economies, individually and collectively, can participate in such transitions.90 A clear distinction that is to be made between what is theoretically or technically possible and what is economically feasible. In assessing the performance to date and the further potential of APEC member economies for achieving communicated NDCs, we first provide an introduction to the nature of energy transitions in a long-term perspective. Set in this context, we follow with brief overviews on renewable energy in the power generation sector, electrification in the transport sector, energy efficiency enhancement across sectors, carbon capture and storage, and hydrogen to replace fossil fuels in heating, power, industry, and transport
i. The Nature of Energy Transitions
The shift in dependence among fossil fuels over the past two centuries was marked by the prolonged and gradual nature of energy fuel transitions. From the almost complete dependence on traditional biomass (wood, charcoal, dung, straw) prior to 1800, it took coal a century to account for half of primary global energy consumption. And it took oil about 70 years from its infancy and early use in 1900 before it accounted for about a third of global energy consumption.
Currently, we live in a “fossil-fuel civilization”, as Vaclav Smil terms it.91 After decades of government mandates and hundreds of billions of dollars in subsidies primarily in Western Europe and North America, renewable energy (RE) technologies such as solar, wind, geothermal and new biomass fuels (such as biodiesel and ethanol) account for just 5.7% of global primary energy consumption. Even for the OECD members, where renewable energy has grown the most, fossil fuels still provide an average 78% of their energy needs.
There is little evidence of an accelerating energy transition at a global scale despite the rapid growth rates of the renewable energy. Given the small existing contributions of these newer technologies and their very low-capacity utilization factors, rapid growth rates in RE capacity make relatively small contributions to the overall distribution of global fuel sources of primary energy expended.
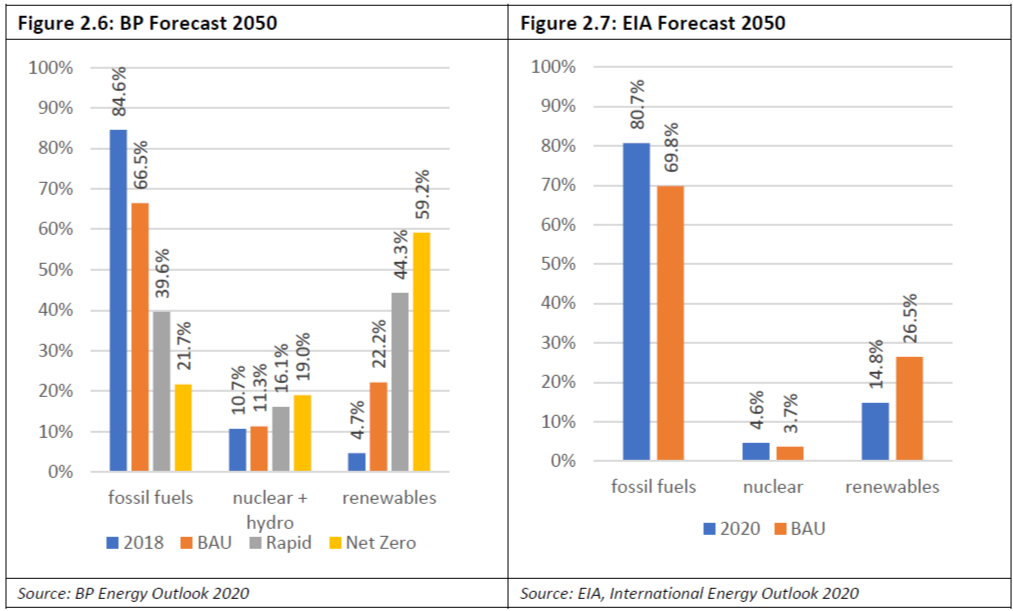
It is instructive to compare two well-known long-run energy forecasts, one by BP and the other by the US Energy Information Administration (EIA) for 2050, using 2018 data as baseline.92 The US EIA reference forecast assumes that current laws and regulations are implemented, while the BP forecast offers 3 scenarios, “business-as-usual” (BAU), “rapid” and “net zero by 2050”.
The EIA reference forecast is comparable to BP’s BAU scenario. It should be noted that the EIA includes hydro-power in the renewables category while BP includes it in its “nuclear and hydro” category (it excludes hydro from its renewables category). Furthermore, the EIA includes new biofuels such as ethanol and biodiesel in its liquid fuels category. Nevertheless, given the relative small and slow growing shares of hydro and biofuels in total primary energy, the two forecasts are broadly comparable.
BP’s “BAU” scenario is roughly similar to EIA’s reference case with respect to the share of fossil fuels into total primary energy consumption in 2050. BP shows fossil fuels contributing 66.5% while the EIA shows a somewhat higher contribution of 69.8% by 2050 compared to over 80% in 2018.93 What is remarkable are BP’s very aggressive “rapid” and “net zero (by 2050)” scenarios, which show fossil fuels being reduced to less than 40% of total energy consumption in 2050 under the Rapid scenario and just 20% in its Net Zero scenario.94 The EIA sees renewables (including hydro) contribution increase to 26.5% by 2050 from 14.8% in 2020 in its reference scenario. BP, in its BAU scenario sees renewables (excluding hydro) grow from 4.7% in 2018 to 22.2% in 2050. What is far more remarkable is BP’s projected share of renewables in 2050, ranging from 44.3% in the Rapid scenario to almost 60% in its Net Zero scenario.
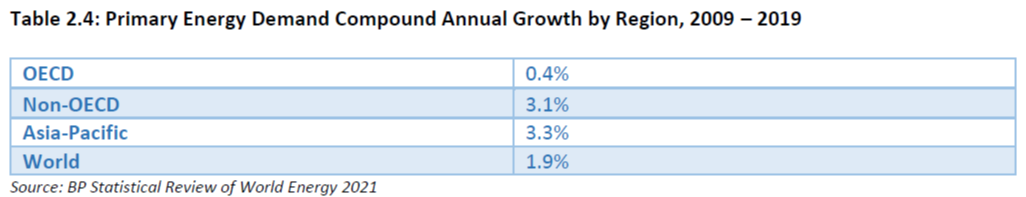
The underlying differences in the long run outlook between BP and the EIA are made more apparent by looking at the compound annual growth rates of primary energy sources over 2018 - 2050. Unlike EIA’s projection of a total primary energy demand compound annual growth of 1.3%, BP’s projects significantly lower growth in all its scenarios. In its BAU scenario, total primary energy demand grows only by 0.7% each year compounded. In its rapid and net zero scenarios, this growth is more than halved, with total energy demand growing only by 0.3%.
The contrast between the two forecasts is even more dramatic when projections of fossil fuels use is considered. The EIA projects a growth of 0.8%, while BP forecasts zero or negative growth in its scenarios. In BP’s BAU scenario, there is no growth in fossil fuel use during the period, while it falls by 2.1% every year in the Rapid scenario and even more dramatically by 3.9% in its Net Zero scenario.
In sum, BP forecasts for renewable energy are far more optimistic, growing by 5.7% annually in its BAU scenario, in contrast to the EIA’s 3.3%. BP is much more optimistic in its Rapid and Net Zero forecasts, where renewables grown by 7.5% and 8.5% respectively. The projections over 30 years magnify the results exponentially when compounded over 30 years.
The extensive coverage in the media regarding the rapid growth in renewable energy, primarily wind and solar power, lacks sufficient attention to the far more consequential realities in the evolution of global energy use.95 The continued dominance of fossil fuels and of the role of developing economies – which account for more than 80 per cent of the global population – in the growth of energy demand is a major determinant in the outlook for “decarbonization”. If by “energy transition” is meant the replacement of a class of fuels by another (as shown in the work of Vaclav Smil discussed above), then the EIA forecast does not see any such transition by 2050 but expects a continued and important role for coal, liquid fuels, and natural gas into the middle of this century.
In the decade before the covid pandemic demand shock in energy in 2020 (i.e. 2009 – 2019), while OECD demand for total primary energy grew by 0.4%, non-OECD demand grew by nearly 8 times as fast, by 3.1%. Asia-Pacific primary energy demand grew even faster at 3.3%. World demand grew by 1.9%.
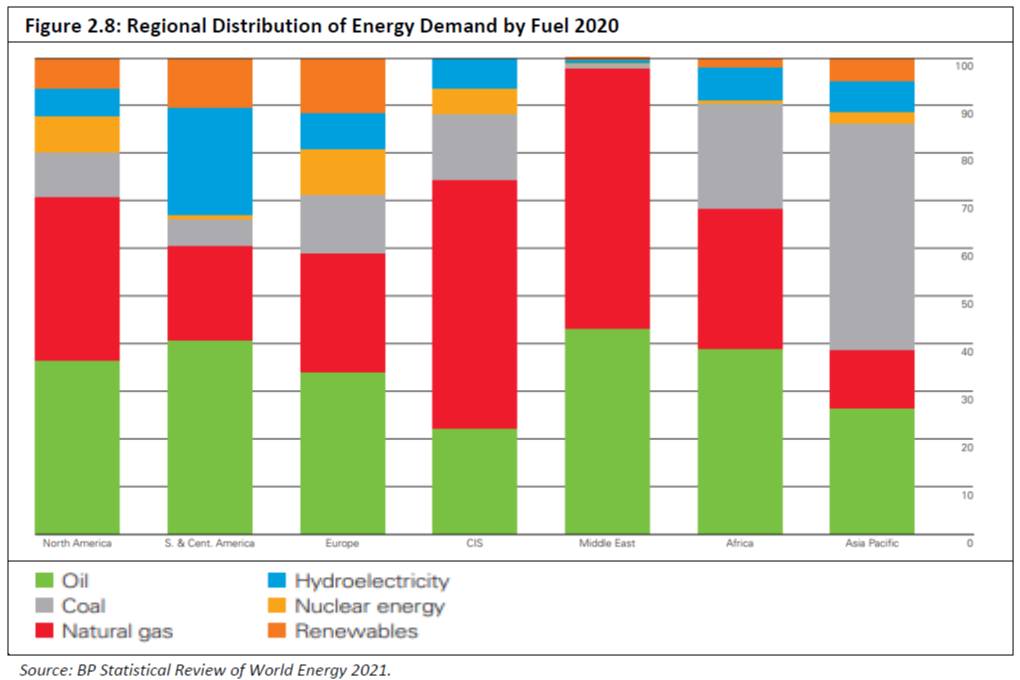
While fossil fuels dominate the energy mix, developing economies, in particular those in Asia, increasingly determine the geographical distribution of energy use. Developing economies accounted for 61% of global energy demand in 2020. The importance of coal to developing economies in Asia is stark (see Figure 2.8 below). Almost 82% of global coal consumption occurred in the developing world and developing Asia accounted for almost all of it.
The dominating role of the developing economies in energy demand growth is better illustrated in incremental terms. In the five years to 2019, developing economies accounted for 88% of global incremental demand for primary energy and OECD for the remaining 12%. The Asia-Pacific region alone accounted for almost three quarters of global incremental demand during 2014-2019.
In assessing the opportunities to de-carbonize on a global scale, in order to meet the goals consistent with the Paris Agreement, the immense scale of the current fossil fuel-based global energy system needs to be kept in mind. It cannot be emphasized enough that attempting to displace the vast existing global infrastructure that constitutes the current global energy system with a mix of intermittent power generation technologies (such as solar and wind power) and liquid biofuels will be a prolonged and gradual process for generations to come, going well past the middle of the current century.
In order to develop a strategy to mitigate global energy use-related GHG emissions, it is critical that the scope of the challenge is well defined and clearly understood. Most analysis of global energy systems recognize the importance of a portfolio of electricity generation technologies including a significant portion of which must be “dispatchable”, i.e. available at any time needed by a changing demand load on the electricity grid. Intermittent renewable energy technologies such as wind and solar can only provide power as a function of solar insolation and wind speed which are contingent on local conditions such as time of day, cloud cover and varying wind speeds.
Just how credible is the call for a complete transformation of the global energy system within three decades which today relies on fossil fuels for 85% of its needs? In relation to low-carbon energy transitions, a clear distinction is to be made between what is theoretically possible and what is economically feasible. An objective study of the costs and benefits of decarbonization proposals needs to minimally show at least the following properties:
- Transparent data inputs, plausible assumptions and validated, replicable modelling;
- Technology assumptions that are proven at scale at a cost comparable with existing alternatives;
- Deployment rate assumptions that are plausible in comparison to historical examples of decarbonization in the energy sector; and.
- Incorporation of the social and economic costs of existing environmental and permitting process constraints.
Respondents to PECC’s survey were asked to rate the most important sources of emissions to their economies both today as well as in 30 years’ time.
Figure 2.9 shows the fall in the percentage of respondents who thought the sector was an important or very important source of emissions over the next 30 years. As seen in the chart, there was substantial variation across the region on where reductions in emissions will come from. By far, emissions from electricity generation from coal had the largest drop in importance across all sub-regions, although there was some considerable variation. For North Americans it was much larger a drop of 43 percent, while for Pacific South Americans it was a drop of 15 percent.
Emissions from the electricity generation from natural gas, largely seen as a ‘transition’ fuel still saw a drop in importance but less so amongst the traditional fossil fuels.
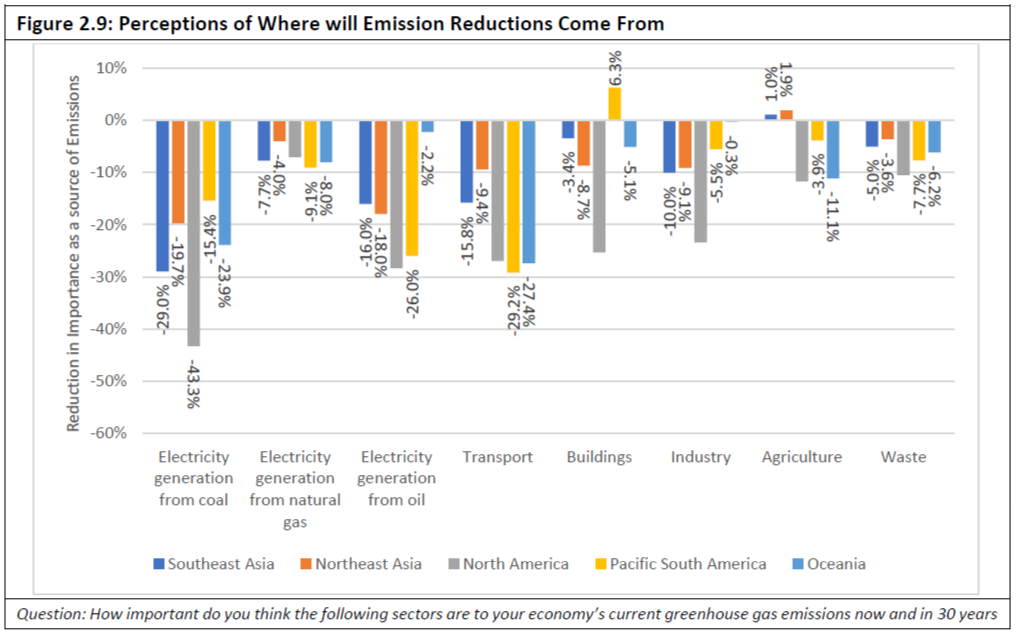
Interestingly, some sub-regions saw emissions increasing from certain sectors. For example, respondents from Pacific South America expect emissions from buildings to increase, while respondents from Northeast and Southeast Asia expect emissions from agriculture to increase.
ii. Renewable Energy in the Power Generation Sector of APEC Member Economies
The pattern for the distribution of commercial primary energy (CPE) consumption by the categories defined in Table 2.5 for the Asia-Pacific regional average is similar to the world pattern. Within the Asia-Pacific, most economies depend more on fossil fuels as a share of total primary energy consumption relative to the world average of just over 83%. Among the exceptions are Canada, Chile, New Zealand, and Peru, all of which are well endowed with hydropower resources. Those that have renewable energy share of total CPE which exceeds the world average are Australia, Chile, New Zealand, the Philippines (mainly geothermal) and the US.
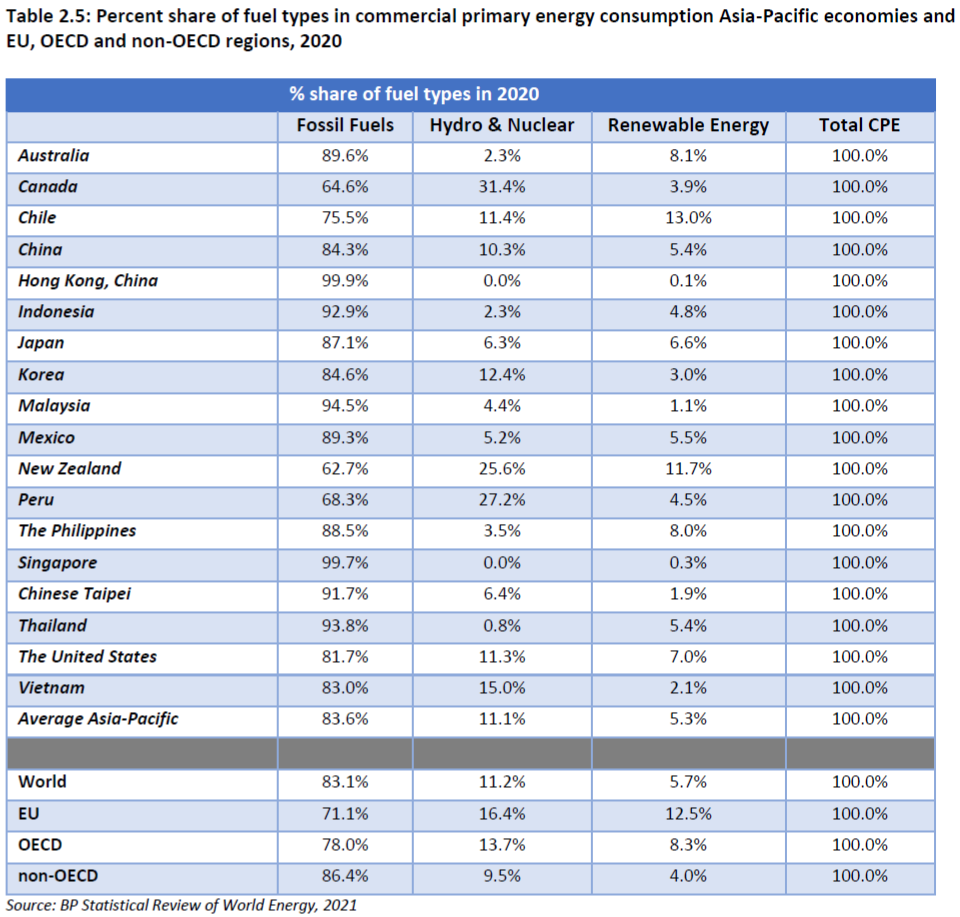
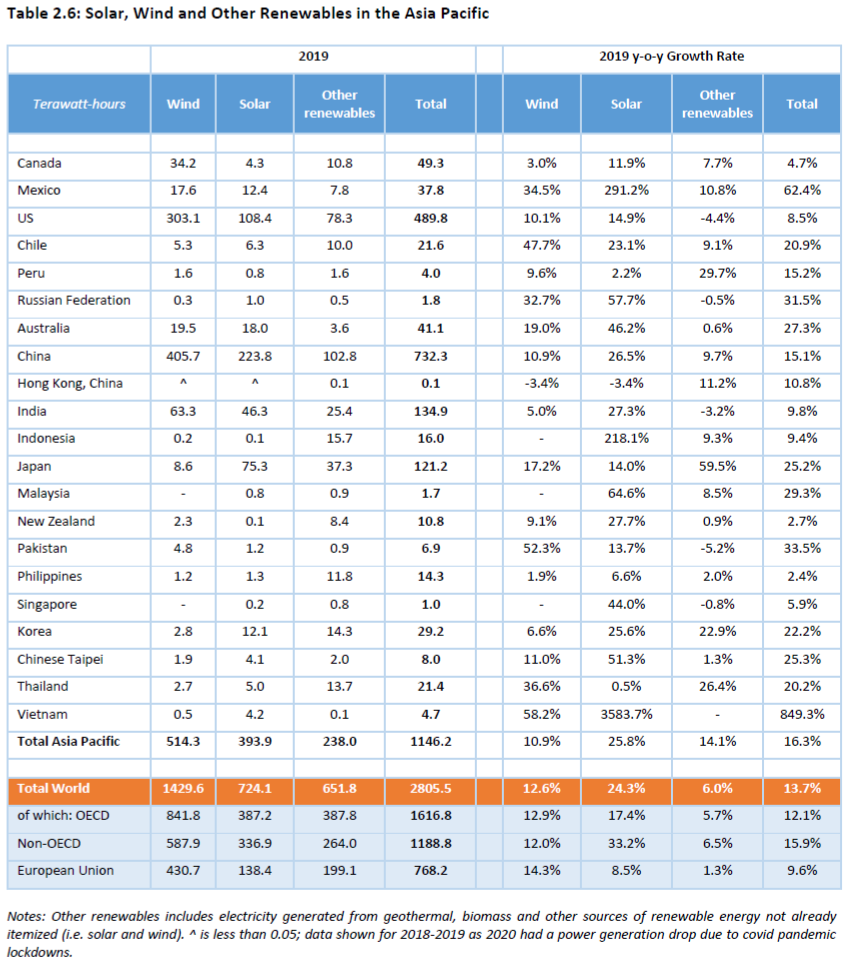
Table 2.6 below provides data for 2019 which breaks down renewable energy generation by source among wind, solar and “other” (which includes geothermal, modern biomass fuels such as biodiesel and ethanol and other sources not itemized). At the global level, wind power generation (1,429.6 terawatt hours or twh) was about twice that of solar power generation (724.1 twh) in 2019. Wind power’s dominance over solar is also the case in most economies in the sample of regional economies in Table 2.6. The exceptions are Chile and many Asian economies which lack wind energy resources (Japan, Malaysia, the Philippines, Singapore, Korea, Chinese Taipei, Thailand and Vietnam). The growth of solar power globally was more than double that of wind in 2019 over the previous year.
Some economies exhibited extremely high rates of growth in 2019 over the previous year in both wind and solar power generation due to the small base in 2018. Mexico, Chile, Australia, Japan, Malaysia, Korea, Chinese Taipei and Thailand experienced growth in renewable energy generation in 2019 significantly above the global growth rate of 13.7%. This reflected the very small base this growth rate is calculated from. For example, Vietnam’s remarkable 849.3% growth shows its renewable energy generation increased from 0.5 twh in 2018 to 4.7 twh in 2019. So, by looking at 2019 growth rates in renewable power generation, one might be encouraged at the rapid rates of growth in Asia-Pacific and among most APEC members economies.
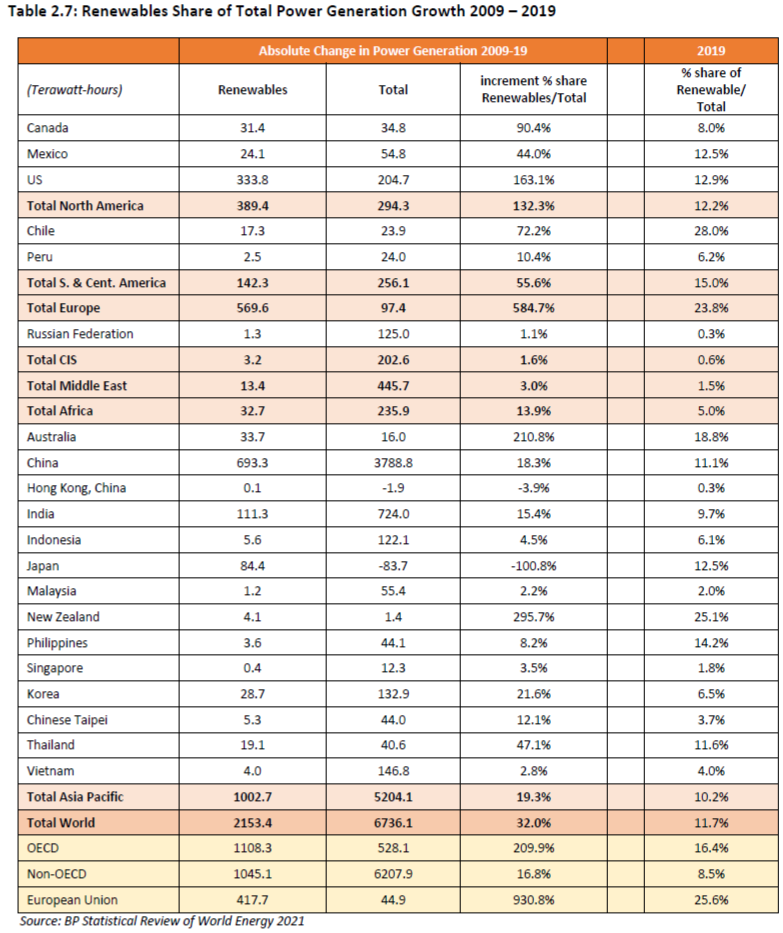
In assessing the performance of APEC member economies in expanding the role of renewable energy, it is important to note not only the small role of renewable energy in total CPE (Table 2.6) and its rapid annual growth in 2019, typically from a small base. It is more informative to assess the growth of renewable energy in incremental terms: that is, what is the growth of renewable power generation in proportion to the growth of total power generation over a longer period? Table 2.7 gives the data for the global total as well as for the non-OECD, OECD and Asia Pacific regions for the decade 2009 - 2019. The percent share of increase in renewable power generation in total power generation during 2009 – 2019 is far higher in the developed APEC member economies and other OECD economies than the developing economies. By region, North America, Europe, EU as well as well as OECD members far higher renewable shares in incremental power generation during the period. The ratios for these regions, respectively, are 132%, 585%, 931% and 210%. These ratios are far in excess of the global average of 32%.
This reflects not only the substantial increase in renewable energy generation but also the very slow growth in total power generation (the denominator) during the period. These ratios are also much in excess of the (static) share of renewable energy in total power generation in 2019, hence showing the progressive growth over time that these regions can expect in replacing fossil fuels although how long it will take to completely replace fossil fuels is subject to many factors including the fact that the intermittent nature of renewable technologies and the lack of scalable storage of grid power mean that increase in renewable energy capacity will require back-up dispatchable power (such as natural gas). When the wind does not blow or the sun does not shine, back-up dispatchable power will be necessary to power the grid.
In the Asia Pacific, renewable energy accounted for 19% of the increase in total power generation during 2009 – 2019. Given the very low (static) share of renewable power in total power generation in 2019 (10%), the rate of increase in renewable energy will progressively increase the share of renewables in power generation but very slowly. In other words, 81% of the region’s increase in power generation during 2009 – 2019 was met by either fossil fuels (coal, oil and natural gas) or nuclear and hydropower. This was just a little less than the 83.6% share that fossil fuels accounted for in Asia Pacific’s primary energy consumption in 2020 (see Table 2.5). That is to say, despite the high percentage increase in renewable power generation, the increase in the use of fossil fuels for power generation in Asia Pacific during the decade 2009 – 2019 accounted for almost as much in incremental demand as their share in total primary demand in 2020. This holds for developing economies, as well as other regions such as the Middle East, Africa, and the CIS states (which includes Russia). In the Asia Pacific, Hong Kong (China) and Japan were exceptional in recording a fall in total power generation during the decade.
In summary, it is apparent that the advanced economies have had relatively rapid growth in renewable energy as a share of total power generation, although the rate of progress shown in the decade 2009 – 2019 may not necessarily hold out in the long run future. Intermittency of renewable generation have a significant impact on electric grid reliability, costs of system operations, and requirements for backup generation capacity. Not only are there technical issues related to the intermittency and low power density of renewable energy and the exorbitant cost of power storage at grid or utility scale,96 but the increasing costs of renewable energy subsidies to consumers and taxpayers have been noted particularly in the EU,97 UK98 and states such California99 and South Australia100 which have been leaders in subsidizing the growth of wind and solar power. The costs of intermittency, low power density and large-scale battery storage together with the continued subsidy support that governments need to provide in order to support the growth of renewable energy capacity are considerable and challenging even for the much richer developed economies.
The rate of growth of renewable power generation in the developing economies of Asia Pacific primarily reflect the small base on which these growth rates are calculated. Given the rapid historical increase in power consumption in these economies, most credible forecasts show continued rapid growth in power consumption most of which will be supplied by fossil fuels. It is important to note that renewable energy is still mostly used to generate electricity, and electricity as a share of global final energy consumption is still just 18%. The direct use of fossil fuels is still the primary energy provider for modern economies across the world. Particularly for the developing economies, renewable energy will play a relatively marginal role in meeting rapidly growing needs for grid electricity for decades to come. Meeting the economic development and poverty alleviation objectives of these economies -- where per capita electricity consumption rates are low and universal access to grid electricity is still lacking -- are policy priorities that are not likely to be compromised at the negotiations at COP26.
 iii. Energy Efficiency across Sectors
Energy efficiency improvements have long been held by its proponents as a means of attaining multiple policy objectives – it can help net-energy importing economies in the balance of payments account, reduce costs for households and firms, enhance national security and improve environmental outcomes. Given the widespread policy emphasis on energy efficiency, there is a clear need to assess how well such policies have fared in practice. In this section, “energy efficiency policies” refers to policies such as subsidies, standards, and labeling and information provision that attempt to directly encourage energy efficient investments but do not directly affect energy prices. Policies that adopt market-based incentives (MBIs) such as carbon taxes and cap-and-trade schemes are discussed separately in the section on carbon markets below
The discussion of energy efficiency in this section looks briefly at the background to the widespread adoption of energy efficiency policies around the world, followed by more examples of energy efficiency policies in the Asia-Pacific region. Energy efficiency policies that have been implemented are discussed next, followed by a critical evaluation the effectiveness of energy efficiency policies which include discretionary financial incentives, mandated technology and performance-based standards, and labeling and information programs. Finally, this section concludes with recommendations on how energy efficiency policymaking can be improved.
Status of energy efficiency efforts in the Asia Pacific region
Improved energy efficiency refers to the reduction in energy consumed in delivering a given level of energy service (heating, lighting, locomotion, etc.).101 Most economies typical set economy-wide targets in terms of energy intensity ratios. As we have already noted, energy intensity targets are a major component of NDCs. One reason for adopting the energy intensity metric is simply the ease with which these measures can be computed and interpreted.
Over the past two decades, the mounting concerns over global climate change have made the emission mitigation potential of energy efficiency investments a declared core benefit for many policy makers. The IEA predicts that the reduction in global CO2 emissions needed to achieve the Paris Agreement goals and “net zero by 2050” in the longer term depend critically on energy efficiency measures as a key pillar.102 It is therefore of no surprise that energy efficiency policies form an increasingly critical dimension to most economies’ overall economic growth agendas.
Most APEC member economies have adopted economy-wide energy efficiency targets. APEC member economies aim to achieve a reduction of 45% in energy intensity for the group by 2035 from the base year in 2005.103 According to APERC data, energy intensity in the APEC region declined by just over 22% between 2005 – 2017, or as stated in the report, “49% of the way to the goal in 40% of the time”.104
At the aggregate economy-wide level, measures of energy intensity, expressed as the unit amount of energy used (in BTUs or kilograms or tonnes of oil equivalent) to produce a unit of GDP, are often the most-widely used metric to assess trends in energy use over time and across economies. While energy intensity has been declining over recent decades, the IEA states that it needs to improve by 4.2% per annum over 2020 – 2030 in order to achieve its sustainable development scenario which meets the goals of the Paris Agreement, and in the longer run, the “net zero by 2050” scenario.105 The IEA target of 4.2% per annum is over 2.5 times the rate exhibited over the previous decade.
Two broad patterns can be discerned in the way in which energy intensity has evolved since 2000: higher income economies tend to have lower energy intensity levels, and energy intensity levels have fallen across the last 2 decades in most of the economies in the sample with the exceptions of rapidly industrializing middle and lower income economies of Malaysia, Thailand, and Vietnam. Among the OECD economies, Australia, Canada, and the US show progressive declines in the ratio over the period. As major natural resource producers, Australia and Canada are at higher absolute levels than resource-poor Japan but lower than Korea. The US has levels of energy intensity that lie somewhere between Australia and Canada, and somewhat higher levels than the OECD average. Japan has the lowest intensity ratios among the OECD group although, given low or negligible economic growth rates over the past 2 decades, its rate of energy intensity improvement is muted.
Figure 2.10 compares annual average % changes in energy intensities for two periods, 2000-2015 and 2015 – 2019. Global energy intensity improved 0.6% in the earlier period, and almost doubled this rate of improvement in the 4 years before the on-set of the covid pandemic in 2020. The OECD group improved its ratio at the same rate over both periods at 1.5% annual average. Australia, Canada, Japan, Korea, New Zealand, and the US improved at either similar or somewhat higher rates than the OECD average. Among the OECD members, Canada, New Zealand and the US exceeded the OECD average improvement in energy intensity the most during the 2000-2015 period.
In the non-OECD group, China, and Indonesia improved their annual average percentage change in energy intensity during 2000 – 2015 by between 1.6% to 1.7%, which is more than double the world’s 0.6% rate. Strikingly, during the same period, the Philippines and Russia improved their ratio by 2.1% and 2.5% respectively, most likely as a result of rapid economic growth (the denominator) and improved manufacturing processes and/or expansion of the services sector relative to manufacturing in their economies.
Hong Kong (China), Malaysia, Mexico and Singapore showed the lowest improvements, with annual rates ranging from 0.1% to 0.3% during 2000 – 2015. Only two economies showed a worsening in the annual average % change in the ratio during this period, with Thailand increasing by 0.6% and Vietnam by a remarkably high 3.3%. This is most likely due to their rapid growth in manufacturing and a sectoral shift from rural agriculture to urban manufacturing for significant proportion of the population.
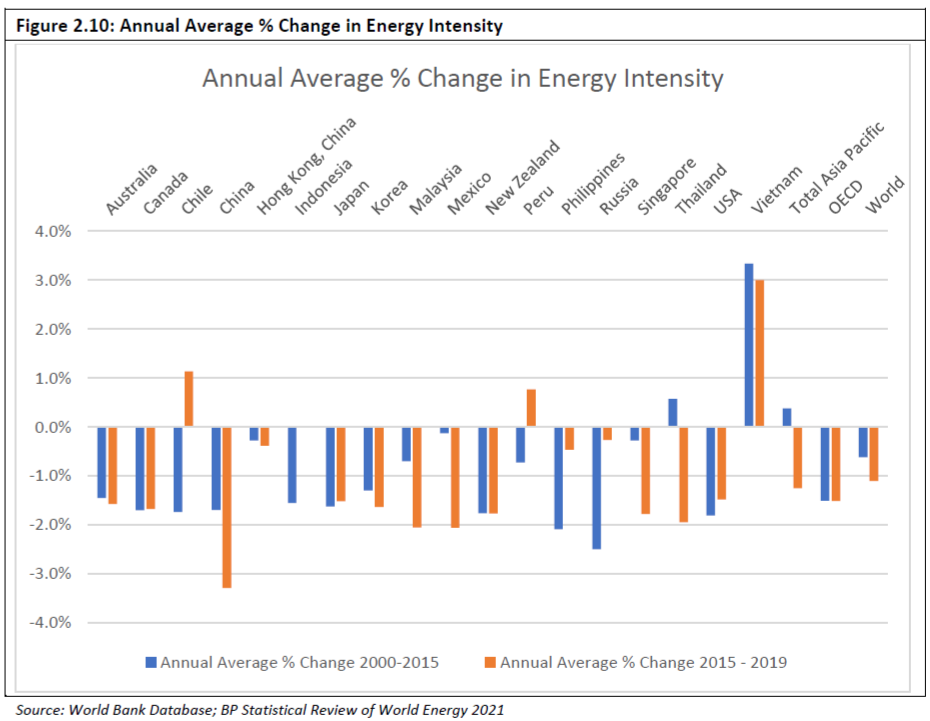
When we turn to the more recent period from 2015 – 2019, the picture dramatically changes for many of the economies. Two economies, Chile and Peru show an increase in the ratio after the improvement in the previous period, at 1.1% and 0.8% respectively, that is a reversal in trend. Vietnam continued to show a worsening in energy intensity in the later period but at a slightly lower rate (from 3.3% to 3.0%). Some economies however show significant improvement in their performance relative to the earlier period, including China, Malaysia, Mexico and Singapore. Most show broadly similar or somewhat better rates of falling energy intensity in the more recent period relative to the previous: Australia, Canada, Hong Kong, Japan, New Zealand, and the US The global average showed a significant improvement in annual reduction of energy intensity, from 0.6% to 1.1%.
Given the very broad nature of the measure of energy efficiency implied by the economy-wide energy intensity metric, this heterogeneity of results is no surprise. From the standpoint of reducing greenhouse gas emissions, however, the relevant indicator is energy consumption, or more accurately, fossil fuel combustion, and it does not necessarily matter whether the target is achieved through energy efficiency improvements or through compositional changes in the economy towards less energy-intensive industries.
Using simple energy/GDP ratios to compare even proximally the energy efficiency levels across economies is, however, misleading. Such ratios conflate different effects, including the evolving composition of economies towards less energy-intensive sectors, the impact of price trajectories of various energy fuels and of rising incomes of households and firms in growing economies.
Energy efficiency policies and measures in the Asia-Pacific
Given the consistent and long running policy emphasis on energy efficiency across the Asia-Pacific region, the descriptive literature on the subject is voluminous.106 In its dedicated webpage on energy efficiency, the IEA has collated among the most comprehensive databases of energy efficiency initiatives undertaken by governments in both the OECD and non-OECD regions of the world. The IEA’s energy efficiency database lists “policies and measures” under 6 categories:
- economic instruments;
- policy support;
- regulatory instruments;
- information and education;
- research, development and
- deployment (RD&D).107
The sector targets for such “policies and measures” in the database include buildings, commercial and industrial equipment, energy utilities, industry, lighting, residential appliances, and transport. While sector-focused policies might have some common regulatory features, economies have typically implemented a distinct set of policies for each sector, rather than applying the same set of policies across all sectors.
Buildings
According to the United Nations Environment Program (UNEP), buildings and their construction together account for 36 percent of global energy use and 39 percent of energy-related carbon dioxide emissions annually.108 Most OECD members have mandatory codes for new and existing buildings, and such standards are being increasingly implemented in developing economies.
The most significant among such regulations are building energy codes i.e. energy efficiency requirements for new buildings where it is much less costly to integrate energy efficiency design and equipment improvements. Building energy codes can also serve as the efficiency target for refurbishments or other improvements of existing buildings.109
Most APEC economies had already long implemented building energy codes, although there are significant differences in coverage (residential vs. commercial buildings) and compliance mechanism (voluntary vs. mandatory codes).110 In addition, a range of other policies have been used to promote energy efficiency improvements in buildings, including energy performance labeling, financial incentives, energy management and audits, lead-by-example programs (such as government ‘test-beds’ and demonstration projects), information and awareness programs, and research and development (R&D) programs.111
Appliances
The technical potential for energy efficiency improvements in appliances is considerable according to engineering studies. According to one early report published in 2010, energy efficient standards and labeling programs aimed at improving the energy efficiency of equipment (including both appliances and lighting) can potentially lead to savings of 3,860 TWh of electricity by 2030.112 To put that in context, the world’s total electricity generation in 2010 was 21,325 TWh.113
It is not clear whether energy efficiency improvements in appliances in industrialized economies in the past 30 years have been driven primarily by efficiency standards, labeling, and incentive schemes. It is also a function of R&D focused on reducing running costs of such appliances and hence gaining market share among consumers. Nevertheless, government policies and regulations might have had a tangible influence on appliance energy efficiency.114 There has been a proliferation of energy efficiency standards and labeling programs around the world, rising from only 12 in 1990 (largely concentrated in industrialized economies) to more than 60 by 2005.115
Transport
Transportation accounted for approximately almost 25% of global carbon emissions in 2018 (see Table 2.3). All transport modes are projected to show substantial increases in activity and fuel use. In the future the impact of increased sales of electric vehicles in road transport vary widely (this is discussed on the section on electric vehicles). Oil is expected to continue to dominate overall transport energy and oil use to 2050.116
The IEA noted previously that policies that help to improve vehicle fuel economy are one of the most cost-effective measures for achieving an overall CO2 reduction target of 50% below 2005 levels by 2050 across the transport sector, although now it advocates for rapid electrification of transport and banning the use of the internal combustion engine (ICE).117 Most OECD members, including the EU and Japan, have pursued improvements in fuel efficiency of internal combustion engine vehicles via high levels of indirect taxes on gasoline and diesel sales.
In contrast, the US has very low rates of tax on transport fuels. Whereas the highest fuel taxes and prices tend to be in Europe, the US has both the lowest tax and the lowest fuel price among the OECD members. Instead, the US has pursued energy efficiency improvements primarily through mandated fleet efficiency standards on manufacturers, known as the Corporate Average Fuel Economy (CAFE) standards that were first implemented in 1975.118 As covered in the discussion on EVs below, the US along with Europe has switched policies in favor of EVs
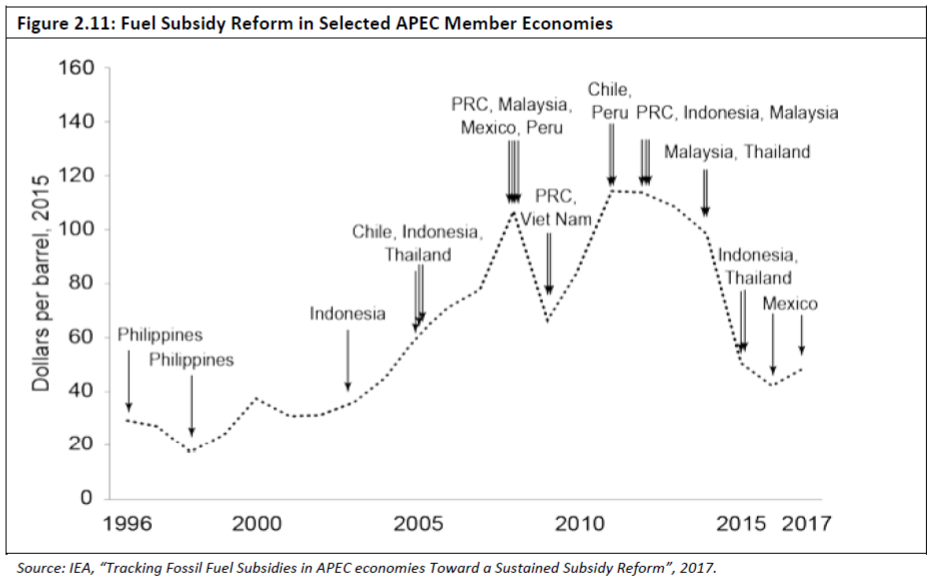
APEC member economies have increasingly cut back on subsidies for transport fuels which cause wasteful inefficiencies and a burden on the public. This is in line with the APEC policy position to “Rationalize and phase out inefficient fossil-fuel subsidies that encourage wasteful consumption, while recognizing the importance of providing those in need with essential energy services, and set up a voluntary reporting mechanism on progress, which we will review annually”.119
The economic impact had been especially significant given that subsidies amounted to between 1-5% of GDP in most Asia-Pacific economies (such as Indonesia and Malaysia).120 Subsidies reform have taken place in several APEC member economies over the past several years, as Figure 2.11 shows. The collapse of oil prices after mid-2014, in particular, gave governments an opportunity to cut back on transport fuel subsidies without too much impact on end-user prices.121
Industry
In 2018, the industrial sector (excluding the energy transformation sector, such as refineries and power plants) accounted for over 18% of global CO2 emissions (see Table 2.3). The energy transformation sector, which converts primary energy stored in energy sources (e.g. fossil fuels) into final energy for end-use sectors (in the form of refined fuels, electricity, etc.), is itself a major user of energy, accounting for 31% of the total primary energy consumption in the world in 2010.122 In spite of this, the bulk of global energy efficiency policy efforts have centered on non-industrial energy use, in part because of the extreme heterogeneity of the industrial sector, ranging from such energy-intensive sectors such as cement and steel plants to energy utilities and other heavy industry sectors.123
Several economies have also implemented policies specifically directed towards improving power generation efficiency. This is motivated by the fact that globally, the power and heat generation sector accounts for over 40% of CO2 emissions (see Table 2.3). These policies include in particular utility demand-side management (DSM) programs. Under these programs, utilities are required to operate energy efficiency programs, for instance by adopting time-of-use pricing to discourage peak demand or by providing cash incentives to consumers to reduce electricity demand when requested.124 In economies where power generation is based on subsidized tariffs for retail users or subsidized feedstock for the power generators, there may be few incentives for efficiency improvements. The strain on public budgets can be further exacerbated by the lack of cost recovery in regulated power generation markets in many developing APEC member economies.
Assessing energy efficiency policies in the Asia-Pacific region
Competitive markets help maximize the benefits of resource use across society by providing a mechanism to allocate these resources to the highest value user. But markets can fail to achieve this outcome due to market failures such as public goods, externalities or increasing returns to scale. The rationale for government intervention in a market-based economy rests on evidence of some type of market failure.125 Two fundamental attributes are necessary for any successful regulatory intervention in market-based economies: (1) administrative and political viability; and (2) economic efficiency. Assuming that the higher-order requirement of viability is met, the focus then is on economic efficiency. The basic test of economic efficiency is cost-benefit analysis (CBA) which is also the basis of conducting what have been termed “regulatory impact assessments”.
The ‘energy efficiency gap’ and government policy
Despite the vital role energy efficiency plays in cutting fossil fuel use cost-effectively, it is claimed that “only a small part of its economic potential is exploited”.126 The fact that cost-effective options to improve energy efficiency are not being adopted on a large scale has led to notions of the “energy-efficiency gap”. The ‘efficiency gap’, or the difference between the level of energy-efficiency actually achieved and the level judged to be optimal at prevailing prices, has generated considerable debate in policy circles as well as in the academic literature. This paradox – the non-adoption or slow diffusion of apparently cost-effective energy efficient technologies – has been the basis of a large literature on ‘market barriers’ which discourage investments in such technologies.127 The notion of “barriers” to energy efficiency choices, understood as market conditions which discourage energy efficiency investments relative to an estimated optimal level, is a staple of many large scale studies of energy efficiency. The primary barrier is insufficient implementation of existing cost-efficient technologies.”128 The IEA observed that “the existence of a number of barriers that discourage decision makers, such as households and firms, from making the best economic choices”.129
As noted in the previous section, APEC members have invested considerable efforts in the promotion of energy efficiency. The wide-range of government energy efficiency policies and initiatives implemented can be broadly classed under three types of policy or regulatory instruments: subsidies, technology or performance-based standards, and information and labeling programs.
Subsidies
Governments in the region have implemented a range of financial incentives and other subsidies such as cash grants, cheap credit, tax exemptions and co-financing with public-sector funds to encourage a range of energy efficiency initiatives across several sectors. Subsidies for building retro-fit and home insulation, tax exemptions or cash grants for upgrading of industrial machinery, subsidies to households and firms to purchase energy efficient appliances, heating or air-conditioning systems and other equipment are typical examples.
Another rationale for government subsidies and financial incentives for encouraging energy efficiency investments relates to the claim that consumers have high discount rates – that is, they typically put too little weight on future energy savings, and too much on upfront costs, when buying energy efficient appliances. Uncertainty over future energy savings, hidden costs such as costs of searching new products or reductions in other desirable product characteristics, the irreversibility of investments and the associated option value of waiting, are some of the reasons offered by economists to explain high discount rates.
Mandated Standards
Governments have implemented a vast array of standards based on technology or performance-based criteria to promote energy efficiency. Building codes, minimum energy performance standards for energy-using consumer durables, and standards for fuel efficiency in automobiles in the US are some of the more obvious examples of government-mandated standards. These standards are usually implemented on the basis of cost-benefit analyses which purport to show net benefits which result from restricting private choices by mandatory standards.
Labels and information programs
There is a class of market failures arising from information asymmetry, where one party to a transaction has more or better information than the other party. The principal–agent problem describes a situation where one party (the agent), a builder or landlord, decides the level of energy efficiency in a building, while a second party (the principal), such as the purchaser or tenant, pays the utility bills.130 A first-best policy solution for this sort of market failure could be the provision of credible information by a disinterested 3rd party (possibly a government agency) about a building’s energy attributes, so that buyers or renters can credibly ascertain the present value of net energy savings (under given fuel price scenarios).
Perhaps the most fundamental observation on optimal energy efficiency policy is that energy conservation cannot be mandated or imposed centrally, but requires information and incentives to be provided to energy users who make their own choices and adjustments. If households and firms are poorly informed about energy efficiency improvements that can be profitably exploited, an information disclosure policy is appropriate. It thus behooves analysts to assess government energy efficiency policies with a high degree of clarity as to what constitutes costs and benefits as perceived by private decision-makers, and why they could systematically diverge from expert views of costs and benefits.
“Energy efficiency” is strictly an engineering concept, measuring the ratio of output of final or useful energy to a unit of fuel input. In this sense, “maximizing energy efficiency” is different from and not necessarily consistent with what economists mean by economic efficiency. Energy efficiency should not be considered a goal in itself, but a means of achieving economically efficient resource allocation.131 If energy use leads to GHG emissions, then the appropriate policy tool would be to apply a tax or a cap-and-trade scheme on the energy input equivalent to the harm that such emissions are expected to cause (see the discussion on social costs of carbon in the next section). In the analysis of the various behavioral attributes of individual decision making in energy technology choices, it is important to note that there may be instances where no necessary policy or regulatory implications emerge.
iv. Electric Vehicles in Road Transport
Numerous economies, including some APEC members, have proposed future bans on the sale of ICE vehicles to promote the purchase and use of electric-powered cars. Given that transport accounts for almost a quarter of carbon emissions -- the second most important carbon-emitting sector after the power and heat generation sector – many have adopted a number of policies such as subsidies for BEVs, higher taxes for fuel and/or ICE vehicles, tax-payer funded charging stations and other policies to encourage BEVs.
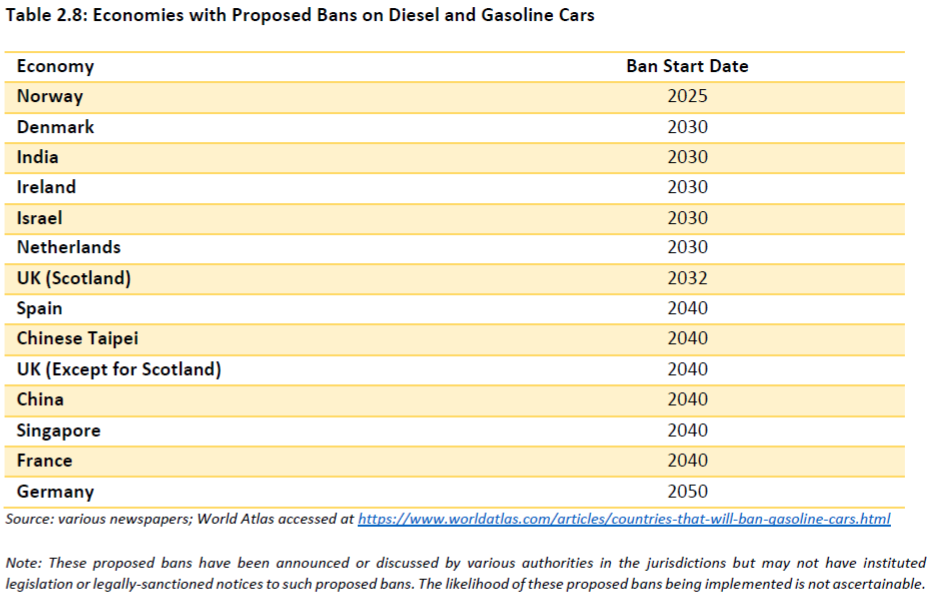
There is currently much optimism about the prospects for EVs to replace the internal combustion engine in passenger transport. There are a range of forecasts for BEVs or Plug-in Hybrid Electric Vehicles (PHEVs), some of which are driven by the expectations of very aggressive emission mitigation policies being adopted worldwide. Nevertheless, there are more skeptical views that suggest the disadvantages of EVs such as limited driving range long charging times and high costs will limit the uptake of EVs and suggest a far longer period for its use to become pervasive (see Table 2.9).
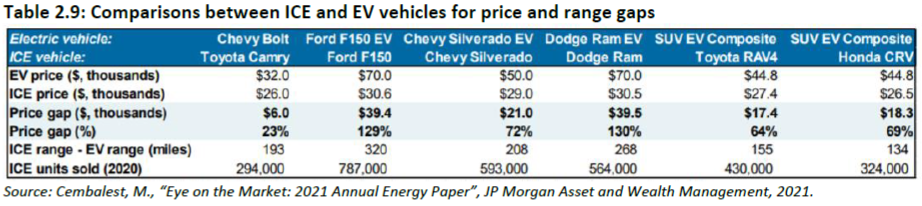
Figure 2.12 provides various forecast EV sales as percentage of total vehicle sales. At the more conservative end, Exxon forecasts that EVs will constitute 30% of new vehicle sales by 2040. At the other end, the most optimistic scenario is by the IEA in its “net zero by 2050” scenario which forecasts 60% of all new vehicles by 2030 will be made up of EVs.
There is a significant body of research that that suggests that the replacement of conventional fossil-fueled cars with EVs would likely have a relatively small impact on global emissions.132 There are two aspects to this question. The first relates to the source of electricity used to charge EV batteries and the second relates to “full-cycle costs”. If the electricity used to charge an EV battery is produced by wind, nuclear, solar, or hydro power, then the CO2 emissions will be significantly lower than those from ICE vehicles. However, if the CO2 emissions from electricity production are high, then driving an EV could well increase total CO2 emissions, and would imply that shifting emissions from the tail-pipe of the vehicle to the power station does little for emission mitigation.133
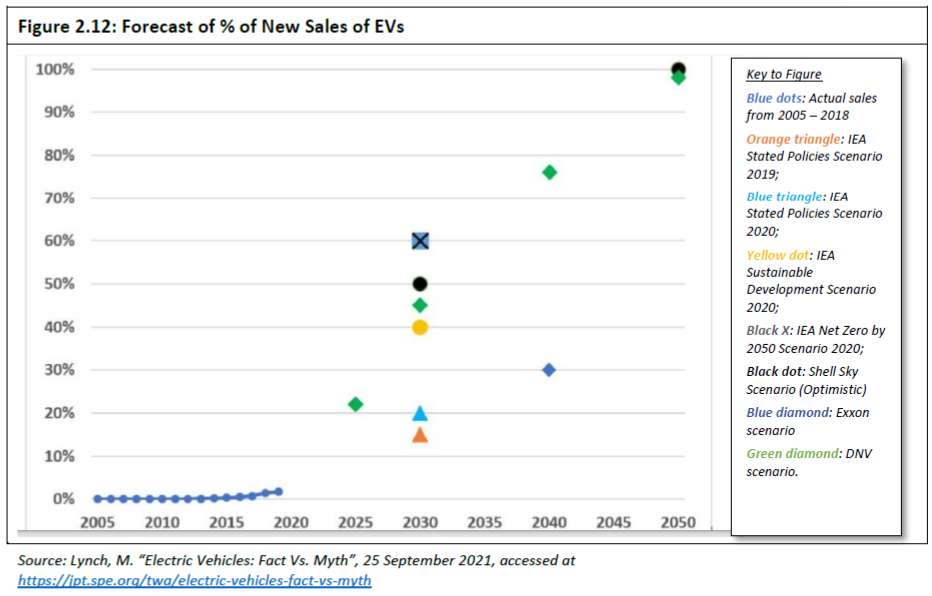
A further consideration often ignored is that the most important component in the EV is the lithium-ion rechargeable battery which relies on critical mineral commodities such as cobalt, graphite, lithium, and manganese. When tracing the extraction and processing costs of these minerals, in what is called full-cycle economics, it becomes apparent that EVs create heavy demand for mining and processing of minerals upstream. A recent United Nations report warns that the raw materials used in electric car batteries are highly concentrated in a small number of economies where environmental and labor regulations are weak.134 Thus, battery production for EVs is driving a boom in small-scale or “artisanal” cobalt production, which can account for up to a quarter of its production in some economies (such as in Congo), have been found to be dangerous and employ child labor.135
In 2020, there were 7.2 million battery EVs constituting about 1% of the total vehicle fleet.136 The scale of mining for raw materials involved in replacing the world’s gasoline and diesel-fueled cars with EVs is vast. For example, Professor Michael Kelly estimates that if we replace all of the UK vehicle fleet with EVs, assuming they use the most resource-frugal next-generation batteries, we would need the following materials: about twice the annual global production of cobalt; three quarters of the world’s production lithium carbonate; nearly the entire world production of neodymium; and more than half the world’s production of copper in 2018.137
A major report recently issued by the IEA on the mining and refining of critical minerals required not only for EVs but also for solar and wind power components concludes that current plans for EVs, along with those for wind and solar, will require a 300% to 4,000% increase in global mine output for the necessary range of key minerals138. According to consultants Wood MacKenzie, if EVs constituted 10% of the global vehicle fleet, up from less than 1% currently, demand for mineral commodities would reach “untenable levels”.139 The vast increases in the supply of the raw materials listed above would go far beyond known reserves. An increase in the global demand for minerals and rare earths needed for wind and solar energy components and electric vehicle batteries would lead to supply responses which may have differential impacts upon various APEC economies. Those APEC member economies that have resource endowments which include such minerals and rare earths such as Australia, Canada, the US, Russia, the Philippines and Papua New Guinea would benefit from the rents derived from an increasing demand profile. In this context, the need for transparency and appropriate governance of mining operations from the standpoint of environmental, social and governance aspects (such as human rights, youth and gender outcomes, employment conditions, etc.) would present a critical role for the APEC and G20 forums to cover and report on.
v. Carbon Capture and Storage
In terms of mitigating CO2 emissions, the implementation of carbon capture and storage or sequestration (CCS) technology has much appeal. If the capture and long-term sequestration of emissions were economically scalable, the continued use of fossil fuels, and modern industrial civilization with existing technologies could theoretically be sustainable in the long run. There would not arise the need for a vast and wrenching industrial transformation – with all the challenges it would pose to human behavior and long held expectations of increasing affluence especially in the developing economies -- as discussed above.
However, the technology for CCS is far from demonstrated and despite significant investments in R&D for a range of CCS technologies (such as direct air carbon capture), there exist few projects in the world today.140 After over two decades of R&D and support for “demonstration” plants, by the end of 2020 carbon capture and storage (CCS) facilities stored just 0.1% of global CO2 emissions.141 Many projects faced cost overruns, outright failure of high profile projects such as the Kemper plant in Mississippi142, the withdrawal of financial support by government (e.g. FutureGen),143 and high profile failures in the oil and gas sector.144
The key hurdle is the 15–30% of energy that is consumed to capture CO2 from the power plants; the costs make the economics unfeasible.145 The next stage, after capture, is storage, and this requires suitable geological sites such as saline aquifers or abandoned oil fields. The risks of storage leaks and liability issues constitute further hurdles to successful projects.
More R&D into CCS has been widely called for, despite the decades of research and investment already undertaken with few results.146 While the direction of technological advances in any endeavor can never be determined in advance, it is interesting that a leading investment bank would make this skeptical assessment of the many claims made for the outlook for this technology: “The highest ratio in the history of science: the number of academic papers written on CCS divided by real-life implementation of it.”147
vi. Hydrogen
The appeal for hydrogen as a means of mitigating carbon emissions, as with CCS, lies in its apparent simplicity. Instead of combusting hydrocarbons (fossil fuels) we can leave out the carbon part, burn just the hydrogen and emit nothing but pure water vapor. The idea of replacing fossil fuels with hydrogen is not new, and President George W. Bush mentioned the coming “hydrogen economy” in his 2003 State of the Union Address where he launched his Hydrogen Fuel Initiative.148
In March 2019 the Government of Japan released its third Strategic Roadmap for Hydrogen and Fuel Cells which would increase domestic uptake of hydrogen as a viable way to increase its energy self-sufficiency; decarbonize its economy; increase industrial competitiveness; and position Japan as a fuel cell technology exporter.149 In its 2019 National Hydrogen Strategy, Australia outlined goals to become a major producer and exporter by 2030.150 The European Commission’s 2020 economic recovery plan “NextGenerationEU” describes hydrogen as “an investment priority to boost economic growth and resilience, create local jobs and consolidate the EU’s global leadership.”151 In August 2020, Saudi Arabia announced a $5 billion hydrogen plant – the world’s largest clean hydrogen plant to date. During the past year, both Saudi Aramco and the UAE’s national oil company ADNOC have completed shipments of ‘blue ammonia’ to Japan. These shipments, seeking to prove the concept, were produced from hydrogen with carbon capture, combined with nitrogen to produce ammonia as a carrier fuel.
International enthusiasm for the “hydrogen economy”, thus, is very high. There are over 30 economies with hydrogen roadmaps, 228 large-scale hydrogen projects announced with 85 per cent located in Europe, Asia, and Australia, and with more than $300 billion earmarked for spending through 2030.152 The enthusiasm for the “hydrogen economy” across the world is evidenced by the large funding provided to R&D focused on hydrogen production and transport. Figure 2.13 provides estimates for the R&D expenditures across key economies that have been interested in this technology from early on.
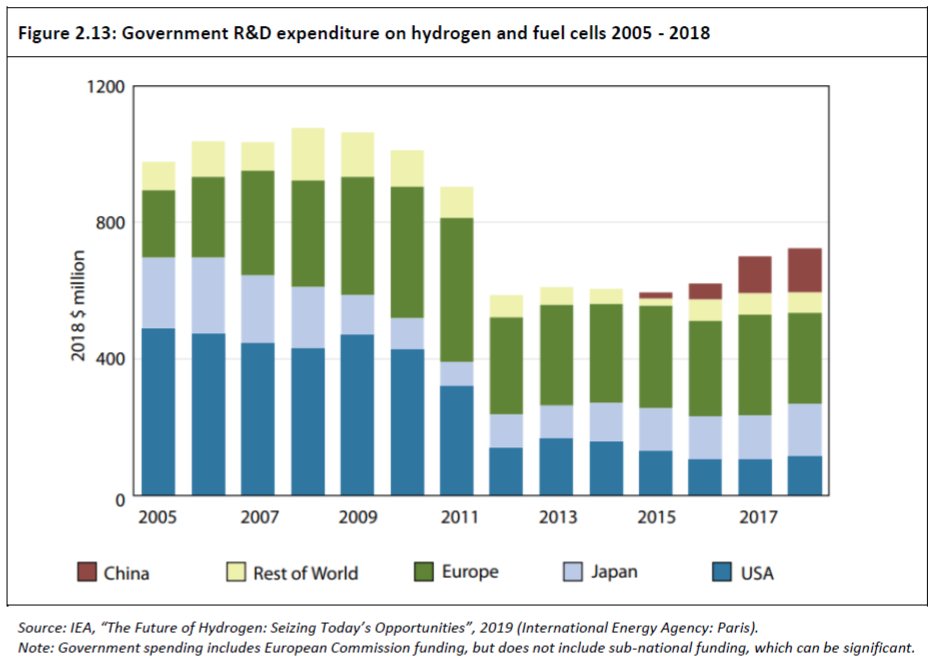
The term “hydrogen economy” is used to cover the uses of hydrogen as the main fuel for heat, vehicles, energy storage and the long-distance transport of energy.153 The reforming of methane to extract hydrogen, as already mentioned, emits carbon dioxide and so requires CCS which is not only prohibitively costly but unproven at the required scale (see the previous section). Hydrogen produced via stream reforming with CCS to capture the CO2 that is emitted is termed “blue” hydrogen. The other method of extracting hydrogen is electrolysis of water which is exceedingly inefficient, expensive, and energy-intensive. Producing green hydrogen is characterized by high capital expenditure, low productivity, and significant energy losses.154 For instance, it is estimated that generating enough green hydrogen to meet a quarter of global energy needs would take more electricity than the world generates today from all sources combined.155
Estimated abatements costs of carbon emissions by the hydrogen route is far in excess of the social cost of carbon estimated by the extant climate-economy models employed by the IPCC (see discussion in Section 3a). In other words, extracting, transporting, and using hydrogen costs more than the human welfare benefits it implies by reducing carbon emissions. The empirical evidence thus suggests that attempts to create a “hydrogen economy” fails the cost-benefit test and hence is economically infeasible at the current state of technology.156 Hydrogen economy advocates argue that to make hydrogen feasible ‘demand needs to be created to drive down costs, and a wide range of delivery infrastructure needs to be built’.157 They argue for US$150 billion in cumulative subsidies to 2030. Modelling undertaken in Australia suggests a limited role of hydrogen until the cost falls significantly.158 One of the reasons given by the authors of the Australian study for their result is the lack of a carbon price or equivalent market signal for activities other than renewable electricity production that would bring forward investment in zero-emission technologies at scale.
3. Carbon Markets, Carbon Prices and Carbon Trade Border Adjustments159
Many Parties communicated in their NDCs for the COP26 summit on the need for carbon pricing in their targets for emission reduction.160 Almost all Parties provided information on “voluntary cooperation”, with the share of Parties stating that they plan to or will possibly use some form of voluntary cooperation more than doubling since their previous NDCs.161
One of the keys to increased ambition expected of Parties under the Paris Agreement at COP26 lies in the implementation of Article 6 of the agreement.162 Article 6 aims at assisting governments in implementing their NDCs through voluntary international cooperation. This cooperation mechanism, if properly designed, should make it easier to achieve emission reduction targets and raise ambition. In particular, Article 6 could also establish a policy foundation for an emissions trading system, which could help lead to regional and global prices on carbon. Given that projected climate change damage imposed on life and property in any location is independent of the actual site of carbon emissions anywhere on the planet, it makes sense to reduce emissions where it is cheapest irrespective of location.
The rationale for Article 6 is that the joint implementation of projects between industrialized and developing economies would offer the benefits of lowering costs of emission reduction since it is typically cheaper to curb emissions in developing economies than in the developed ones which have already reduced emissions wherever it was affordable to do so. It would also lead to technology transfer and financing opportunities. Financially-constrained developing economies would have incentives to participate via Article 6 in promoting GHG emission reduction projects which can qualify for audited and certified “carbon credits” which can then be sold to developed economy buyers who exceed their allowances.
Article 6 of the Paris Agreement parallels the Clean Development Mechanism (CDM) which was designed for non-Annex 1 economies under the previous Kyoto Protocol. While non-Annex 1 economies did not have GHG emission restrictions, they had financial incentives to participate via CDM in promoting GHG emission reduction projects in their economies (against an agreed BAU projections).163 Carbon market mechanisms can allow businesses to trade both carbon credits and carbon offsets within economies and across borders.164 The potential terms of this trade are outlined in Article 6 of the Paris Agreement but issues over measurement, reporting, and verification (MRV) have meant that no proposals have been accepted by all Parties to date.
Under Article 6, businesses in economies with low emissions would be allowed to sell their excess allowances to larger emitters from other economies, with an overall cap of carbon emissions, ensuring their net reduction. In a fungible international market for carbon credits, supply and demand for such credits would lead to the establishment of a global carbon price that would tie the negative externalities of carbon emissions to those responsible for such emissions. Through this approach, it is argued, carbon emissions would undergo a strong decline, coupled with incentives for innovative and cleaner technologies and an overall transition towards a low-carbon economy at a global level.
a. Global Integrated Assessment Models and the Social Cost of Carbon
Estimates of the costs and benefits of carbon pricing at the global level are based on large Integrated Assessment Models (IAMs) which require a large data base and set of assumptions that tie together climate change processes with human economic activity (a climate science model) to measure tangible costs and benefits to human welfare (an economic model) of various levels of greenhouse gases cumulated into the atmosphere over the very long run (over the next 50 – 100 years and beyond).
Many IAMs have been built and used to estimate the social cost of carbon (SCC)165 and evaluate alternative emission abatement policies. These models have crucial assumptions and sensitivities that affect causal relationship between human activity (including the combustion of fossil fuels), climate change and human welfare that make their use as a basis for policy proposals extremely contentious. For the purposes of this paper, it is important to emphasize that the global costs and benefits of carbon pricing are subject to many assumptions and uncertainties. IAM-based analyses of climate policy may create a perception of knowledge and precision, but that perception may be illusory and misleading.166
Despite the deep uncertainties inherent to IAMs, it is nevertheless instructive to use an example such as William Nordhaus’ Dynamic Integrated Climate-Economy (DICE) model that “integrates in an end-to-end fashion the economics, carbon cycle, climate science, and impacts in a highly aggregated model that allows a weighing of the costs and benefits of taking steps to slow greenhouse warming."167 According to Nordhaus, the net benefits of an optimally calibrated carbon tax that is simultaneously implemented by all governments around the world, and is maintained at the (time-varying) optimal level through the year 2100 is $3 trillion. It is also clear from the Nordhaus model that a misapplication of carbon tax or an emission trading scheme (ETS) can lead to very high net costs. Indeed, overly high taxes can be worse than no tax at all.
This brief discussion of IAMs suggest that in discussions of costs and benefits of market-based instruments to promote a sustainable low-carbon energy transition path, sufficient care be taken to ensure that steep costs are not imposed by policies that are based on faulty modelling or wrong (or extreme) assumptions. The Nordhaus model base case, for instance, projects a net benefit of $3 trillion with relatively modest initial carbon prices increasing over time. This provides a basis for attempting to make reasonable policy proposals for some level of carbon tax (or a comparable ETS system), even if it is at relatively low levels. The policy lesson, in the context of uncertainty in the modelling of complex systems, would be to “do no harm” in the first instance, by avoiding premature energy transitions effected at great cost by putting too high a price on carbon.
b. Market Based Instruments vs. Discretionary Instruments
Respondents to PECC’s survey tended to focus on APEC’s traditional areas of work, i.e. reducing barriers to trade and investment in renewable energy components and equipment in the region. This is an issue APEC members have a clear track record on with their commitment to reduce tariffs on a specific list of environmental goods in 2012. With the rapid developments in technology this list may be out of date and need revisiting. A further issue that needs to be explored is what constitutes an environmental service.
After work on APEC’s core area of trade came work to reduce environmentally harmful fossil fuel subsidies. These have been previously discussed in this chapter.
There was some significant difference on specific issues, for example while 84 percent of respondents from Pacific South America and 77 percent of Southeast Asian respondents thought that it was important or very important to “Adopt a region-wide set of principles for Environment Social and Governance (ESG) disclosures”. Only 50 percent of North American respondents thought it was important or very important.
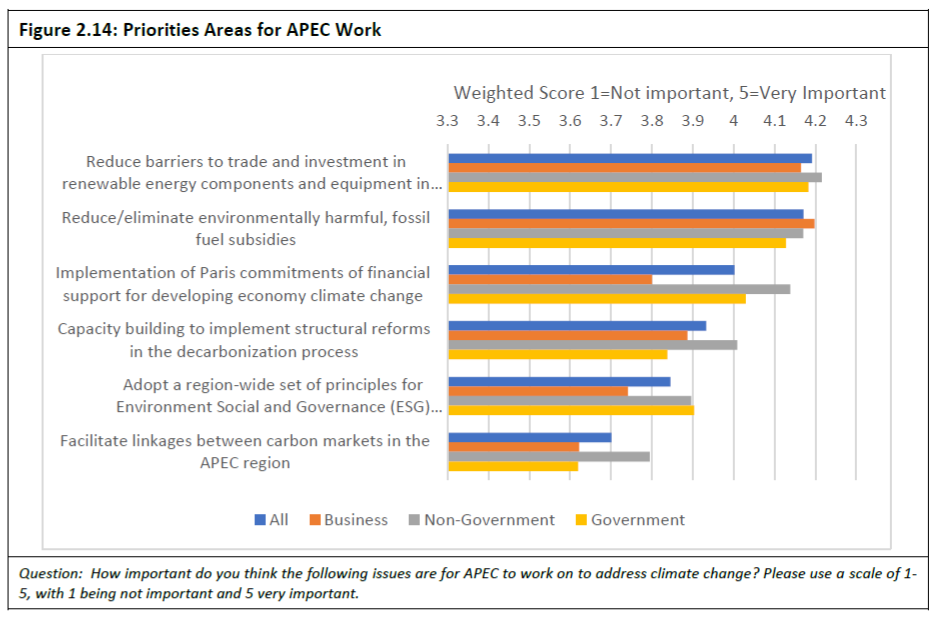
There are two categories of government actions that guide de-carbonization: market-based instruments (MBIs) and direct regulations. Market-based instruments are regulations that encourage human behavior through market signals rather than through explicit directives regarding pollution control levels or methods. It is well established among economists that MBIs such as carbon prices - imposed via taxes or some form of cap-and-trade scheme - are far superior to direct regulations that governments may impose, such as technical or engineering performance criteria for appliances, machinery, buildings, and cars. Greenhouse gas emissions are best controlled by putting a price on such emissions and allowing markets to find the lowest-cost solutions to reducing emissions.
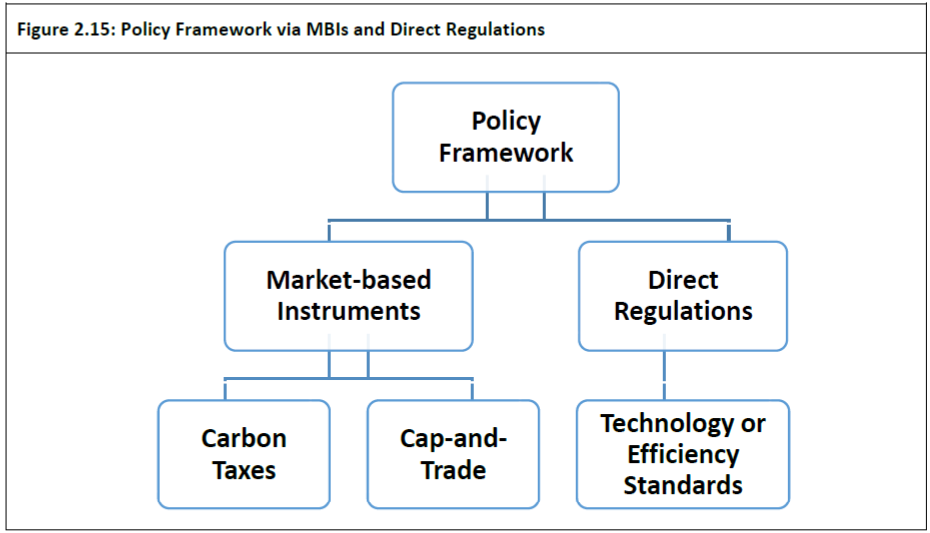
Direct or “command and control” regulations include instruments such as permissions, prohibitions, standard setting, and enforcement as opposed to financial incentives. The potential benefit of using direct regulations to achieve a narrow objective. This may be useful when the threat of environmental damage is very specific (e.g., in the handling of radioactive waste).
The benefit of incorporating market signals into policy design is that it provides firms with greater flexibility in determining how they can best achieve the environmental objective. This flexibility provides incentives for greater pollution reductions in firms with lower abatement costs and lead to equalization of marginal abatement costs across all market participants. By contrast, direct regulations that set uniform standards on technical criteria are likely to impose higher costs on the economy, since firms with high abatement costs have to make the same reduction in emissions as firms with low abatement costs
MBIs use market signals to change behavior. Two alternative MBIs—a cap-and-trade system and a carbon tax have been applied in different economies, sometimes in combination rather than as mutually-exclusive alternatives. Cap-and-trade program sets the quantity of emissions during a fixed time period, letting the price of allowances to be discovered in the marketplace. A carbon tax sets a price on emissions, which provides an incentive for emissions reductions, but the actual amount of reduction that occurs can only be determined ex post.
In any emission reduction program facing government planners, whether through voluntary unilateral schemes or through international agreements, achieving emission reduction targets at least-cost is clear-cut in principle. The test of economic efficiency is the same, irrespective of the choice of market-based tools, namely carbon taxes or cap-and-trade pricing for carbon allowances. To achieve economic efficiency, marginal abatement costs of each of the sectors and industries is equivalent across sectors and industries. In a free market for greenhouse gas (GHG) abatement investments, private capital will flow to areas where returns (adjusted for risk) to emission-reducing investment are highest, thus fulfilling the efficiency criterion.
Both methods (tax or cap-and-trade) correct a market failure, as GHGs constitute an unpriced externality; that is, those responsible for GHG emissions do not have to pay for the damages they impose on the global environment, and the failure to internalize these costs in their economic behavior lead to higher levels of emissions than is socially optimal. Both instruments put a price on carbon (or GHG),168 and by establishing this price they create market incentives to develop and invest in emission-reduction technologies. Both systems require monitoring, reporting, and verification (MRV) systems in place.
To the extent that the ultimate objective is to set an optimal path of emission reduction to reach a target end-state of stabilized and reduced emission rate (say by 2030 or 2050), the cap-and-trade solution is the correct one. It achieves an environmental goal, but the cost of reaching that goal is determined by market forces. In contrast, a tax provides certainty about costs of compliance (assuming that the tax policy itself is stable and durable over the long run), but the resulting reduction in GHG or carbon emissions cannot be predetermined.
Revenue-Neutral Carbon Taxes
In order to get buy-in for a carbon-tax in the US, revenue-neutral carbon taxes have been recommended in the US in a bi-partisan approach to environmental policy by George Schultz and James Baker III.169 This idea is not new and was previously proposed in another bi-partisan approach supported by Arthur Laffer and Bob Inglis (a House Representative from South Carolina) in 2008.170
There are a number of jurisdictions where carbon taxes or revenues raised by selling emission allowances in ETS are used to fund various beneficiaries. For instance, the ETS in Guangdong is meant to support investments in energy efficiency and renewable energy initiatives; in Oregon, the proposed ETS will fund dividend payments to residents of the state.171
Whether the “double dividend” of green taxes is forthcoming or not is thus a function of the prior tax system and how carbon tax revenues are re-cycled. The narrow base of green taxes is an “inherent efficiency handicap”, and according to one of the authors of the study the “bulk of existing research tends to indicate that even when revenues are recycled in ways conducive to a double dividend, the beneficial efficiency impact is not large enough to overcome the inherent handicap, and the double dividend does not arise”.172
A second problem is related to the estimated social cost of carbon (SCC) which is used as the basis for applying the optimal level of carbon tax.173 As measures of SCC are typically derived from IAMs such as Nordhaus’ DICE Model, the same problems of interpretation and validation that apply to IAMs also apply to estimates of the SCC. Even though the SCC serves as the text-book measure of the optimal Pigouvian externality tax, this only holds in the case where all parties apply a similar carbon tax.
But when carbon leakage occurs, the SCC is over-stated. Thus, in the Nordhaus DICE model, if only half the world adopted a carbon tax, then the economic cost of achieving the same emission mitigation targets would increase by 250%.174 It is thus inappropriate to conclude that an optimal tax to be levied by governments should be equal to the best estimate of SCC in the case where carbon leakages occur. Thus, Murphy concludes that “ [i]f we ignore the problem of leakage, then we will overestimate the true social cost of additional emissions in the regulated jurisdiction, and consequently the introduction of a carbon tax calibrated to the global SCC will be too high”.175 In this context, when it is not apparent that all jurisdictions will jointly adopt a similar carbon tax globally, it would be inappropriate for most governments, representing their own citizens, to implement carbon taxes equal to the SCC unilaterally.
Pre-existing energy-related regulations such as gasoline taxes, renewable portfolio schemes (RPS) feed-in tariffs (FITs) and other subsidies for renewable energy technologies interact in complex ways with the imposition of a carbon tax. The regressive nature of carbon taxes generally, given that poorer households devote a larger portion of their budget to energy-costs such as transport and utility bills, adds a further complication to carbon tax proposals. In the context of governments needing political buy-in for carbon tax or ETS legislation, compensatory schemes for poorer households may be a critical requirement.
c. Existing Carbon Pricing Schemes and Trends
As of early 2021, there were 64 national and subnational initiatives at carbon pricing; the represents a 64% increase since January 2015, when the number was 39.176 The share of global emissions under carbon pricing has increased 12% in 2015 to 21.5% (see Fig. 2.16).
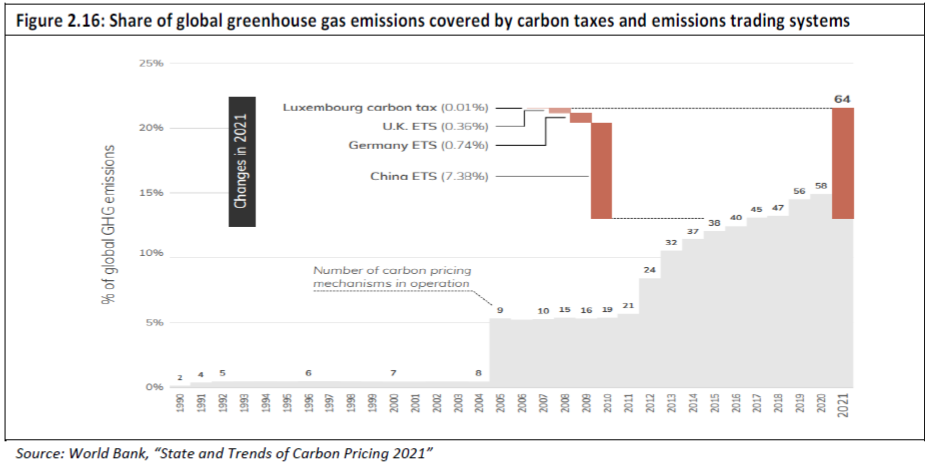
The carbon prices in these different initiatives range widely, from less than $1/tCO2e (tons of carbon dioxide equivalent) to over $130/tCO2e (see Fig 2.17). It should be noted that in most cases, carbon prices are relatively modest. A majority of carbon prices still remain far below the US$40–80/tCO2e range which the World Bank suggests is needed in 2020 and $50 – 100/tCO2e by 2030 to meet the 2°C temperature goal of the Paris Agreement.177 Only 3.8% of global emissions are covered by a carbon price at and above this range $40 - 80/tCO2e in 2021. According to the World Bank, “even higher prices will be needed over the next decade to reach the 1.5°C target”.
Among the APEC member economies, the following jurisdictions have instituted either carbon taxes or ETS as of April 2021 (see Figure 2.17): Canada, as well as Quebec, Nova Scotia, British Colombia, New Brunswick, Newfoundland, Labrador, Alberta, Northwest Territory, Saskatchewan, Prince Edward Island (in Canada); Chile; Beijing, Fujian, Guangdong, Hubei, Shanghai, Shenzhen, Tianjin (in China); Japan, Tokyo, Saitama (in Japan); Mexico, Zacatecas, Tamaulipas (in Mexico); New Zealand; Singapore; South Korea; Massachusetts, Baja California, California, RGGI (a carbon emissions trading scheme covering 11 states in Eastern U.S.) (in the USA).178 The recently announced China national ETS and the Mexico pilot ETS are not shown in this figure as price information for both of these are not available. It should also be noted that the carbon prices shown in the chart are merely illustrative. The prices in different jurisdictions are not comparable between carbon pricing initiatives because of differences in the sectors covered, allocation methods applied, specific industrial or sectoral exemptions, and different compensation methods.
China’s experiment with carbon pricing through ETS across several cities and provinces seem to be especially interesting, given its status as the world’s largest emitter. China’s long-expected carbon emissions trading scheme became operational in July 2021. Though at its initial phase, it is the largest ETS in the world, covering more than 2,000 entities with aggregate annual emissions exceeding 4 billion tons of CO2 equivalent. The economy-wide carbon market has been publicized as a tool to promote China’s commitment to peak carbon before 2030 and achieve carbon neutrality before 2060.
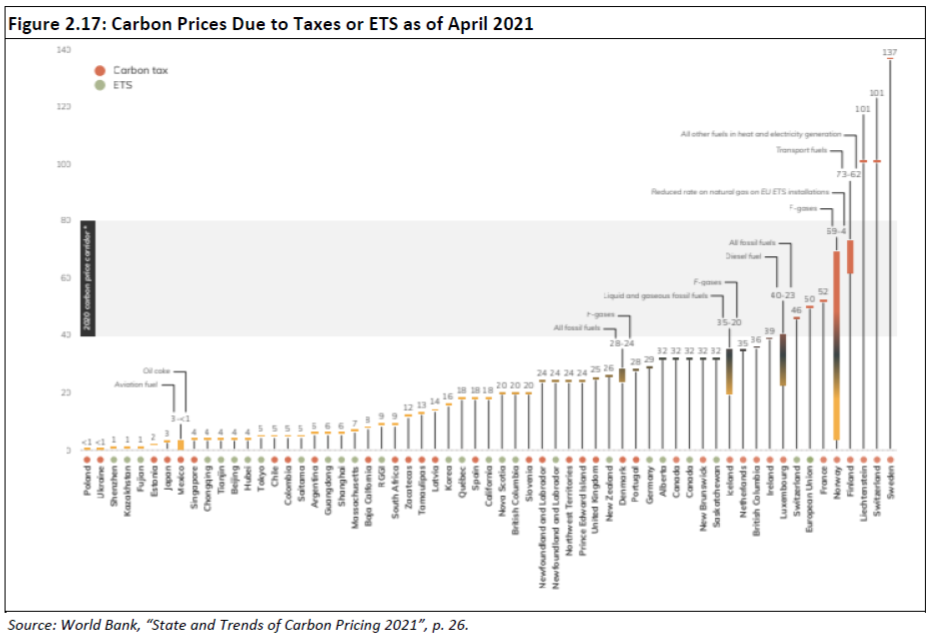
Similar to other emissions trading schemes it is a market-based government carbon-pricing scheme. China’s ETS has a flexible emissions cap that can go up or down from year to year, depending on the output of the regulated sites. The scheme is initially limited to electricity generation and power plants serving industry – but this still covers 15 percent of global CO2 emissions according to analysis by Carbon Brief.179
Private Sector Engagement
The interest in carbon pricing has not been restricted to governments. There is evidence of a growing engagement by the private sector. The corporate sector is increasingly using internal benchmark carbon prices as a tool for business decision making and to identify low-carbon investment opportunities. For instance, in the lead up to the Paris Agreement in 2015, ten large international oil and gas companies (IOCs) called on governments represented at the UNFCCC to introduce carbon pricing consistently and coherently.180 Growth in voluntary corporate commitments is the main driving force behind increased carbon credit demand. As of October 2020, 1,565 companies across all continents had adopted commitments to reduce their emissions to net zero.181 About half of these companies have expressly indicated their intent to rely at least partially on carbon offsetting to achieve their targets.
According to the World Bank, nearly half of the largest 500 companies in the world by market cap report the use of an internal carbon price or the intention to use one within the next two years.182 Internal carbon pricing is also being triggered by corporate climate governance initiatives. The Task Force on Climate-related Financial Disclosures (TCFD) — an initiative endorsed by over 1,900 organizations — encourages companies to issue climate-related financial disclosures and use internal carbon pricing to measure exposure to climate-related issues. The majority of the median internal carbon prices remain below the US$ 40–80 per ton price range that the World Bank asserts is required to meet the temperature goals of the Paris Agreement.183 Just over 16% of the companies use prices that fall within this range, and 9.8% use higher prices.
Internal carbon pricing benchmarks help companies translate carbon prices into normal business practice, gather internal management support for energy efficiency targets and achieve emission-mitigating targets. However, the lack of industry-wide carbon pricing methodologies and the lack of clarity and certainty in long-term government policy constrain many companies from effectively achieving best practice. Furthermore, internal carbon prices adopted for business planning purposes need to be high enough to cause a material change in investment decisions of firms in energy-intensive sectors. It should be noted that while participation by the private sector in using internal carbon prices to guide investments is important to promote low-carbon energy transitions, the context in which private sector participation is successful or otherwise depends on government policy stability and long-term credibility. Without a stable and credible emission mitigation policy over the long term, private sector efforts will inevitably be limited in their efficacy.
There are two other dimensions to business interest, beyond internal benchmark pricing. First, firms are making public commitments on their own future emissions trajectory. For example, BHP published its commitments on scope 1 and 2 and (partially) on scope 3 emissions. 184 It is driving business demand for reputable carbon credits, as part of the toolkit in how firms explain how they will achieve their commitments. This means that there will be an increasing focus on transparency and governance arrangements that are requisite to assessing the quality of carbon credits generated by private sector emission reduction activities.
Another recent example of voluntary private sector investments in carbon credit generation was provided by Shanghai Environment and Energy Exchange (SEEE) which issued the first carbon neutral petroleum certificate to Sinopec, Cosco Shipping and China Eastern Airlines on September 22 in Shanghai, China.185 Sinopec, Cosco Shipping and China Eastern Airlines have taken their respective advantages to jointly develop a “cross-industry, full-cycle and zero-emission path” to reach peak carbon emissions and achieve carbon neutrality in transportation and the energy sector.
Second, financial intermediaries are increasingly focused on the sustainability of the enterprises they lend to (discussed in Sections 4c and 4d below). This is another source of pressure on firms to show that they can decarbonize over time. These changes are profound in creating private demand (and supply) of carbon credits, beyond any government-mandated scheme. Government can play a role in supporting private markets in carbon – even without establishing an emissions trading scheme or baseline and credit scheme – by broadening the range of voluntarily-traded carbon credits, creating international access to credits, and making carbon credits easier to trade. In Australia, for example, the Clean Energy Regulator is broadening the range of methods for creating Australian Carbon Credit Units (ACCUs) and creating an exchange traded market for ACCUs, that will deepen markets in carbon offsets and support a forward market. Across 16 APEC economies, there are 18 commodity exchanges that have produced guides for listed companies. Among the most prominent reporting frameworks being used by these exchanges are the Global Reporting Initiative (GRI), the Sustainable Accounting Standard Board (SASB) and the Task Force on Climate-Related Financial Disclosures (TCFD).186
Voluntary Carbon Markets
There are a host of barriers to international trade in carbon markets. Market uncertainty is the key concern of any participant contemplating trading in new or untested carbon markets: is the underlying security (in this case, carbon credits) of requisite quality and does it have enough liquidity among other participants for it to be easily traded? For carbon credit quality, the importance of proper oversight and robust MRV systems in place is apparent. Transparent and credible MRV systems with comparable enforcement measures across jurisdictions to address compliance failures and fraud are a vital part of any viable international market in carbon credits. The presence of co-benefits that occur with reducing carbon emissions also needs to be emphasized. The immediate health benefits that accrue at the local and regional levels due to lower levels of sulphur and nitrous oxides and particulate matter that come about as a result of reducing GHG emissions can often be the major motivation for many economies in agreeing to participate in the Paris Agreement.187
The benefits of linking different ETS and carbon tax jurisdictions is related to the size and scope of the resulting common market. The greater the heterogeneity of abatement costs across jurisdictions, the larger the efficiency gains. The larger the sectoral and geographical scope of the linked market, the less the scope for carbon leakage as well. In theory, at the limit is a global uniform carbon price with unconstrained international trade in carbon emission credits. The maximum global benefit was estimated, for instance, by the Nordhaus DICE model discussed above. There are difficult technical and political challenges to linking various systems of carbon pricing into a broadly acceptable International Emissions Trading (IET) system. For instance, it is difficult to translate energy intensity targets and absolute emission reduction targets into a common metric without agreement on “business-as-usual” emission baselines.
Aligning different carbon pricing systems once they are operational is difficult. If ETS markets are not coordinated from the start, they reflect contingent local factors and socio-economic conditions which lead to heterogenous market structures and governance norms. Different carbon pricing systems and governance institutions may become too deeply entrenched for easy harmonization of rules to be achievable. In this context, the concept of carbon emission trading hubs might provide a more promising approach than “top-down” multi-lateral harmonization agreements.188 Carbon trading hubs provide a simple list of participation criteria and allow automatic membership so long as the criteria are fulfilled. For fungibility in the trading of emission reduction units, such units need to have a robust MRV system that assures that different jurisdictions offer units of equal mitigation value.
Nevertheless, different jurisdictions with varying standards of MRV and governance norms may yield emission reduction units that may differ in their implicit value in terms of mitigation. In this case, market mechanisms in carbon trading hubs can evolve a series of “exchange rates” or “discount factors” such that units from weaker jurisdictions have less value than those from jurisdictions that are perceived to be more robust and reliable. As suggested by one careful study, “units from systems that are considered insufficiently robust might thus be subject to a discount or disadvantaged exchange rate reducing their value for compliance in other systems without altogether sacrificing fungibility”.189 In Australia, the Clean Energy Regulator administers schemes legislated by the Australian Government for measuring, managing, reducing or offsetting Australia's carbon emissions, including the Emissions Reduction Fund (ERF). The ERF is a voluntary scheme that incentivizes organizations and individuals to adopt new practices and technologies to generate carbon credits. These credits are known as Australian Carbon Credit Units (ACCUs). In this example, the Clean Energy Regulator plays a role in certifying the quality of the carbon credits generated, taking into account external benefits such as biodiversity and the welfare of Aboriginal communities.190
Carbon trading hubs create incentives for different jurisdictions to improve environmental integrity so that their carbon units on offer may be traded without a penalty. Unlike the Australian example, where a regulator sets exchange rates between different carbon credits, voluntary trading hubs allow markets to establish premiums or discounts via market trading liquidity in various instruments including derivative markets in carbon markets (for example, derivatives in price differentials between various pedigrees of carbon credits generated). In Asia, trading and financial centers such as Hong Kong, China and Singapore may emerge as carbon trading hubs which make linked ETS jurisdictions more politically viable and quicker to implement relative to long and difficult multilateral negotiations necessary for top-down harmonization agreements. To this end, the Singapore government recently released the Singapore Green Plan 2030, setting out a path for the city-state to become a leading regional hub for carbon trading, green finance, consulting and risk management and other services.191 The Singapore initiative will seek to enhance the transparency, integrity, and quality of carbon credits to support voluntary trading at the proposed carbon hub.
d. Carbon Leakage and Carbon Border Adjustments
Among the most important policy concerns challenging the introduction of carbon pricing around the world is the issue of “carbon leakage”. Carbon leakage will doubtless also be a central issue at the UN’s 26th Conference of Parties (COP26) hosted by the UK when it meets in Glasgow in November. As discussed in the previous section, current efforts at carbon pricing are fragmented, and coverage and carbon prices vary significantly across national and sub-national jurisdictions. Carbon leakage occurs when differences in emission regulations across jurisdictions can lead to re-location of carbon-intensive industries away from those jurisdictions which have tighter restrictions on carbon emissions and towards those that have either laxer or non-existent emission regulations.
The assertion that carbon leakage has not been a major factor in OECD economies to date as made by the World Bank192 is contentious. Thus, for instance, the European Commission’s Executive Vice President Frans Timmermans said earlier in the year that “It’s a matter of survival of our industry. So, if others will not move in the same direction, we will have to protect the European Union against distortion of competition and against the risk of carbon leakage.”193
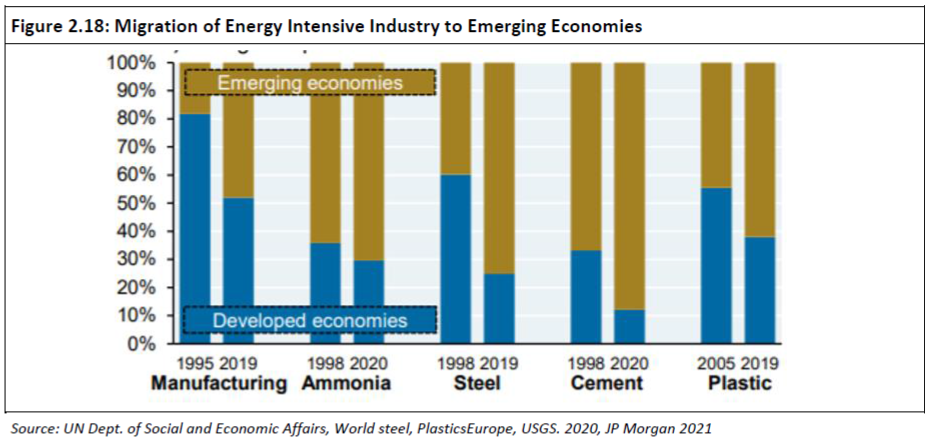
Carbon leakage effects are difficult to measure accurately, given that carbon costs are only one factor in a host of business costs and risks that firms take into account when deciding on the location of capital investments. Demand and supply conditions, costs of imports, exchange rates, taxes, quality of infrastructure and governance, ease of doing business, etc., are among the host of factors that come into play in business investment decisions. It is thus difficult to attribute any long-term business decision to a single factor such as a carbon price.
Different government authorities around the world have given assistance to industries deemed most vulnerable to cost pressures imposed by carbon pricing schemes. Korea’s and China’s national carbon market under ETS, for instance, are expected to grant free allowances to affected firms during the early phases of the ETS. The EU ETS phases 1 and 2 provided assistance via free allocations of emission reduction certificates on a “grandfathering” basis. Other assistance modes include output or sector benchmarking in California and New Zealand, rebates and subsidies in the UK, and exemptions based on administrative decision in South Africa.194 Each of these modes of assistance can be subject to perverse incentives and unintended consequences.
The question of how to assist firms faced with perceived threats to their viability due to carbon leakage might be less important than the question of how such assistance is demanded by constituents in the political process. “Integrated” measures of assistance are those where exemptions and state-funded assistance for affected constituencies are legislated as part of the overall package legislating for carbon pricing policy. These assistance measures are integrated into the basic enabling legislation for carbon pricing as part of political buy-in process in many legislatures. Sectors producing over 90 % of industrial emissions in the EU received all or most of their allowances for free in 2020.195
International cooperation as a direct means of alleviating carbon leakage and free rider incentives have long been part of the UNFCCC climate change negotiations. The principle was incorporated in the Kyoto Protocol via the Clean Development Mechanism (CDM) where carbon credits from verifiable emission mitigation projects in non-OECD developing economies (where abatement costs are typically far-lower) can be bought by firms in developed economies to fulfil part of their emission mitigation targets spelt out in the Protocol.196 In the lead up to the Paris Agreement, the principle for financial transfers from developed to developing economies to help the most vulnerable low-income economics prepare for mitigation and adaptation to climate change was incorporated “as a key provider of predictable financial resources in the post 2020-framework…[with] the introduction of a floor of US$100 billion annually on the level of climate finance” until 2025 and “acknowledges that climate finance needs to be further scaled-up”.197 Nevertheless, current progress in public climate finance commitments by the OECD members are modest and face serious challenges (discussed in Section 4 below).
We noted above the wide and varying levels of carbon prices and coverage. For such a heterogeneous system to be cost-effective globally, a key feature of any international cooperation would be trading and investment linkages among them. Such linkages imply “a formal recognition by a greenhouse gas mitigation program in one jurisdiction of emission reductions undertaken in another jurisdiction for purposes of complying with the first jurisdiction’s mitigation program.”198
In this context, an international policy architecture that incorporates mechanisms such as the CDM under the Kyoto Protocol could facilitate the establishment of a robust system of least-cost abatement opportunities that leverages private and public finance. China, for instance used CDM methodologies as a basis for issuing domestic emission reduction certificates and green bonds on the basis of CDM-type projects.199 The Kyoto Protocol experience with CDM promoted some level of harmonization of carbon pricing globally and leveraged private sector financial flows from the developed economies to develop emission reduction projects in low abatement-cost jurisdictions in the developing economies. Audited MRV procedures for such projects can help overcome political and sovereign risks faced by private sector investors.
The EU’s Carbon Border Adjustment Mechanism proposal
In any discussion of international cooperation, the unilateral imposition of “carbon border adjustment mechanisms” (CBAM) by economies participating in international trade is a contentious one. CBAM schemes are being proposed in a number of legislative and political forums as a means to mitigate competitiveness concerns and carbon leakage, and to help encourage jurisdictions with laxer emission regulations to adopt higher mitigation standards for their key exports. The actual design details of any particular CBAM legislation will determine whether such unilateral moves are WTO-compliant.200 There are risky and unintended consequences for the norms of international trade if any major trading economy or trading bloc were to unilaterally adopt CBAM policies unless a coalition of trading partners which accounted for a large proportion of trade in the affected industry or sector were to simultaneously adopt such legislation in common.
On March 10th, the European Parliament overwhelmingly endorsed the creation of a CBAM that would shield EU companies against cheaper imports from economies with “weaker” climate policies.201 The EU published additional climate policies on July 14th with its long-awaited package to make Europe carbon neutral by 2050.202 On July 19th, US Democrat legislators introduced a similar bill to tax imported goods for their carbon content sourced from economies that lack strict environmental policies.203
The EU’s CBAM would require importers of certain products to pay a charge reflecting the embedded carbon emissions of those products. After a pilot phase, running from 2023 to 2025, it would come into force in earnest from 2026, initially applying to imported iron, steel, aluminum, cement, fertilizers and electricity. Carbon leakage will doubtless also be a central issue at the UN’s 26th Conference of Parties (COP26) hosted by the UK when it meets in Glasgow in November. Kwasi Kwarteng, UK’s business secretary in the Boris Johnson government and host for the meeting, opined that “there will be a discussion about carbon border adjusting, carbon leakage. That has to be part of the multilateral discussion.”204
Under EU’s proposed CBAM legislation, foreign firms would have to provide carbon audits to report emissions to EU trade authorities.205 The complexity of the Brussels-concocted plan ensures that exporters to the EU will have their work cut out for them. Exporting firms will have to document detailed carbon audits on their emissions which would include calculating the percentage of emissions that are already covered by carbon taxes elsewhere (domestic and for imports which go into manufacturing the exports). If these complex and expensive analyses are beyond the compliance capabilities of firms, especially for small and medium-sized businesses, the EC will unilaterally establish carbon tariffs on the basis of the dirtiest 10% of European producers of the same good.
While CBAM might be seen as an enabler of climate ambition by its proponents in the EU and the US, it “is a horribly complex, legally questionable and politically explosive instrument” as one observer put it.206 Carbon trade tariffs would impose high costs on companies seeking to sell to the EU and will likely trigger challenges at the WTO. If such disputes intensify, tit-for-tat trade tariffs between advanced economies (if they adopt similar CBAM legislation) and developing economies could lead to the further unravelling of the liberal trading order which is already under significant challenges. On July 26th, China objected to the EU’s plan to impose the world's first carbon border tax, stating that it intruded climate issues into international trading norms, broke WTO rules and undermined prospects for economic growth.207
Earlier in April when it became apparent that both the EU and the US Biden administration were considering unilateral trade tariffs to enforce upon the world their own predilections to “fight climate change”, India also adopted a position similar to China’s. It issued a joint statement with the BASIC bloc — Brazil, South Africa, India, and China — calling CBAM “discriminatory” and expressing its “grave concern”.208 It is not just developing economies that oppose the EU’s CBAM plan. Australian Trade Minister Dan Tehan labelled carbon tariffs “a new form of protectionism”.209 Russia, like China, sees the CBAM as running afoul of WTO rules and had already made clear its views a year ago when the EU was mooting its Green Deal plans which included carbon tariffs. 210
In terms of policy instruments for addressing climate change carbon border taxes on imports were at the bottom of the list of respondents priorities but at the same time respondents also agreed that carbon border taxes are needed to account for differing climate change policies. These are not necessarily irreconcilable positions but we may well end up in a world of tit-for-tat reprisals. Not to mention running contrary to the very spirit of Article 4.3 of the Paris Agreement of “highest possible ambition, reflecting its common but differentiated responsibilities and respective capabilities”.
It is not clear whether the EU CBAM proposal is compatible with WTO rules. Apart from the UN climate body’s Article 4, there are other areas in which the proposed carbon tariffs may conflict with WTO trading rules. They may be found to contravene the WTO’s rule of non-discrimination, a mainstay of international trading norms which requires that any advantage granted to the imported products of one WTO member must be accorded immediately and unconditionally to like products originating from all other WTO members.211 Carbon tariffs could also be inconsistent with the WTO’s ‘national treatment rule’, another foundation stone of modern international trade under the WTO regime which requires that imported products be given “no less favorable” treatment than that given to like domestic products.212 If European producers continue to receive free emissions allowances (as they do now under the EU’s Emission Trading System), then the EU will be found in violation of the “national treatment” rule.
4. Green Finance
The investments required to transition the global energy system -- currently depending on fossil fuels for 85% of final energy consumption -- to “net zero by 2050” are immense. Estimates for “green finance” requirements vary widely. The IEA suggests annual investment in energy must increase from around $2 trillion (trn) per year now to $5trn by 2030, and then back down to $4.5trn by 2050.213 Another forecast from the Energy Transitions Commission, a group of multinationals committed to decarbonization, estimates net zero will cost an estimated $1.5-1.8trn every year until 2050.214 The International Renewable Energy Agency (IRENA) estimates a lump sum of $33trn over the period from now to 2050.215 These estimates should be treated with great caution as they embody a very large number of assumptions on a range of parameters such as future economic growth, technological change and social attributes. In particular, there is great uncertainty related to costs of new and emerging energy technologies which are not yet in commercial use, such as “green hydrogen” and CCS (discussed in Section 2).
a. Progress towards the $100 bn target
In the UNFCCC Conference (COP25) in 2019, the parties concurred in paragraphs 11 that
“Recalls the commitment made by developed country Parties, in the context of meaningful mitigation actions and transparency on implementation, to a goal of mobilizing jointly USD 100 billion per year by 2020 to address the needs of developing country Parties
Calls on international entities, including financial institutions, to continue supporting the development and implementation of measures to avert, minimize and address the adverse impacts of climate change”
Climate finance was already a critical element of international climate policy before the Paris Agreement in 2015 during the lengthy international negotiations process since the Kyoto Protocol – adopted in 1997 and entering into force in 2005.
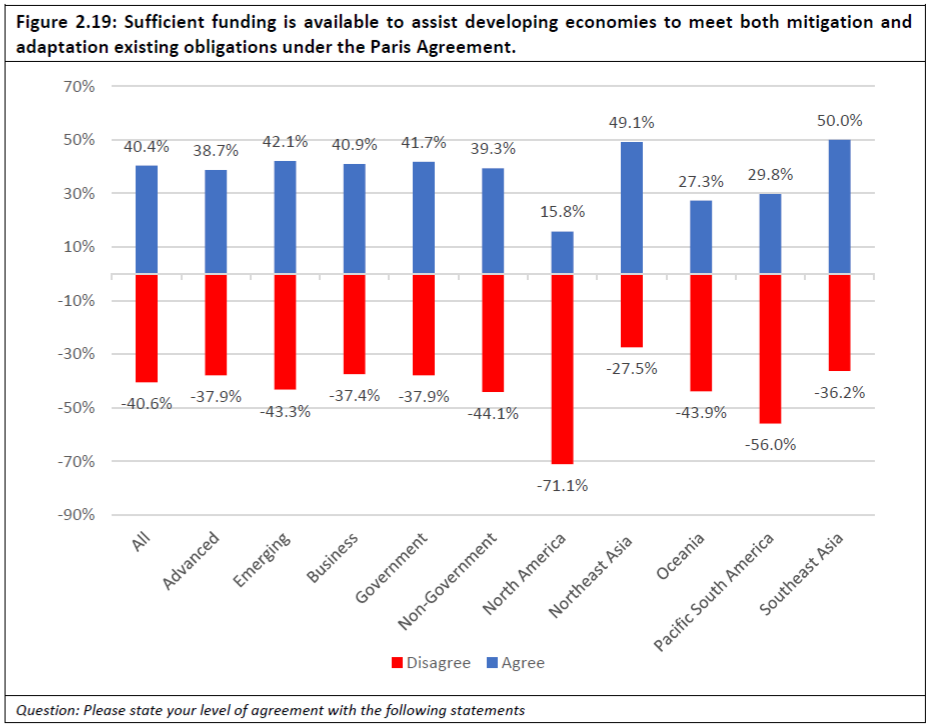
Views on whether sufficient funding is available to assist developing economies to meet both mitigation and adaptation existing obligations under the Paris Agreement were split across the region. While on balance respondents disagreed, the breakdown at the levels of development and sub-regional levels is revealing.
- North American respondents disagreed the most with the statement that sufficient funding was available
- Respondents from Pacific South America also strongly disagreed that sufficient funding was available
There was very little to divide those who agreed/disagreed on this issue looking at the issue from an advanced/emerging economy perspective.
At stake are not only questions on which economy (or group of economies) does what in curbing emissions and preparing to adapt to climate change impacts, but also which economies are net recipients of climate finance and which are net contributors and by what amount. In 2009, developed economies jointly agreed to raise US$100 billion per year in climate finance by 2020.216 Alok Sharma, the president of the 2021 UN climate conference (COP26 ) warned that a lack of financing puts the objectives of the conference, agreed in the Paris in 2015, at risk.217 Developing economies have also expressed their concern, “The Ministers expressed their deep concern on the insufficiency and inadequacy of the support provided by developed countries to date. The scale and speed of climate finance from developed countries has to increase considerably.”218
According to the OECD, climate finance provided and mobilized by developed economies for climate action in developing economies reached US$78.9 billion (bn) in 2018, up from US$71.2 bn in 2017 (see Table 2.10).219 An assessment conducted by the UNFCCC’s Standing Committee on Finance indicated that governments are “in the neighborhood of achieving the target” by the end of 2020.220
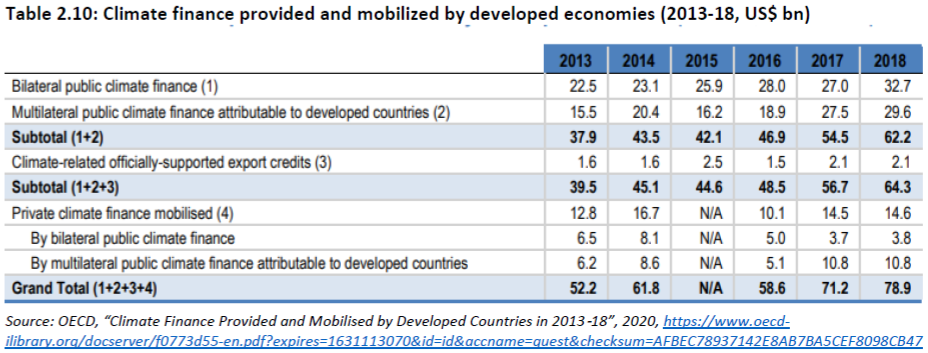
Assessing progress toward the US$100 billion target is contentious. However, the UNFCCC assertion of “being in the neighborhood” of achieving the target of $100 billion needs to be interpreted with caution. Given that the assessment depends on how climate finance is defined and that an agreed definition is lacking, it is indeed not possible to realistically assess climate finance commitments (let alone actual delivery) for mitigation and adaptation efforts in both developed and developing economies.221 An agreement on climate change finance is now viewed as critical to the success of the upcoming COP26 conference to be held in Glasgow in November 2021 and the financing gap remains a key obstacle to the success of the talks.222
b. Definitions of Green Finance
There is a large literature on what has been broadly termed “green finance”, the respective roles and importance of public and private sectors, and the variety of financial instruments deployed. However, there is no precise and commonly accepted definition of the term.223 The World Bank defines it as “the financing of investments that provide environmental benefits in the broader context of environmentally sustainable development”.224
Green investments include investments in environmental goods and services, and mitigation and adaptation investments specifically related to climate change. There is also no accepted common definition to the term “environmental services”.225 It is not possible to make a distinction between a narrowly defined set of environmental services (such as sewerage treatment, waste collection treatment and disposal, sanitation and remediation services) and a wider set that serve to protect the environment in its broadest sense.226 The latter would include financing investments in reducing air pollution at the local and regional levels and achieving the aspirations of the Paris Agreement on climate change at a global level.
Green finance is allocated to two purposes in climate change-related investments: mitigation and adaptation. Mitigation finance refers to investments in projects and programs that contribute to reducing or avoiding greenhouse gas emissions (GHGs). The investments supported by mitigation finance are focused on renewable energy projects and energy efficiency improvements.
The major sources of international public finance for climate mitigation in developing economies are the World Bank-administered Clean Technology Fund (CTF), the Green Climate Fund (GCF) and the Global Environment Facility (GEF). Since its start-up in 2015, the GCF has become the major source of mitigation finance. It approved mitigation finance at USD 1,022 million for 11 mitigation projects during 2020, in the first year of its first replenishment period.227 About 45% of the financing approved since 2003 by dedicated climate finance initiatives approved for mitigation activities largely devoted to the development and deployment of renewable energy and energy efficiency technologies in fast growing economies.228 The cumulative amount of finance approved for mitigation from climate funds was USD 11.2 billion as of December 2020.
Adaptation finance refers to investments that contribute to reducing the vulnerability of property and persons to the effects of climate change such as coastal protection or wind-proofing homes against severe weather effects.229 The largest sources of approved funding for adaptation projects are the GCF, the Least Developed Countries Fund (LDCF) administered by the Global Environmental Facility (GEF), the Pilot Program for Climate Resilience (PPCR) of the World Bank’s Climate Investment Funds (CIFs) and the Adaptation Fund (AF).230 However, according to data monitored by “Climate Funds Update (CFU)”,231 contributions to adaptation funds “remain low compared to funds supporting mitigation”. Of the $78.9 billion in climate finance transferred by rich economies in 2018, only 21% was spent on adaptation.232 The GCF approved the largest volume of adaptation finance in 2020, with USD 313 million approved for 11 projects targeting adaptation. The amount of cumulative finance approved for adaptation from key climate funds grew to USD 5.8 billion in 2020. Economies that are most vulnerable to climate change should be given priority for funding which should balance between adaptation and mitigation efforts as noted in the Paris Agreement.233
c. Green Finance Standards
Green finance standards refer to codes, taxonomies, regulations, and guidelines which aim to support governments, financial institutions, listed corporations and private investors to determine the financing of investments in “environmentally-friendly” projects. In a general descriptive sense, “environmentally-friendly” projects are typically defined in relation to the UN’s “sustainable development goals” or the goals of the 2015 Paris Agreement. Green finance standards have proliferated over the past few decades, supporting a large range of competing and often overlapping investment initiatives in climate change mitigation and adaptation.234 The lack of clear criteria in the classification of the activities underlying green finance and the lack of clarity in comparability across economic sectors, industries and projects increases the uncertainty associated with financing investment decisions and distorts or obviates clear policy signals.
A wide range of institutions and organizations have issued green finance standards. Among these, according to the World Bank Green Finance Platform, governments and regulators have issued nearly 400 green finance measures. Private and public financial institutions have issued local and international standards related to green finance (for instance, International Finance Corporation’s “Performance Standards”, Inter-American Development Bank’s “Environmental and Safeguards Compliance Policy”, Barclays’ “Impact Eligibility Framework for Shared Growth Ambition” and HSBC’s “Sustainability Risk Policy”). Think tanks and UN organizations likewise have issued standards (for instance, “UN Principles of Responsible Investment”, “CICERO”, “Climate Bonds Initiative”, “Global Reporting Initiative”, etc.). Various associations have also played a key role in issuing proposals and models for green finance standards, including the Sustainable Accounting and Standards Board, the Taskforce for Climate-Related Financial Disclosure, International Capital Market Association, Global Impact Investing Network, Impact Management Project and Carbon Disclosure Project.
There is a critical need for harmonization of green finance standards to lower transaction costs, enhance the efficiency of financing investments which support seamless investment flows across jurisdictions, and support member economies’ climate mitigation and adaptation policies and projects. The heterogeneity of approaches in green finance standards reflect specificities in economic and financial conditions, institutional capacities and governance norms to implement such standards. While continued research into harmonizing green finance standards across APEC member economies should, and will likely, continue, it would be unproductive to try to answer the question as to which green finance standard is the “best” in terms of mobilizing green finance.
At the policy level, it is important to understand the underlying reasons for the heterogeneity in sustainable finance standards that need to be considered for further harmonization efforts of green finance standards. The quest for harmonizing green financing standards would be well served if a broader approach to climate change mitigation and adaptation projects were to be adopted. This broader approach would meet the needs of developing member economies in which energy security and energy affordability are key goals in the broader quest for economic development and poverty alleviation, in line with the UN’s SDG goals.
d. CSR and ESG in Green Finance
Forms of green finance have grown rapidly in recent years, as a growing number of institutional investors and funds incorporate various Corporate Social Responsibility (CSR) and Environmental, Social and Governance (ESG) investment initiatives.235 In the 2019 Joint Ministerial Statement, APEC Finance Ministers commissioned the OECD to produce a compendium on the implementation of ESG in financial markets throughout the APEC region, looking at effective approaches and challenges. In 2020, the OECD issued a report based on the work and efforts of the OECD’s Committee on Financial Market to assess ESG investing and key findings from evidence-based reports in APEC economies.236
In June 2021, the finance ministers of the G-7 called for making disclosure of climate-related financial risks compulsory for companies.237 The G-7 group supported moves requiring companies to report how climate change is affecting their business to accelerate the process toward reaching global standards for disclosing climate-related data that is relevant to investors. With respect to such global standards, the Financial Stability Board (FSB) created the Task Force on Climate-related Financial Disclosures (TCFD) to improve and increase reporting of climate-related financial information.238 The TCFD works to develop recommendations for more effective climate-related disclosures that promote informed investment, credit, and insurance underwriting decisions and, in turn, enable stakeholders to understand better the financial system’s exposures to climate-related risks.
The TCFD says companies should make public in their financial reports information on how climate change could hit their revenue outlook. While currently voluntary, the framework is increasingly being used by large corporations and supported by regulators world-wide. “We support moving toward mandatory climate-related financial disclosures… that are based on the Task Force on Climate-related Financial Disclosures framework,” the G-7 finance ministers said in a statement.239 The group highlighted the need for a “baseline global reporting standard for sustainability” to help investors in their decision making.
To achieve this objective the TCFD has developed a reporting framework based on a set of consistent disclosure recommendations for use by companies as a means of providing transparency about their climate-related risk exposures to investors, lenders, and insurance underwriters. Improving the quality, consistency and transparency of climate-related financial disclosures will allow economies to have the necessary information to better assess the impact and effects of an organization on climate change. Around 1,700 organizations worldwide -- in the public and private sectors, as well as government entities -- support the TCFD.240
ESG investments have grown rapidly over the past decade, and the amount of professionally managed portfolios that have integrated key elements of ESG assessments exceeds $17.5 trillion globally by some estimates.241 Global ESG assets are on track to exceed $53 trillion by 2025, representing more than a third of the $140.5 trillion in projected total assets under management.242 According to Statista, ESG investments grew to $30.68 bn by 2018, at an annual compound rate of 18% from 2012.243 Investors with over $80 trillion in combined assets have signed a commitment to integrate ESG information into their investment decisions.244
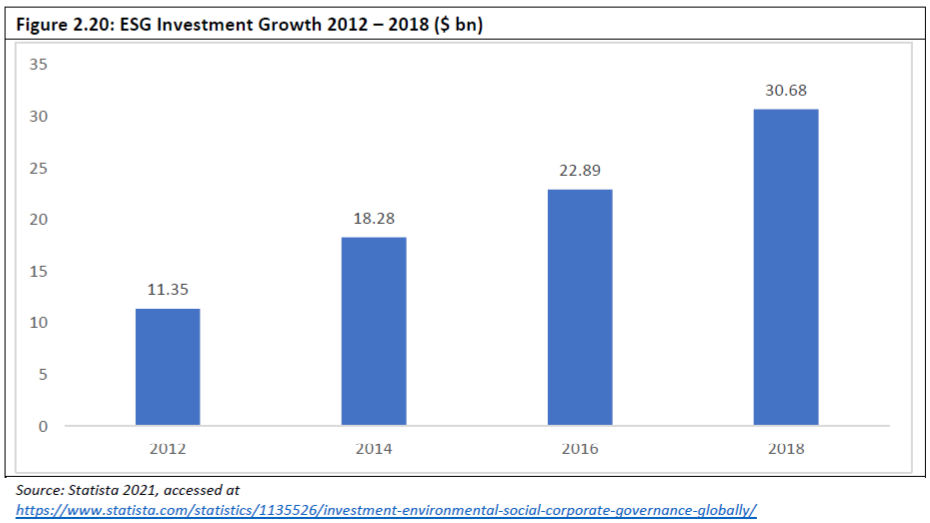
The size of ESG investments in the total investment universe is difficult to assess given the multiple data sources from different providers of ESG data and the varying definitions employed. A recent estimate of “sustainable and responsible investing” in the US market for professional managed assets in 2018 yields some perspective. The “sustainable and responsible investing” segment accounts for over 25% of total professionally managed assets in the US in that year. Demand for ESG investment products in the Asia Pacific region has been climbing significantly. According to the Global Sustainable Investment Alliance the proportion of sustainable investing assets in Japan, Australia and New Zealand currently stands at around US$ 3 trillion, representing 9% of the total global sustainable assets under management and with a growth of over 40% in Australia and more than 300% in Japan.245 This strong growth in “sustainable” investing in the APEC economies has been driven by commitments from large institutional investors, international investors and regulatory pressures. For example, Japan’s Government Pension Investment Fund (GPIF), one of the world’s largest pension fund, focuses on ESG in its investment strategy by investing in sustainable indexes and improving the ESG standards it applies to its asset portfolios.
There is an increasing interest from regulators and investors in the APEC economies including emerging markets to recognize and integrate international ESG standards and disclosure practices. Table 2.11 below identifies 18 exchanges of 16 APEC economies that have produced guides for listed companies. Among the most prominent reporting frameworks being used are the Global Reporting Initiative (GRI), the Sustainable Accounting Standard Board (SASB) and the Task Force on Climate-Related Financial Disclosures (TCFD).
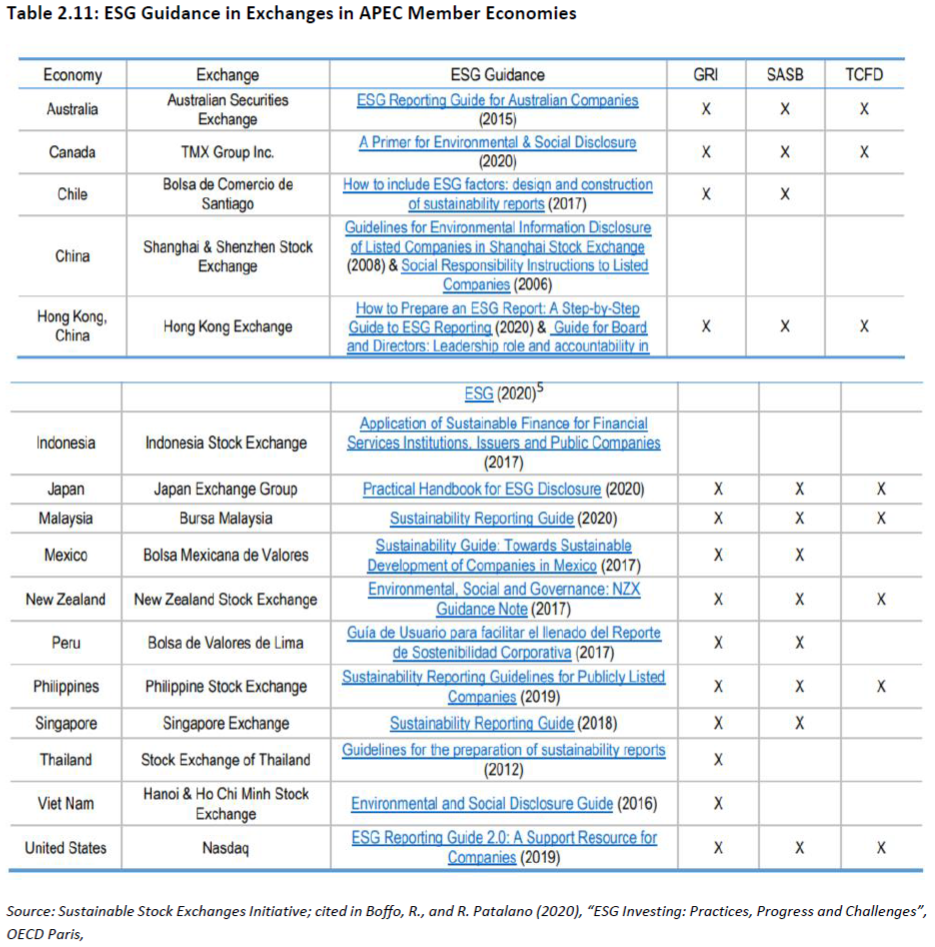
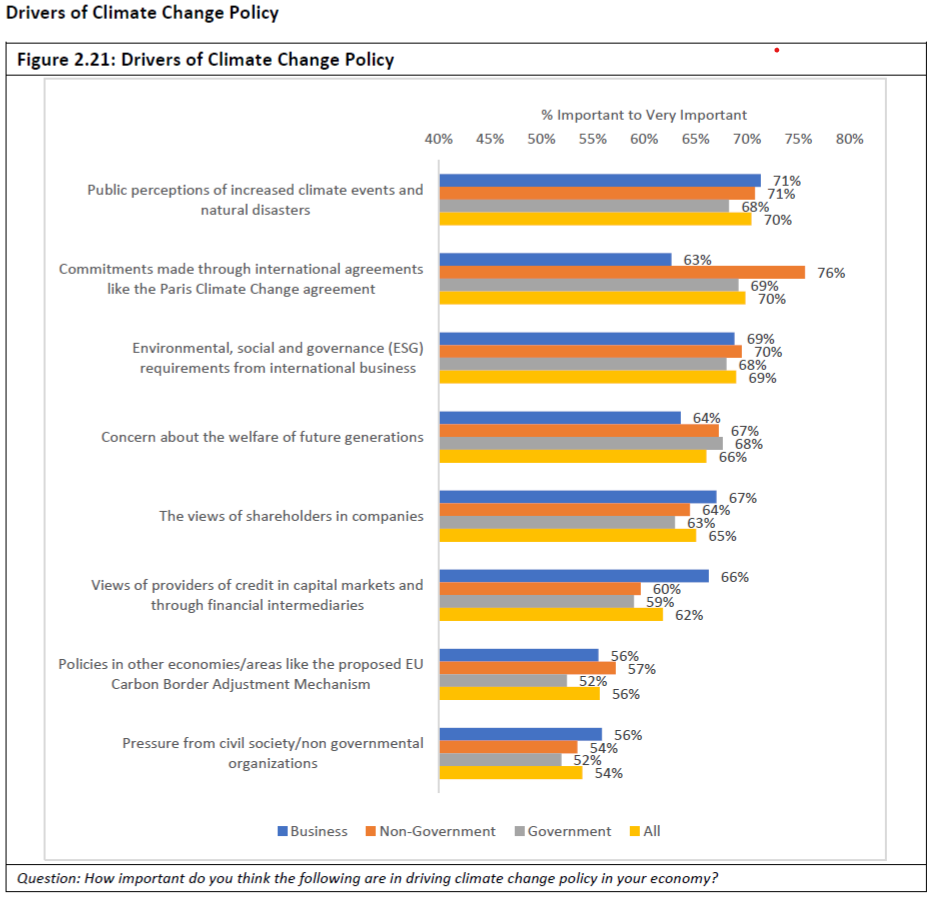
According to the PECC questionnaire, ESG requirements are seen as the third most important driver of climate change policy after public perceptions of climate events and commitments made through international agreements such as the Paris Climate Change Agreement.
The growth in green finance along ESG criteria is a function of three factors. First is the perception that ESG criteria can help improve risk management and lead to returns that are at least comparable if not superior to returns from traditional financial investments. The second factor relates to the growing attention paid to the risks from climate change and the believe that this will increasingly influence investor and consumer choices which impact corporate performance. Third, corporations and financial institutions are under shareholder and government pressure to move way from short-term perspectives of risks and returns in order to better reflect longer-term sustainability in investment performance.
While demand for ESG investment options is growing rapidly, it is clear that ESG ratings are still at an early stage of development. Risk-adjusted returns on ESG investments differ widely in performance, and evidence suggests that there is a lack of correlation between ESG ratings and investment performance.246 The inconsistencies and lack of comparability across different ESG metrics offered by rating agencies and consultants is a result of the use of different conceptual frameworks, measures, key indicators, qualitative judgement, and varying and often arbitrary weighting of different subcategories within ESG frameworks. There is little consensus on the objective measures of achievement in ESG.
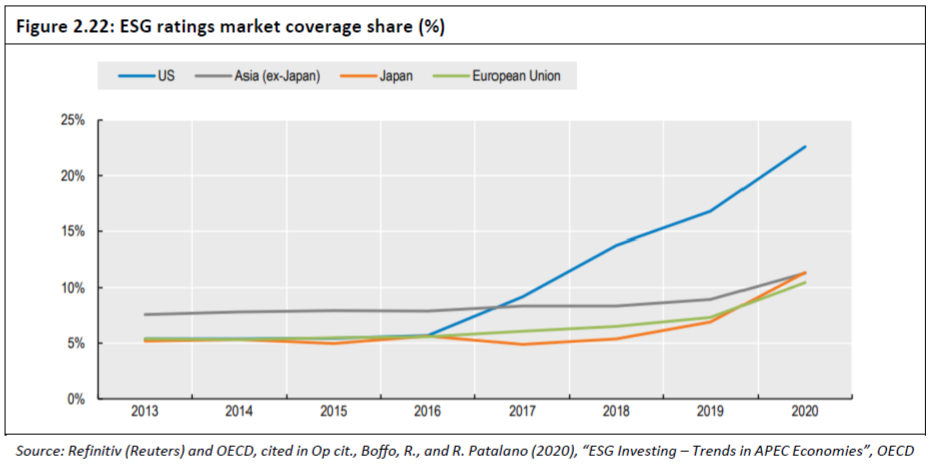
In general, larger companies have higher ESG ratings compared to smaller companies. The largest companies by market capitalization have ample resources to invest in disclosing information concerning their ESG scores while small capitalized companies cannot afford the threshold costs associated with gathering and collating the data needed to disclose non-financial ESG information. The influence of size and location of companies on ESG ratings naturally bias the “ESG game” against small and medium enterprises which cannot afford the services of large accounting firms, consultancies and banks which offer ESG rating services.247
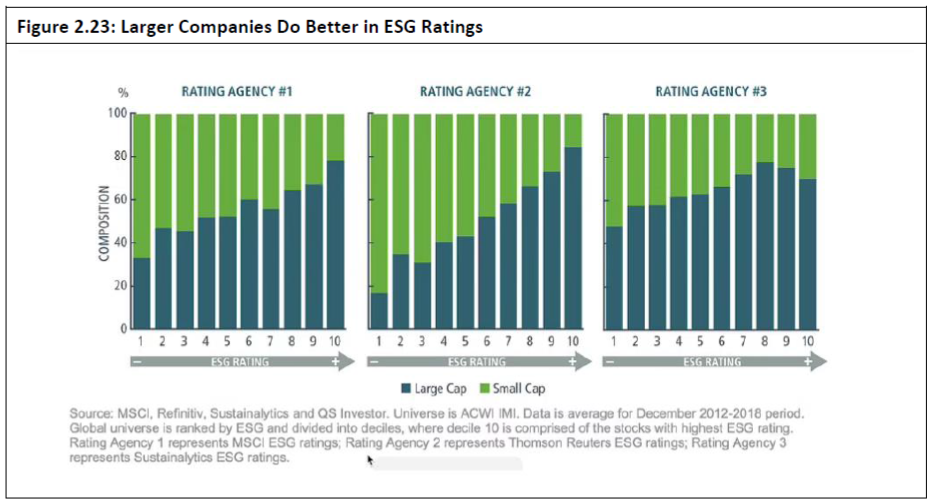
In assessing the role of ESG investing in the APEC economies, the fundamental causality question remains: are companies pursuing ESG criteria more profitable, or are the more profitable companies those that are able to afford the services of ESG rating services offered by accounting firms, ESG disclosure advisors and consultants, and investment fund managers? The empirical evidence provides little support to suggest that ESG ratings provide adequate measures of “green finance” for climate change mitigation and adaptation efforts.
e. Central Banks and Multilateral Financial Institutions’ Role in Green Finance
The world’s central banks have traditionally operated under narrow mandates to safeguard financial stability by overseeing the financial system of private and public-sector banks and managing liquidity and interest rates. In recent years, however, central banks as well as multilateral financial institutions such as the World Bank and the IMF are increasingly involved in efforts to enhance the role of ESG, CSR and “stakeholder capitalism” in capital markets. With the US, EU, and UK push to “fight climate change” in the run-up to the UN climate conference in Glasgow in November (COP26), there has been much discussion on the role of central banks in addressing risks associated with climate change and in supporting the development of green finance.
The World Bank, the Asian Development Bank, the European Investment Bank and the International Monetary Fund have either already stopped, or plan to end soon, the funding of fossil fuel-based projects.248 The IMF supports the Network of Central Banks and Supervisors for Greening the Financial System (NGFS) to promote green finance. The Biden administration’s new Secretary of the Treasury Janet Yellen plans to push lenders to adopt more "green" lending policies. According to Yellen, the US federal government will “need to seriously look at assessing the risk to the financial system from climate change.”249
Should member economies support a vastly expanded remit -- far beyond the traditional objectives of price stability and avoiding financial crises -- for their central banks? The move by central banks to incorporate green finance into monetary policy poses key risks to member economies. In noting this dangerous ‘mission creep’ of central banks, Professor John Cochrane in a recent testimony to the US Senate Committee on Banking, Housing and Urban Affairs warned that the boardrooms of central banks risk becoming politicized.250 The considerable power of the central bank over investment decisions and corporate behavior risks the politicization of the capital allocation process and fundamentally undermine the efficiency of capital markets. Member economies’ broad response to climate change is more properly decided by elected leaders with policies enacted through the legislative process after having engaged with specialized environmental and scientific agencies and ministries.
While there was strong support for action on climate change, that is climate change was having a negative impact on the economy and that their economies should be doing more to support the Paris Agreement, there was also a significant alternative view – 31 percent of respondents thought that climate change policies are also having a negative impact on their economies/businesses.
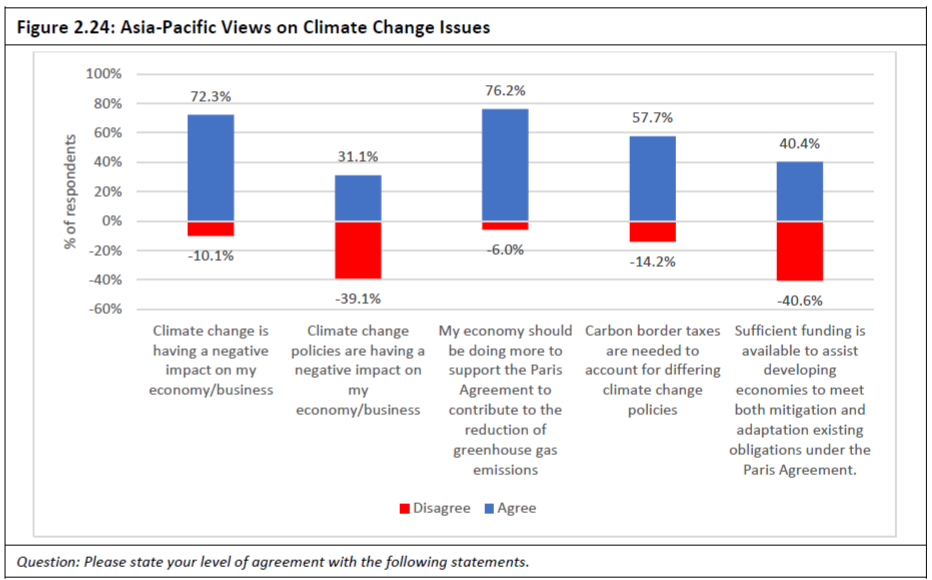
Much more needs to be done to ensure that a cost-benefit analysis is applied to climate change solutions based on the best information available. The divided views on whether sufficient finance has been made available was not an emerging economy vs. advanced economy issue within the Asia-Pacific policy community. Indeed, many of the issues that traditionally divide emerging and advanced economies were not evident in PECC’s survey results.
Concluding Thoughts
The negotiations at the upcoming COP26 summit in November in Glasgow will be contentious and difficult, perhaps more so than at any time since the Paris Agreement came into force in November 2016. There are several issues that will constitute significant challenges to the adoption of more ambitious NDCs by all Parties. Of these, the commitment to and delivery of, financial support, technology transfer and capacity building assistance by developed economies to the developing economies will once again be a major area of discussion and debate. A second issue of major concern will be presented by the EU’s proposed carbon border adjustment mechanism which has already been objected to by its major trading partners. From the point of view of the developed OECD economies, the adoption and implementation of sufficiently ambitious climate mitigation commitments by the major developing economies will be of key concern.
APEC member economies can play a significant constructive role in the outcome of the COP26 negotiations. APEC’s Putrajaya vision of “an open, dynamic, resilient and peaceful Asia-Pacific community by 2040” can be the basis to find ways to support Article 6 of the Paris Agreement which aims at assisting governments in implementing their NDCs through voluntary international cooperation. Such voluntary international cooperation will require an assurance for the developing APEC member economies -- along with other developing economies -- that energy security, reliability and affordability requisite for their economic development and poverty alleviation objectives will be given priority. Significant achievements in establishing region-wide carbon markets in the Asia-Pacific region which can have linkages with existing carbon markets in Europe and North America are within reach, and APEC member economies would gain mutual benefits from such arrangements and the momentum from business-driven demand for carbon credits and markets. Trade in environmental goods and services can be further enhanced if it included the potential for voluntary trade in carbon credits and offsets. Carbon mitigation and adaptation projects jointly implemented between APEC developed and developing economies, supporting a supply of good quality carbon credits and offsets and the creation of missing markets in natural capital could demonstrate the value of such projects beyond the APEC region.
<< Previous
Next >>