Chapter 1 - The Macroeconomic Outlook
CONTRIBUTED BY MR. EDUARDO PEDROSA, SECRETARY GENERAL OF PECC / COORDINATOR OF STATE OF THE REGION
The Asia-Pacific is at an economic crossroads. After years of spectacular growth, first led by Japan, then the “newly industrializing economies (NIEs)1,” and then China, the region’s growth performance has slowed. This is normal. As economies develop and move closer to the technology frontier, and higher per capita income levels spread from their initial enclaves to the whole of the economy, the scope for very high growth rates lessens. However, it is difficult not to conclude that over the past several years, the region as a whole is underperforming its potential. Growth is steady but hardly robust in the United States, its largest economy, and China and Japan are both grappling with significant structural challenges. However, with political will, and through collaboration and cooperation in APEC, G20, and other processes, the region’s outlook is quite positive. In this report, we will highlight services. Services – old and new – account for the largest share of the region’s employment, and have the greatest scope for performance enhancing efficiency. First, however, this chapter will look at the broader regional economic context.
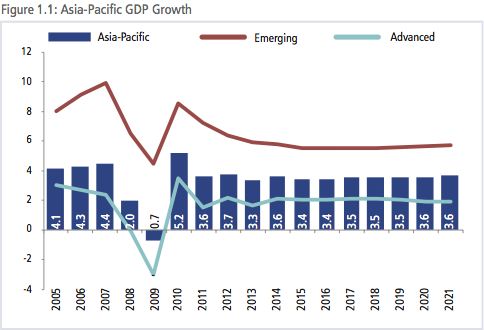
The Asia-Pacific economy is expected to grow at 3.4 percent in 2016 – the same rate as 2015 - and then at much the same rate in 2017. Two important positives for the region are the continued - if slow - recovery of the United States and China’s ability to manage its slowdown to a new, more realistic equilibrium. However, 15 out of the 28 economies in the broadly defined region are expecting slower growth this year. Emerging economies in the region are expected to contribute around 2.2 percentage points to growth in the Asia-Pacific with advanced economies accounting for the balance of 1.2 percentage points.
Of key concern is that these mediocre growth numbers come with substantial support from stimulus measures. As important as these measures are in their historical context, they are not sustainable over the long term, and need to be accompanied by meaningful structural reforms to rebalance economic growth. While there are valid concerns about the sequencing of reforms and their possible pro-cyclicality, the support from monetary easing gave, and continues to give, the veneer of a recovery rather than a robust turnaround. As monetary policy ‘normalizes,’ there are significant uncertainties on whether or not economies in the region have sufficient momentum on the private side or other tools on the public sector side. An additional source of anxiety for the region’s growth comes from Brexit. Over the long-term, the likely impact of Brexit itself is relatively small – the UK is not a major trading partner for any of the region’s economies. More important for the Asia-Pacific region is whether Europe can adjust and recover a healthy growth rate. Nonetheless, in the short-term, the referendum result, along with continued instability in Eastern Europe and the Middle East, and uncertainties about the election in the United States, added to anxiety into already nervous financial markets. For a region that has benefited greatly from globalization, the political backlash against freer trade and people movements is deeply troubling.
CONCERNS OVER DEFLATION
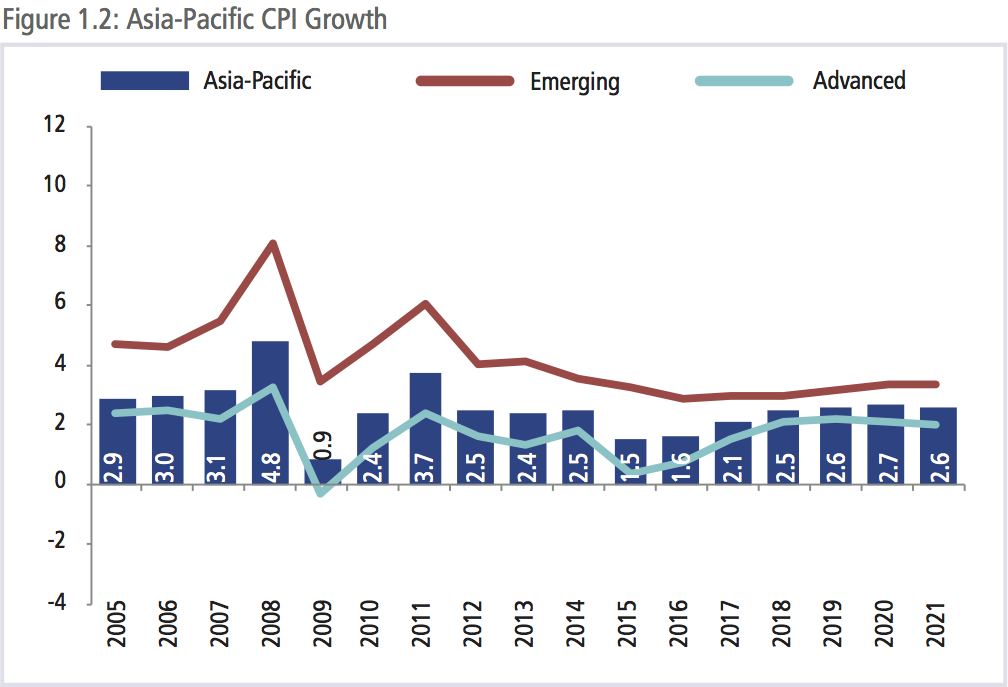
Prices in the region remain stable with CPI inflation expected at 1.6 percent in 2016 and 2.1 percent in 2017, with slightly higher rates expected for emerging economies at 2.9 percent in 2016 and 3.0 percent in 2017. The anticipated increase in prices in 2017 comes as a result of an expected pickup in prices in advanced economies from 0.8 percent in 2016 to 1.6 percent in 2017. This in turn comes from an expectation that prices in the US will pick up from 0.8 in 2016 to 1.5 percent in 2017. The broader concern remains deflationary pressures. In spite of some central banks’ efforts, inflation remains low with Japan considering shifting from quantitative easing to implementing ‘helicopter money’ policies. The key difference between the two being that for the latter, the money would never have to be repaid.
HISTORICALLY HIGH DEBT LEVELS
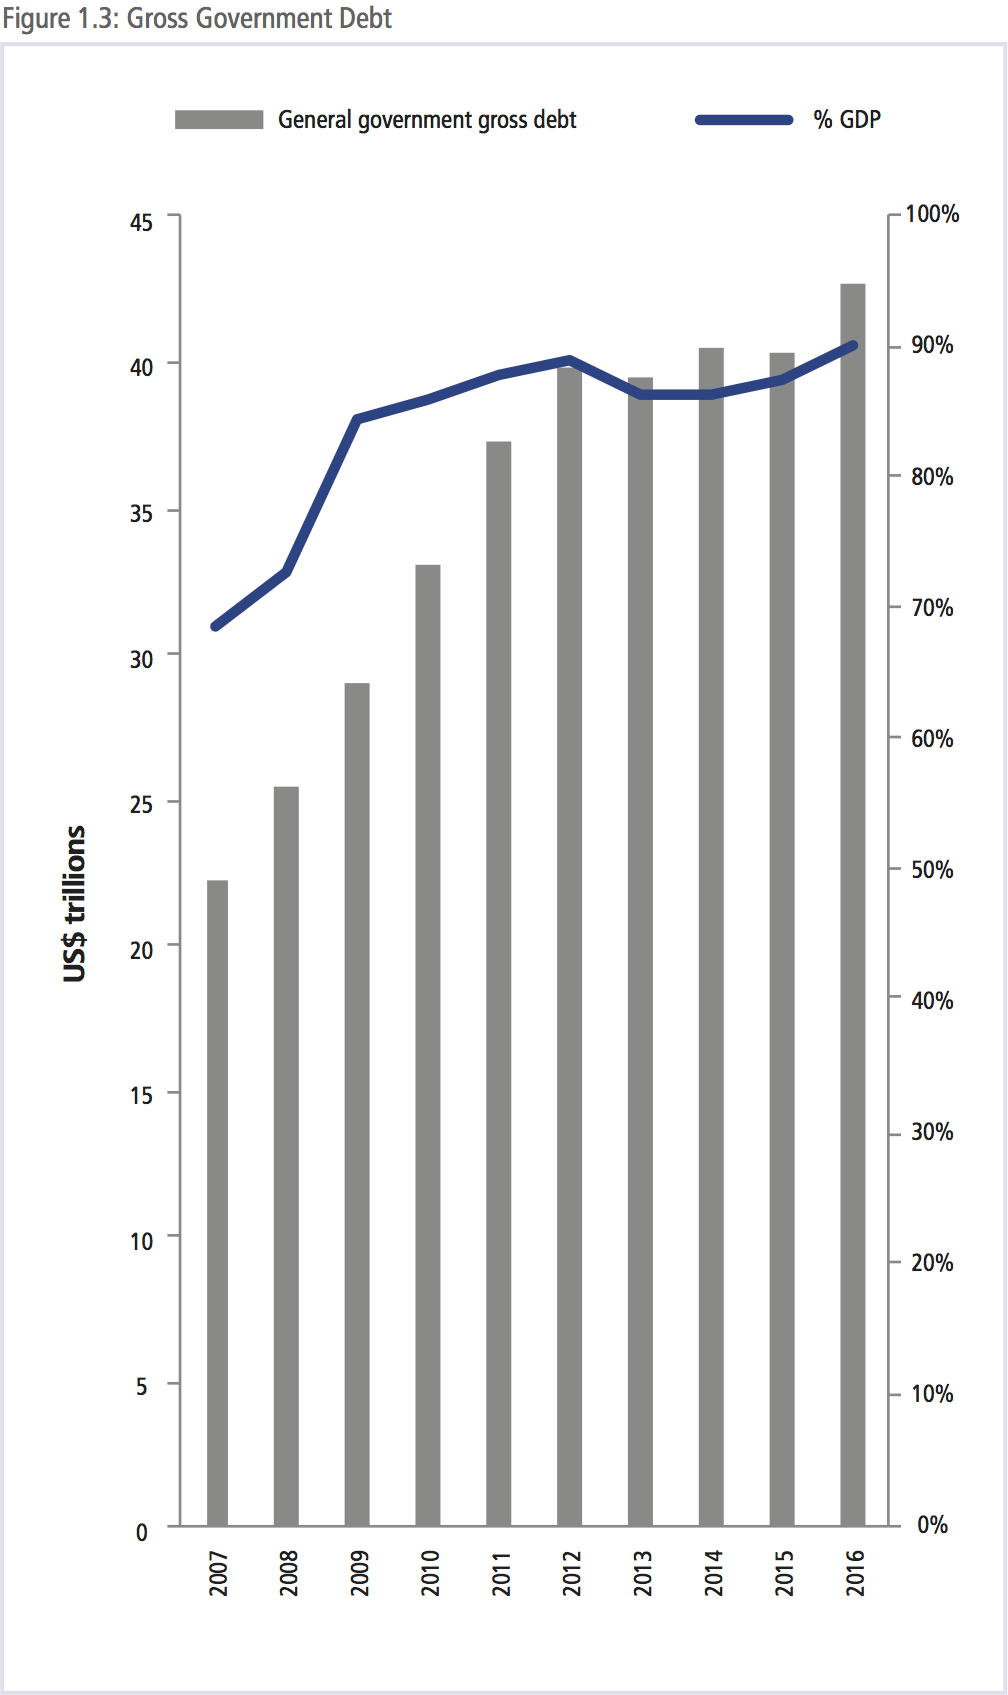
Since 2007, government debt has risen as a consequence of stimulus policies and lagging government revenues. In 2007, the total amount of gross government debt in the region was approximately US$22 trillion; it has since increased to US$42 trillion or around 90 percent of regional output. In its latest annual report, the Bank of International Settlements (BIS) warned, “Judged by standard benchmarks, the global economy is not doing as badly as the rhetoric sometimes suggests. Global growth continues to disappoint expectations but is in line with pre-crisis historical averages, and unemployment continues to decline. Less comforting is the longer-term context – a “risky trinity” of conditions: productivity growth that is unusually low, global debt levels that are historically high, and room for policy maneuver that is remarkably narrow.”
PRODUCTIVITY GROWTH MISSING
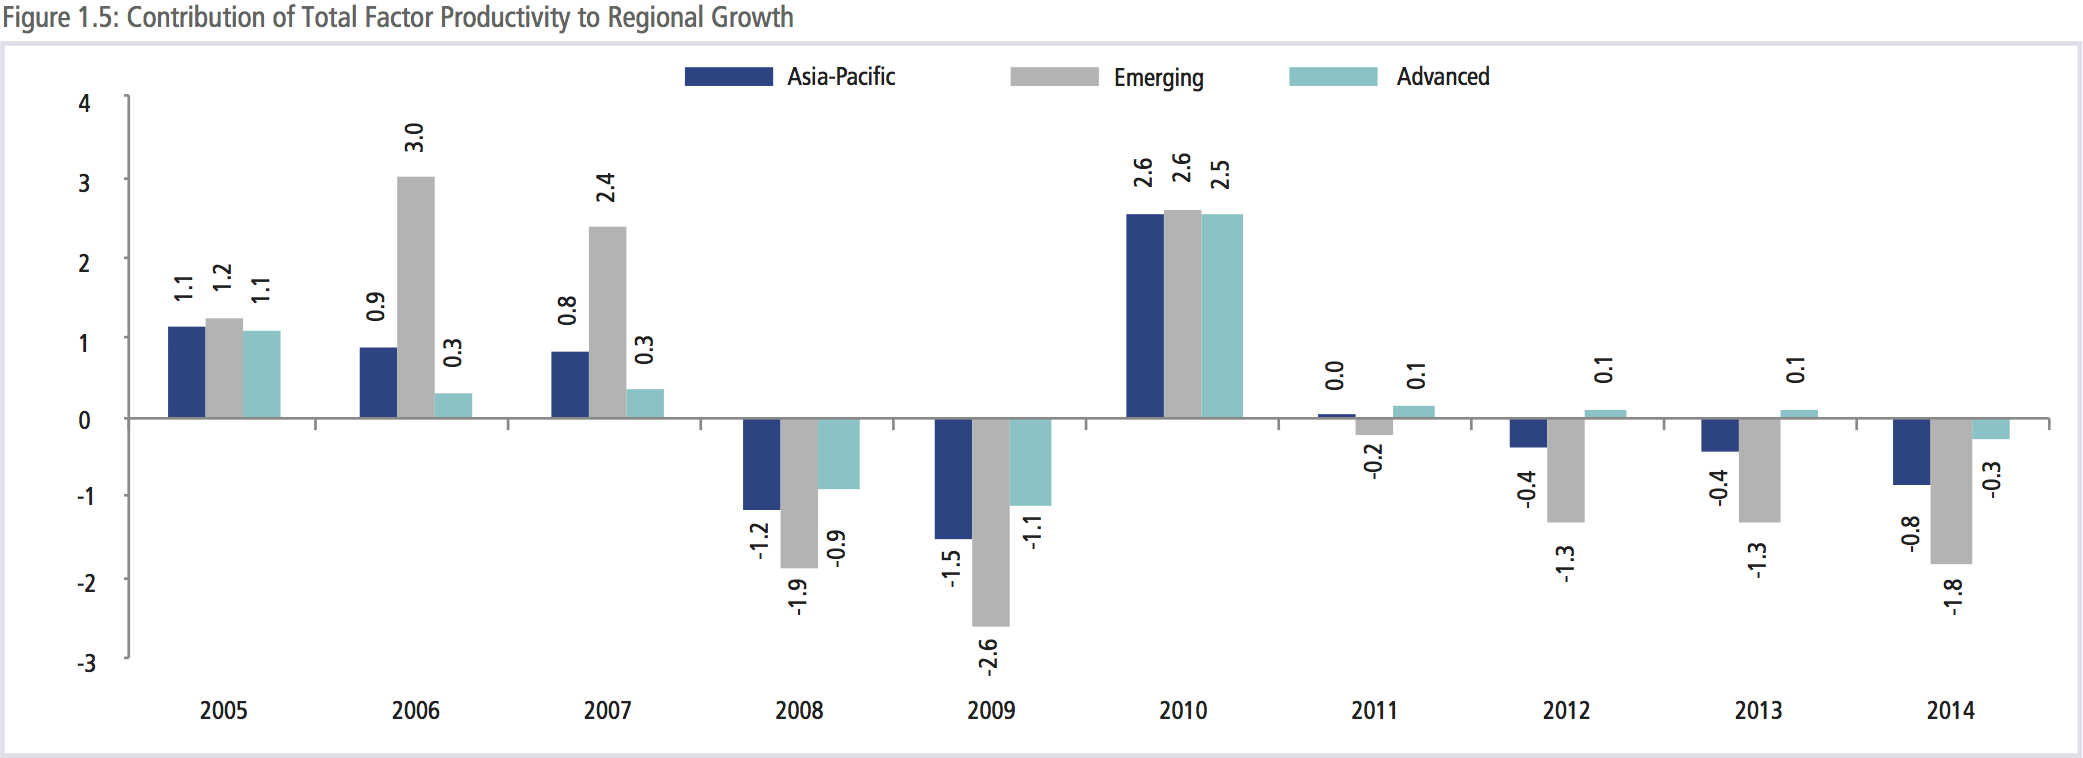
Another critical and long-term concern for the region is the lack of productivity growth. As shown in Figure 1.5, the contribution of total factor productivity (TFP) to regional growth since 2010 has been negative. Simply put, the slow growth since the Global Financial Crisis has in turn caused a drop in productive use of resources, possibly related to a combination of market rigidities and stagnating innovation.
Slightly more alarming is the steepness of the decline in the contribution of TFP to growth in the region’s emerging economies. This should ring the alarm bells and bring a greater sense of urgency to structural reforms such as labor market reforms and pro-competition regulations – especially in the services sector to improve the ability of the economy to harness technological improvements.
INCOME GROWTH
Even though growth in emerging economies continues to outpace that of advanced economies by a factor of two, the average GDP per capita in emerging economies in the region is still one fifth that of the region’s advanced economies, even with the adjustment for differences in cost of living using purchasing power parities. Using current US$ rates the disparity is even greater with an average GDP per capita of US$5,000 in emerging economies and US$45,000 for advanced economies.
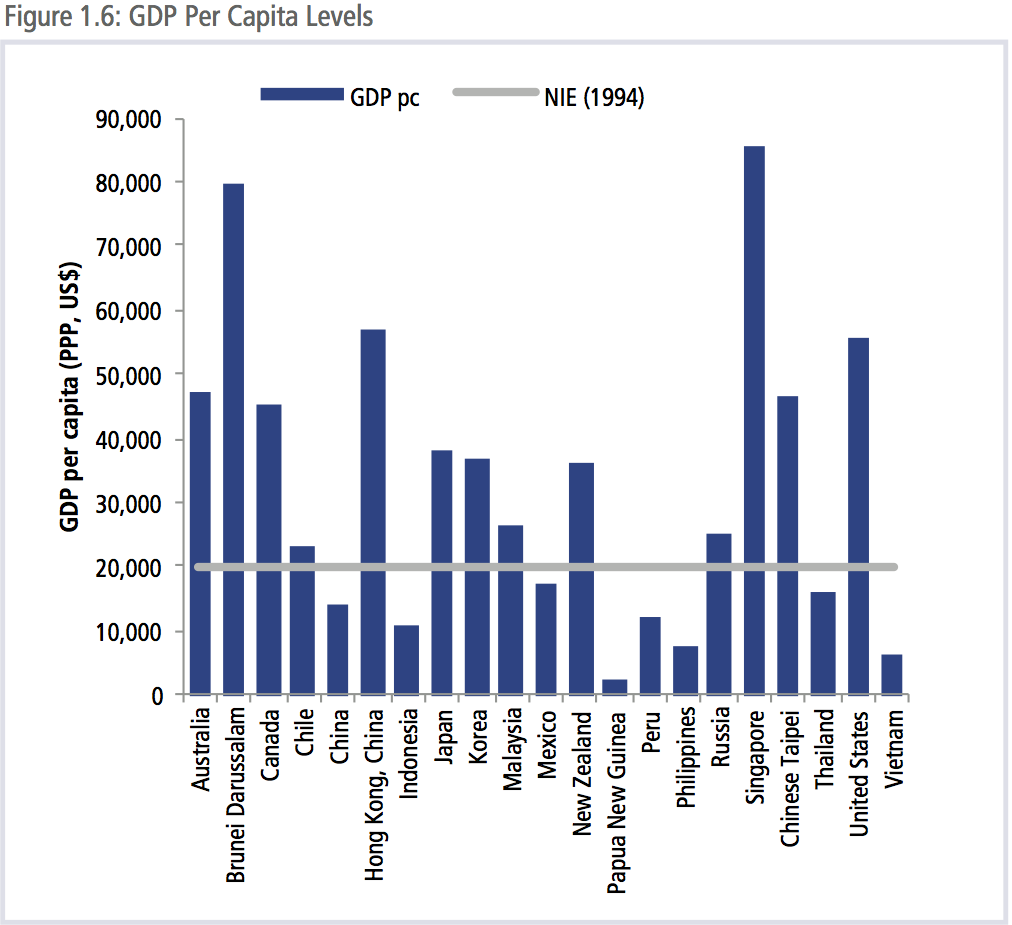
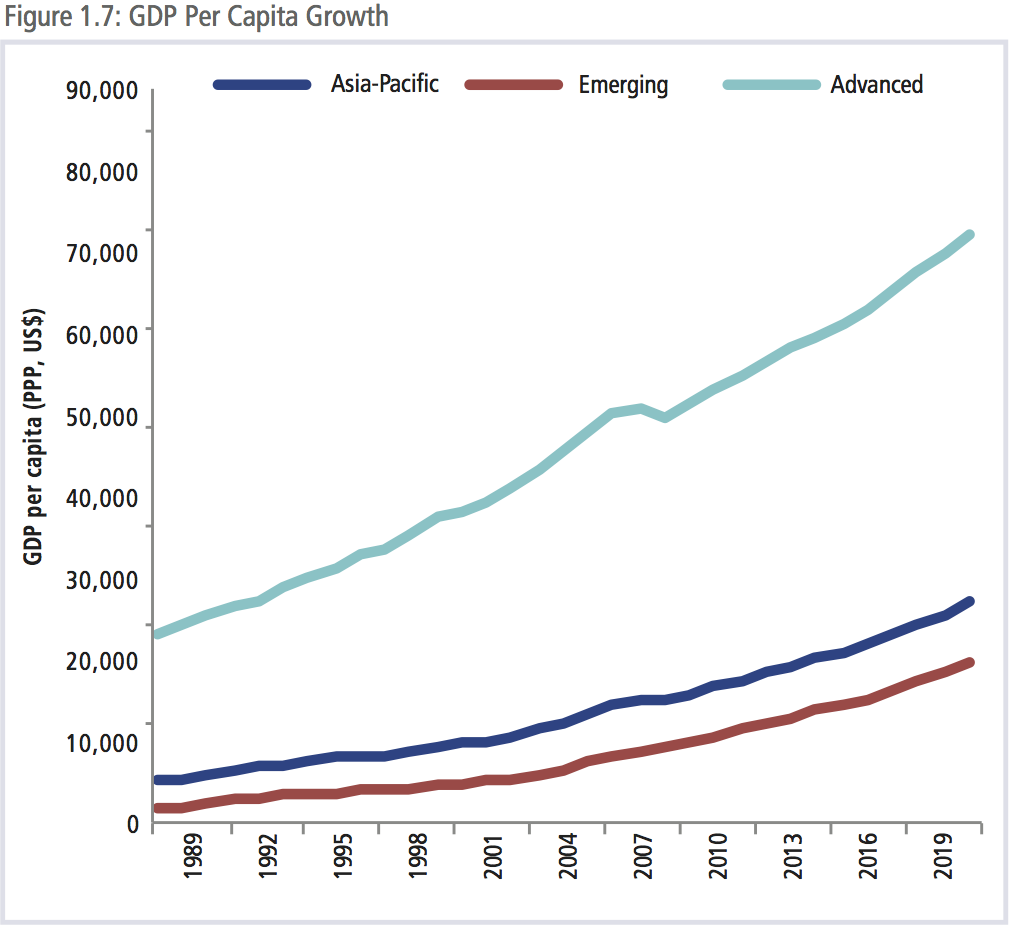
That said, the differential is closing. When APEC began in 1989, the gap was even larger. When APEC set the Bogor Goals in 1994, leaders agreed that “developing economies will strive to maintain high growth rates with the aim of attaining the level of prosperity now enjoyed by the newly industrializing economies.” In 1994, the average GDP per capita levels in the newly industrializing economies - Hong Kong (China), Korea, Singapore, and Chinese Taipei - was around US$20,000. By 2020, Chile, Malaysia, Mexico and Thailand are expected to also reach that level. This would leave China, Indonesia, Papua New Guinea, Peru, the Philippines and Vietnam still to catch up to that level.
The challenge for those economies is that the burst of growth in the region in the late 1990s and 2000s has dissipated and regional economies are undergoing profound structural shifts in response to changes that triggered and were wrought by the crisis as well as their own changing comparative advantage and technological transformations.
BOX 1.1: CHINA’S ECONOMY WILL REMAIN STABLE AND SOUND
Contributed by CNCPEC
China’s gross domestic product expanded 6.7 percent yearon- year in the first half of 2016 to reach 34.06 trillion yuan (US$5.08 trillion). This indicates that the economic growth is still within a reasonable range, with its structure further optimized, transformation and upgrading accelerated, new growth drivers strengthened and people’s livelihoods improved. The national economy has realized moderate but stable and sound growth, laying a solid foundation for achieving the full-year goal of 6.5 to 7 percent growth.
Amidst the fragile global recovery and gloomy trade climate, it has not been easy for China to achieve such stable growth. Despite the ongoing supply-side structural reform and intensified measures tackling “zombie companies,” there is little sign of a sharp slowdown, which is testimony to the increased internal impetus of its economy.
Recently, the IMF has revised its forecast of China’s economic growth for 2016 upwards by 0.1 percent to 6.6 percent.
Development highlights
Reform, innovation, adjustment and transformation have all contributed to the stable and sound performance of China’s economy. Reform efforts to streamline administration, delegate power and improve government services have given a strong boost to mass entrepreneurship and innovation, and further boosted employment and unleashed development potential. Some 40,000 new market entities are being created daily, including over 13,000 new enterprises. This is a marked increase compared to the previous two years and has given a strong boost to job creation. Employment also remained steady during the first half of 2016. According to statistics from the Ministry of Human Resources and Social Security, a total of 7.17 million jobs were created in urban areas, 71.7 percent of the full-year target. Meanwhile, the unemployment rate in major cities, by and large, remained at roughly 5.2 percent.
In addition, statistics from the National Bureau of Statistics (NBS) showed that per capita disposable income reached11,886 yuan (US$1,779) in the first half of the year, a year-onyear increase of 6.5 percent after adjusting for inflation, 0.2 percentage points slower than the GDP growth.
The leading role of consumption and services is becoming more visible. In the first half of 2016, consumption contributed 73.4 percent to economic growth, up 13.2 percentage points yearon- year. New areas of consumption such as information and communication, smartphones and new energy vehicles are rapidly expanding. The five “happiness industries” of tourism, culture, sports, health, and old-age care are rapidly growing. The service sector has grown into the biggest industry in the national economy, both in terms of its output and the number of jobs it created. In the first half of 2016, the service industry kept expanding at a relatively fast pace, making up 54.1 percent of GDP in the first half of the year, up 1.8 percentage points from the same period last year.
An innovation-driven economy is brimming with vitality. High-tech industries, high-end manufacturing, e-commerce and other new business forms are booming. Enterprises, sectors and regions that have made an early start in economic transformation and upgrading and that embrace faster growth of new industries have all taken on a sound momentum of growth. The hi-tech industrial and equipment manufacturing sectors respectively grew 10.2 and 8.1 percent—accounting for 12.1 and 32.6 percent of the total industrial value-added output—and the strategic emerging industries expanded 11.8 percent in the second quarter, 1.8 percentage points faster than in the first quarter. The rapid expansion of the strategic emerging industries came from investment growth. While investment in the manufacturing sector slowed down, in the service sector there was double-digit growth rate. That meets the demand of industrial transformation and upgrading, and accords with the trend of striding towards the middle and higher end of the industrial chain.
At the same time, industrial value-added output in central and western regions grew 7.3 and 7.2 percent respectively and outpaced eastern region by 0.9 and 0.8 percentage points Amidst the structural adjustment and transformation, central and west China have showed a strong late-starting advantage.
Figures show that achievements have been made in structural reform on the supply side, which is essential to China’s economic transformation.
Cutting overcapacity: In the first half of the year, output of raw coal and crude steel decreased 9.7 percent and 1.1 percent, respectively.
Destocking: At the end of May, the finished goods inventory held by industrial enterprises above a designated size decreased by 1.1 percent. From March through June, residential housing for sale had been on decline for four consecutive months. Deleveraging: At the end of May, the asset-liability ratio of industrial enterprises above a designated size stood at 56.8 percent, 0.5 percentage points lower than at the same time last year.
Reducing costs: From January to May, the cost per-hundredyuan turnover of primary activities of industrial enterprises above a designated size was 0.22 yuan less than that of the same period last year.
Improving weak links: In the first half of the year, investment in water environment and public facility management, and information transmission software and information technology services rose 26.7 percent and 22.5 percent, 17.7 percentage points and 13.5 percentage points faster than the growth of total investment, respectively.
On the whole, the Chinese economy is better structured; its quality is improving and a stronger momentum is being gathered.
No hard landing to happen despite downward pressure
Given the complex and challenging international environment and the deep-seated domestic problems accumulated over the years, including a real estate bubble, industrial overcapacity, rising non-performing loans, local government debt and financial market risks, the foundation underpinning stable performance of the Chinese economy is yet to be strengthened. The driving effect of external demand on growth is waning, and uncertain factors like Brexit further destabilize the fragile international environment. Private and manufacturing investments are sluggish. Latent risks still exist in finance and other sectors. In some industries with serious overcapacity and regions with monotonous economic structures, there have been relatively more problems. Downward economic pressure remains, and the difficulties are not to be underestimated.
In the stage of transition, short-term fluctuations of economic growth are hardly avoidable, but the Chinese economy will not head for a ‘hard landing,’ with huge potential, high resilience and ample leeway. China’s growth will not plunge, even without stimulus policies. The L-shaped economic growth, that is, declining from the two-digit growth rate to a moderate-to-high growth rate at around 7 percent, is to stay in the foreseeable future. This is the economic new normal for China with strong fundamentals such as a huge market, robust infrastructure construction, ongoing urbanization, an expanding middle class and the supply of over 7 million university graduates each year.
Policies ahead
The 13th Five-Year Plan (2016-20) released earlier this year, outlines China’s development path for the next five years, with growth driven by innovative, coordinated, green, open, and shared development. Among the five principles, innovation is the most important to the process of the fourth industrial revolution.
The fundamentals of the Chinese economy have remained unchanged, and the macro policies will maintain continuity and stability. In the meantime, China will continue to innovate means of macro control, implement the proactive fiscal policy with greater intensity and efficiency, and carry out the prudent monetary policy in a flexible and appropriate fashion. China will practice well-targeted industrial policies, flexible micro policies, solid reform policies, and inclusive social policies.
China will steadfastly advance supply-side structural reform, concentrating on cutting overcapacity, reducing inventory, deleveraging, lowering costs and strengthening weak links, so that China’s development could be less reliant on natural resources and be more driven by human resources and innovation. China will accelerate the development of the new economy and cultivate new growth drivers. China will also promote sharing economy for everyone to take part in and benefit from.
China will transform and upgrade the economy by opening up. China will open wider the service sector and general manufacturing sector, provide more investment opportunities to foreign businesses and foster a fairer, more transparent and predictable investment environment. All companies registered in China, Chinese-funded, foreign-funded, joint ventures or independently-owned, will be treated as equals. Their legitimate rights and interests will be protected, and they will have access to better public services.
Facing the current complexities and fluctuations in the international financial markets, China will adhere to a managed, floating exchange rate regime based on market supply and demand with reference to a basket of currencies. The fundamentals of the Chinese economy determine that there is no basis for persistent depreciation of the RMB. China has the capacity to keep the RMB basically stable at an adaptive and equilibrium level.
WHERE IS GROWTH COMING FROM?
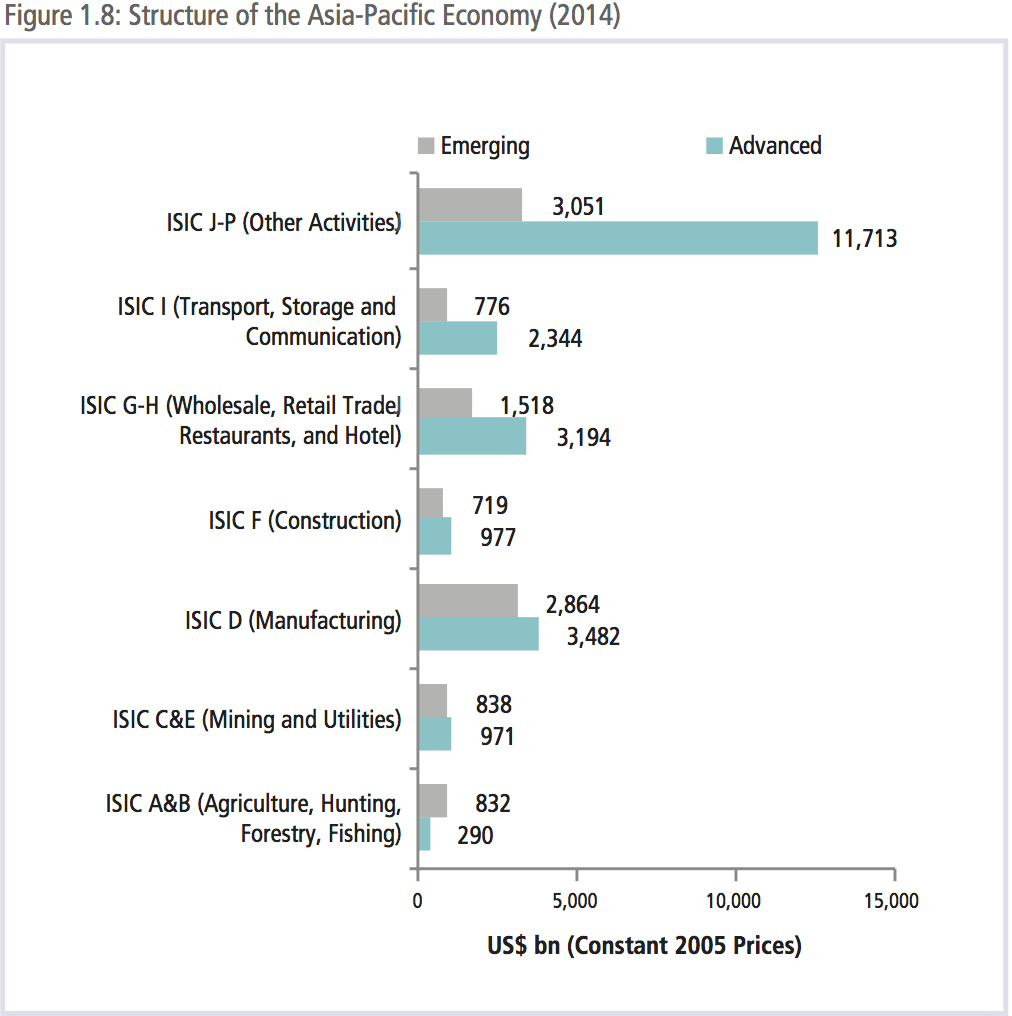
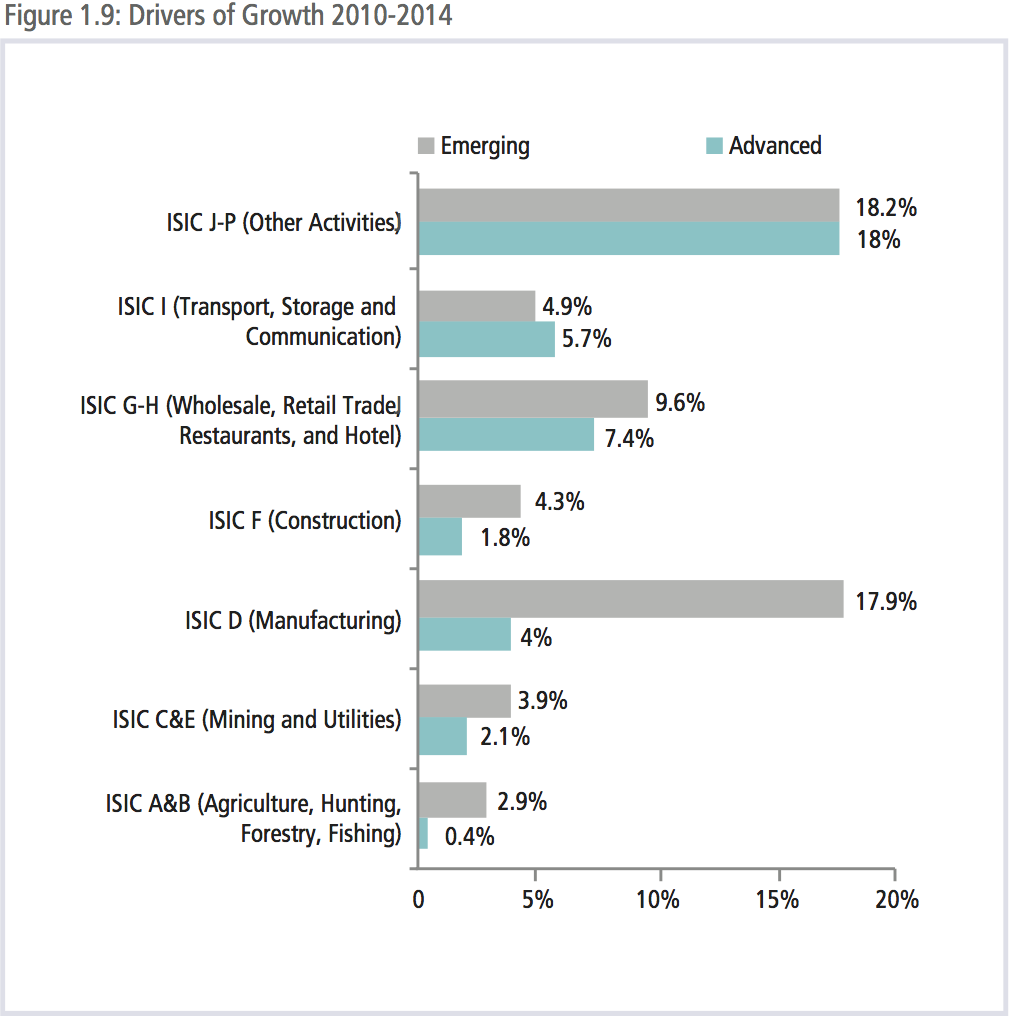
From 2010 to 2014, the Asia-Pacific economy has increased in size (in value-add terms) by close to US$4 trillion dollars or at annualized rate of 3 percent. By far the biggest source of growth has been the services sector (ISIC categories G-P) which contributed 63 percent or US$2.3 trillion of the growth in value-add to the region’s total growth. This was followed by manufacturing (ISIC categories D and F) which contributed close to 28 percent of the region’s total growth or US$1 trillion.
Breaking down the sources of growth further, while the contribution to growth in the services sector was roughly the same for advanced and emerging economies, manufacturing in emerging economies contributed far more to the region’s growth than that of manufacturing in advanced economies. This is indicative of the continuing industrialization process in many emerging markets and the increased importance of the services sector for advanced economies. Moreover, in recent years, manufacturing in the region’s emerging economies grew at an annualized rate of close to 7 percent while only 1 percent in the region’s advanced economies. These numbers need to be put in their proper context. The size of the manufacturing sector in the region’s emerging economies still lags behind that of the region’s advanced economies, in value-add terms at US$2.9 trillion compared to US$3.5 trillion.
As some of the region’s fast growing economies reach middle and high income levels, if they follow the path set by others, they will begin to shift from a focus on manufacturing towards more service sector activities. Even though China has not yet reached middle income level, the proportion of its service sector has been rapidly increasing, now accounting for 44 percent of all value-add activities, while manufacturing appears to have peaked at 35 percent. Given that in more mature economies like Korea services account for 60 percent of value-add in the economy, there is significant room for service sector growth in the region’s emerging economies.
While looking at the regional economy this way helps appreciate how economies in the region are evolving, it fails to take into account the extent to which manufacturing is taking place in global value chains, many of which are operated by globally oriented multinational corporations. Research suggests that the bulk of value-add in global value chains remains in the home economy of the MNCs – for example, the components of the iconic Apple iPhone cost about US$230, while the finished phone retails for US$749. The difference is accounted for by research and development and marketing – in other words, the higher value-adding part of the production process, which is retained either in-house or close to the company’s main headquarters.
SLOWING TRADE GROWTH
While the services sector accounts for by far the largest share of value-add in the domestic economy, the opposite is true in the external sector. The total value of the exports of goods in the Asia- Pacific region is above US$7 trillion while the value of the export of services was around US$2 trillion.
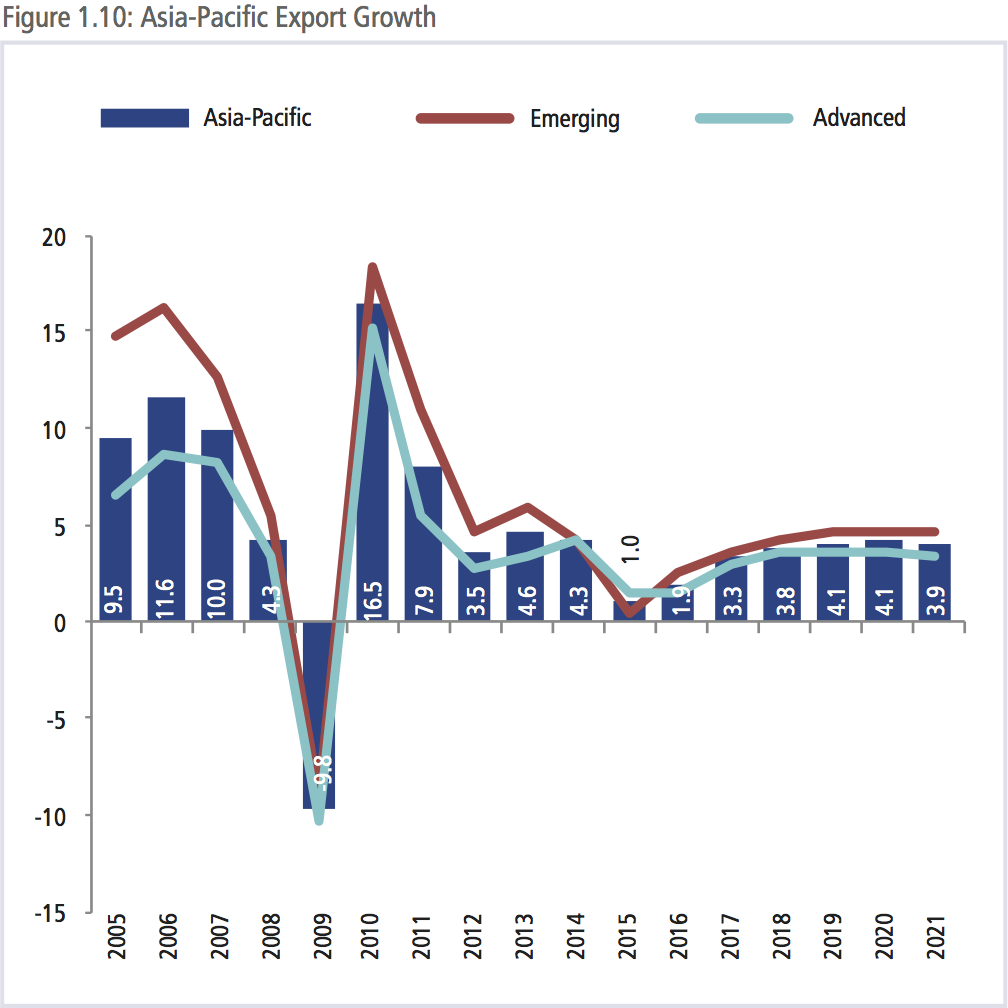
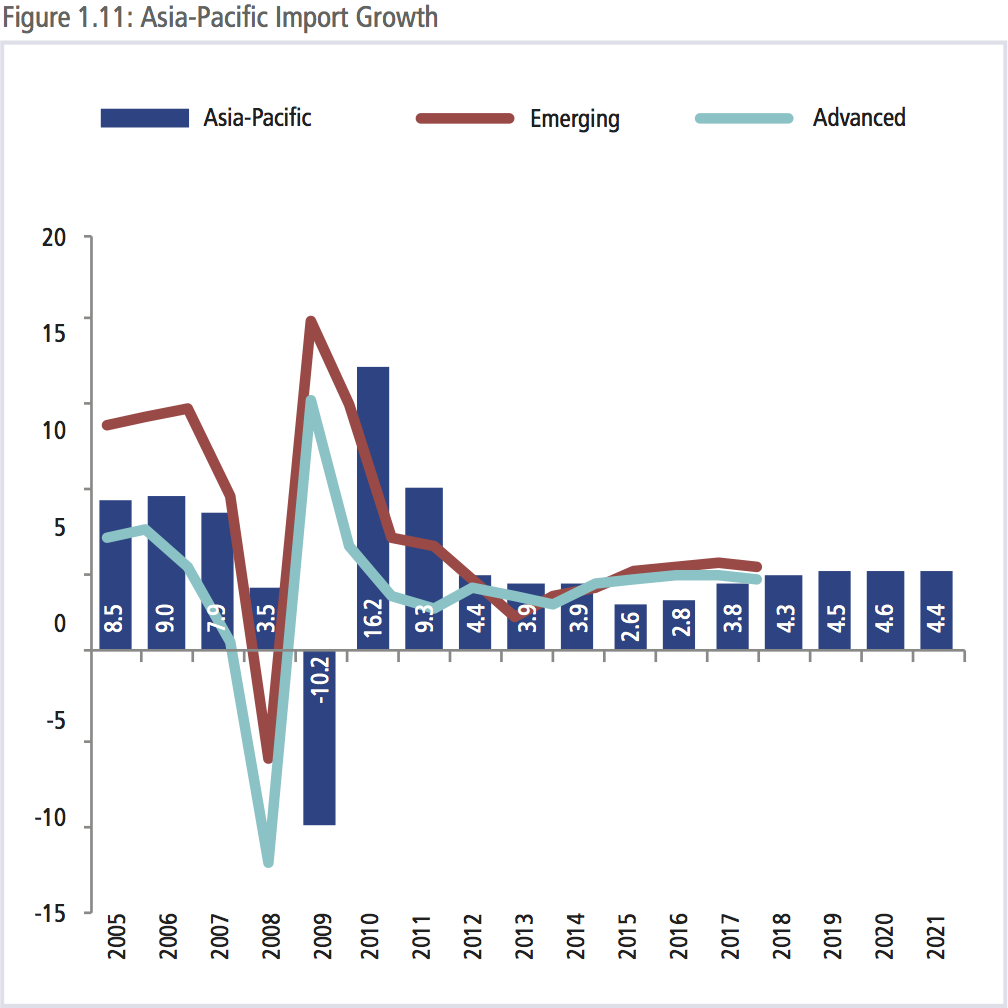
Since the Global Financial Crisis, trade growth has remained slow with the exception of the rebound in 2010. Growth of exports of goods and services is expected to be 1.9 percent this year, a marked improvement over the 1.0 percent in 2015; imports fare better at 2.8 percent growth in 2016 and then 3.8 percent in 2017.
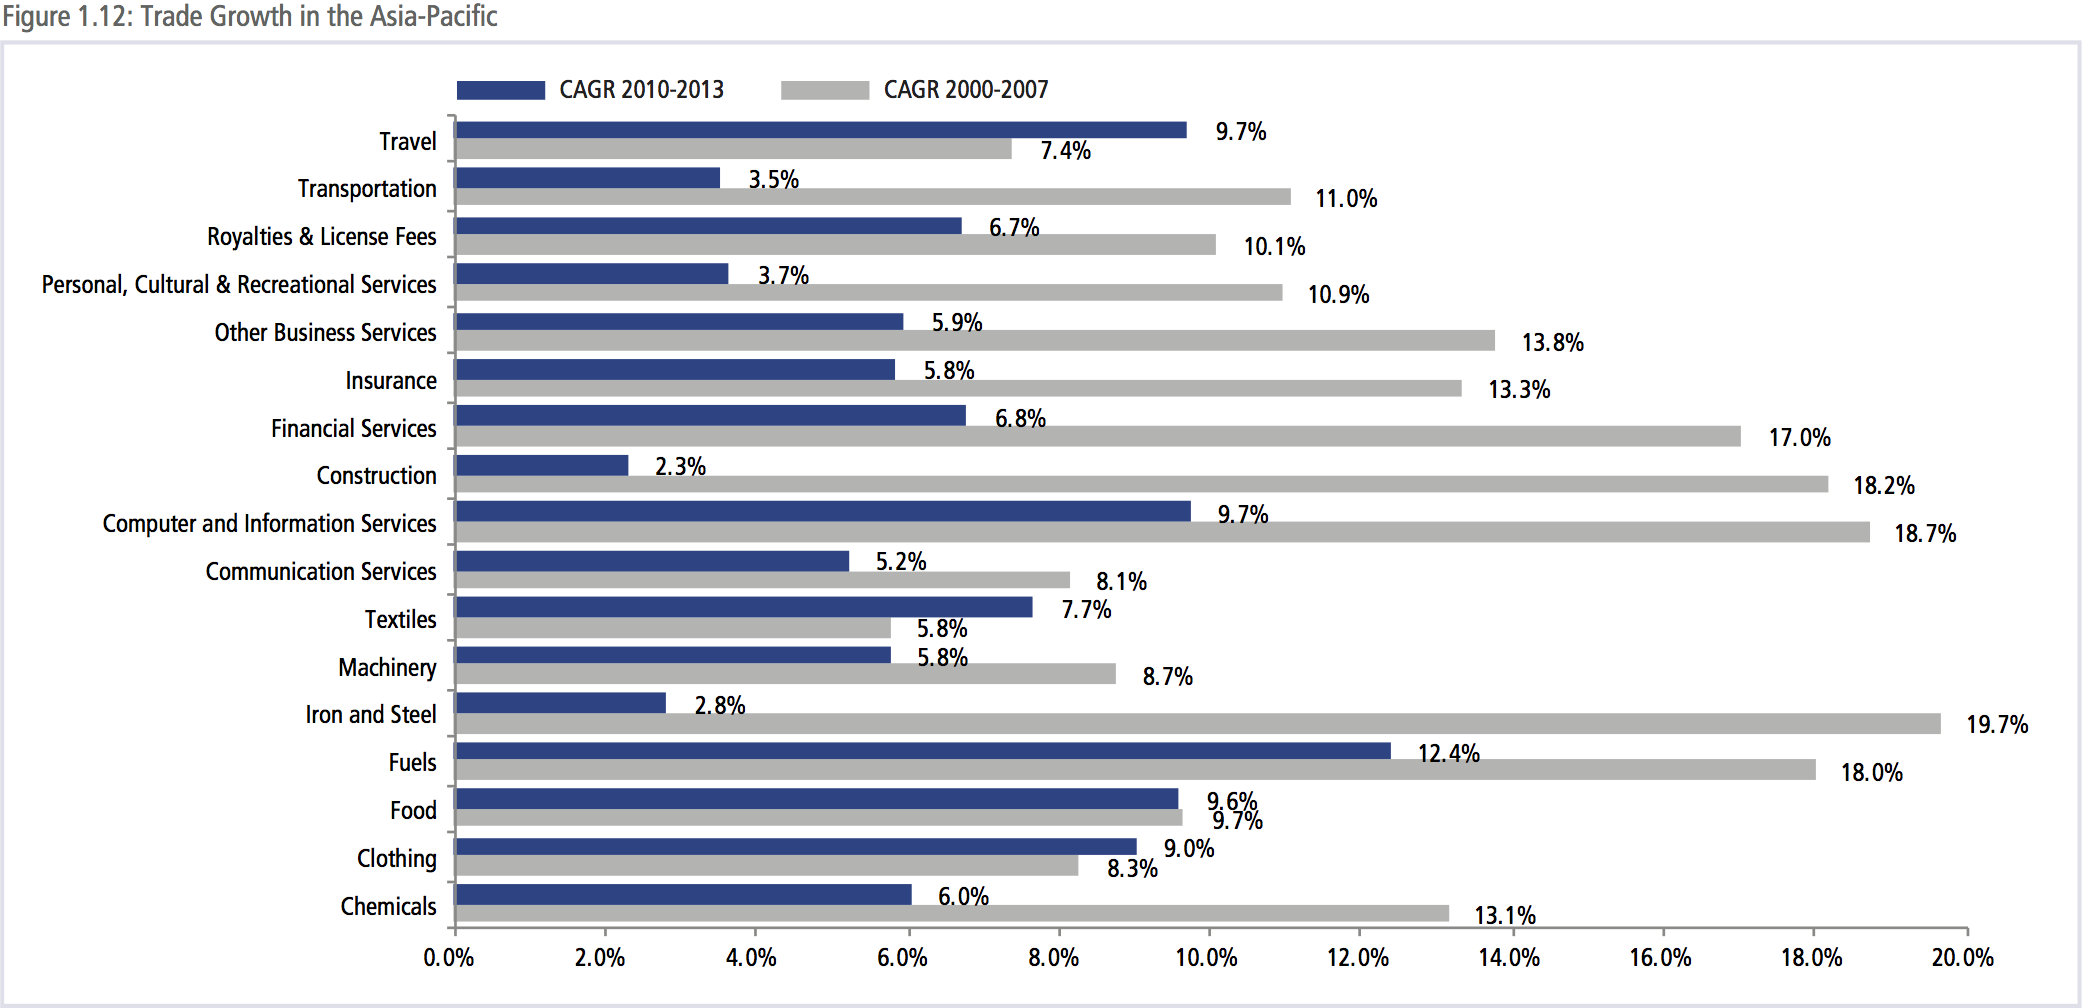
With the exception of exports of travels services, textiles and clothing, the annualized rate of growth across both goods and services has slowed considerably in the post-Global Financial Crisis period.
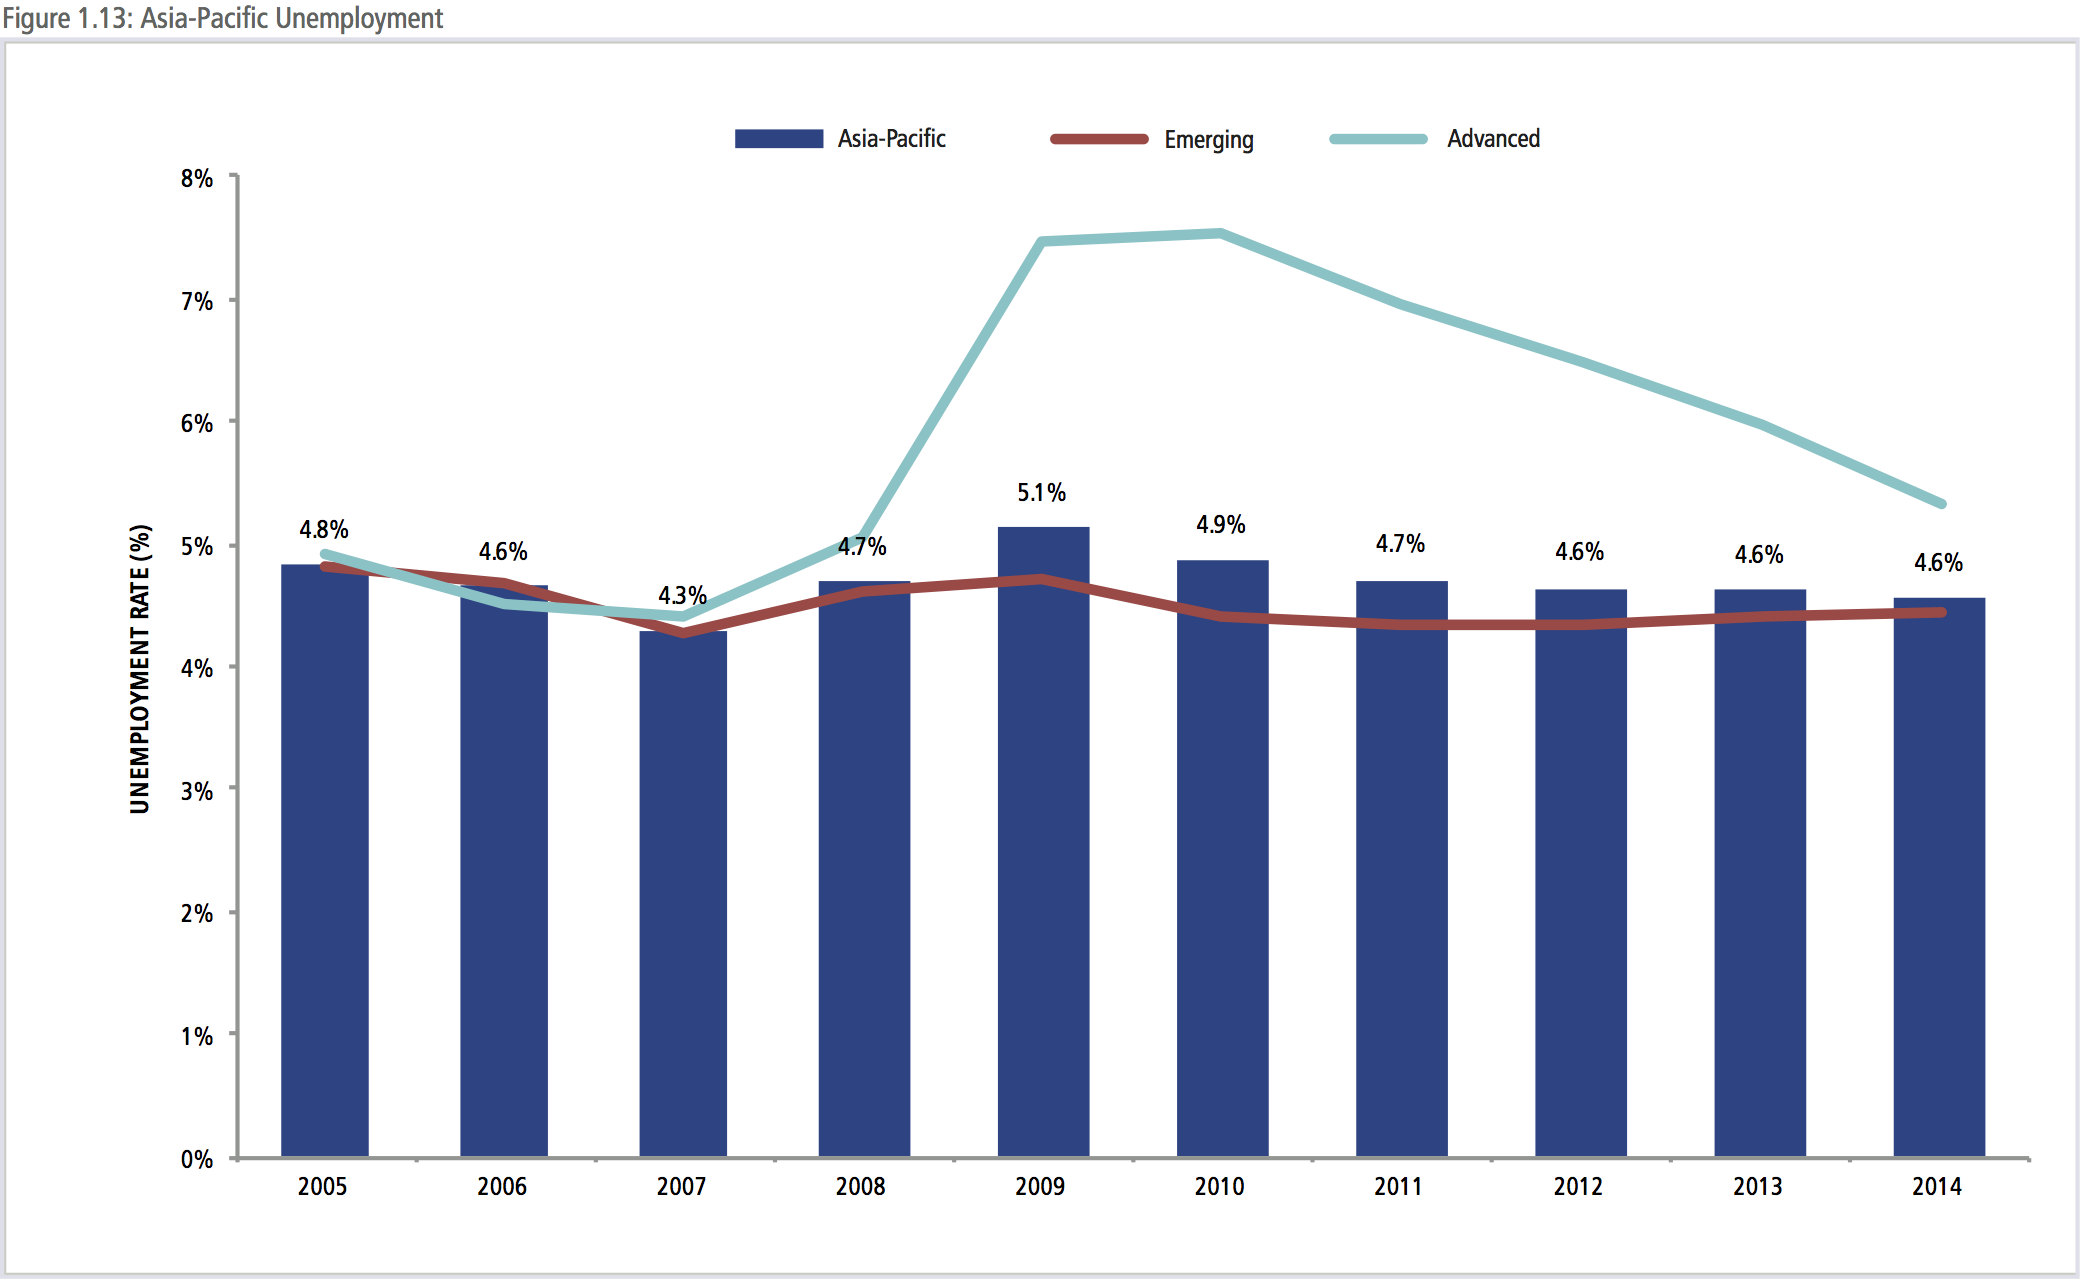
UNEMPLOYMENT LEVELS
The rate of unemployment in the Asia-Pacific region has been on a steady decline since it peaked during the Global Financial Crisis of 5.1 percent. However, there remains a differential between unemployment rates for advanced and emerging economies in the region of around 1 percentage point. Since 2009, the total number of unemployed people in the region has dropped from a high of 104 million to 97 million; this is in spite of the increase in the total working age population of close to 140 million. Put simply, the Asia-Pacific economy has been able to create around 150 million jobs since 2009.
However, there are some important caveats to this part of the story: the labor force participation rate; rates of underemployment and real wage growth; and high rates of informal labor. Since 2006, the labor force participation rate (LFPR) in a number of regional economies has fallen. The LFPR has become an issue of some contention in the United States; analysis from the White House Council of Economic Advisers suggests that half of the decline was due to aging with the balance due to cyclical and structural factors. While unemployment rates are seemingly low in a number of economies, the nature of labor markets and employment varies considerably. For example, in many economies, especially emerging economies, there are very high levels of informal employment. It is estimated that the percentage of those in informal employment ranges from around 32 percent in China to as much as 84 percent in India.
While GDP per capita levels in the region have been steadily increasing, the average increase in real monthly wages shows a very different story. In some economies average real wages have actually fallen while in others the increase in wages reflects the broader economic growth story.
BOX 1.2: US ECONOMY: STILL SEARCHING FOR MOMENTUM
Contributed by Dr. Charles E. Morrison, USAPC / President, East-West Center
The pace at which the Federal Reserve Bank is unwinding its extraordinary post-2008 role in supporting US economic growth has become an overall indicator of the health of the American economy. Although QE is now long ended, the Fed, after much delay, has so far only added a half percent to its Fed funds rate in December, 2015. In September 2016, amidst some debate, it delayed another modest rise out of concern over continued sluggishness of the economy. Federal Reserve Bank chair Jane Yellen provided an optimistic statement of the longer-term US economic prospects and anticipated a rate rise by the end of the year, but the Fed remains cautious, still looking for signs of a tightening in labor markets and significant inflationary pressures. Neither the growth rate nor inflation are at the levels the Fed and many analysts had anticipated last year. Without a real US fiscal policy, it is unclear whether the central bank will ever be in a position to completely separate itself from its economic stimulus role.
The economy’s slow pace so far in 2016 (GDP was up little more than1 percent in the first half) may be partly related to the turbulent US presidential election. Over 60 percent of Americans cited the election as the biggest threat to the economy in an August survey, 5 times as many as terrorism, in second place. An election in which the incumbent cannot run normally raises anxieties over change, but this time, the Republican contender, Donald Trump, promises disruptive change: massive tax cuts and protectionist immigration and trade policies. A study by Moody’s Analytics suggested that if his plans were fully put into effect, however unlikely, unemployment would rise by 3.5 million (to 7 percent) and the economy would be plunged into a two-year recession. Moreover, both candidates are highlighting the economic dangers they see associated with the other’s policies. In this contentious atmosphere, it is not surprising that business and consumers may have hedged on major investments.
The mood should change post-election. Consumer spending has improved and is expected to rise in the final two quarters.
Unemployment remains low, just below 5 percent, but there continue to be few signs of inflationary pressures in the labor market, perhaps because some new entrants are coming from the ranks of those who had statistically left the labor market. The “real unemployment rate” including those working parttime but preferring full-time work and those who had stopped looking for a job is estimated to be still nearly 10 percent. Housing is a relatively positive force, with purchases of new and existing properties on the rise. Manufacturing is expected to be strong, and overall, the economy could increase close to a 2.0 percent annual rate in 2017.
On the negative side, productivity growth remains low, suggesting limited corporate or government investments in physical or human infrastructure that could bring efficiency boosts. There remains debate as to whether the underlying rate of innovation in society has slowed. But there are sources of dynamism over the longer-term. For example, population growth rates in the United States, fueled by the younger age of immigrants, sets the United States apart from most of the larger advanced economies (Japan, Europe) as well as from China. In contrast to these, the US will continue to experience an absolute increase in the size of its labor force over the coming few decades, and in general population growth goes hand in hand with per capita economic growth.
In this regard, the best news in 2016 was the announcement that the US Census Bureau’s Current Population Surveys showed a significant boost in median household income, up 5.2 percent between 2014 and 2015, the biggest boost in many years. Moreover, this data suggests broad-based benefit from the recovery since the figure was up for all regions of the country and ethnicities. At the same time, the poverty rate dropped from 14.8 to 13.5 percent. The median income, however, is still below the 2007 level, and whether the sharp increase represents a trend or a statistical aberration is still a question.
IMPACT OF BREXIT ON THE ASIA-PACIFIC
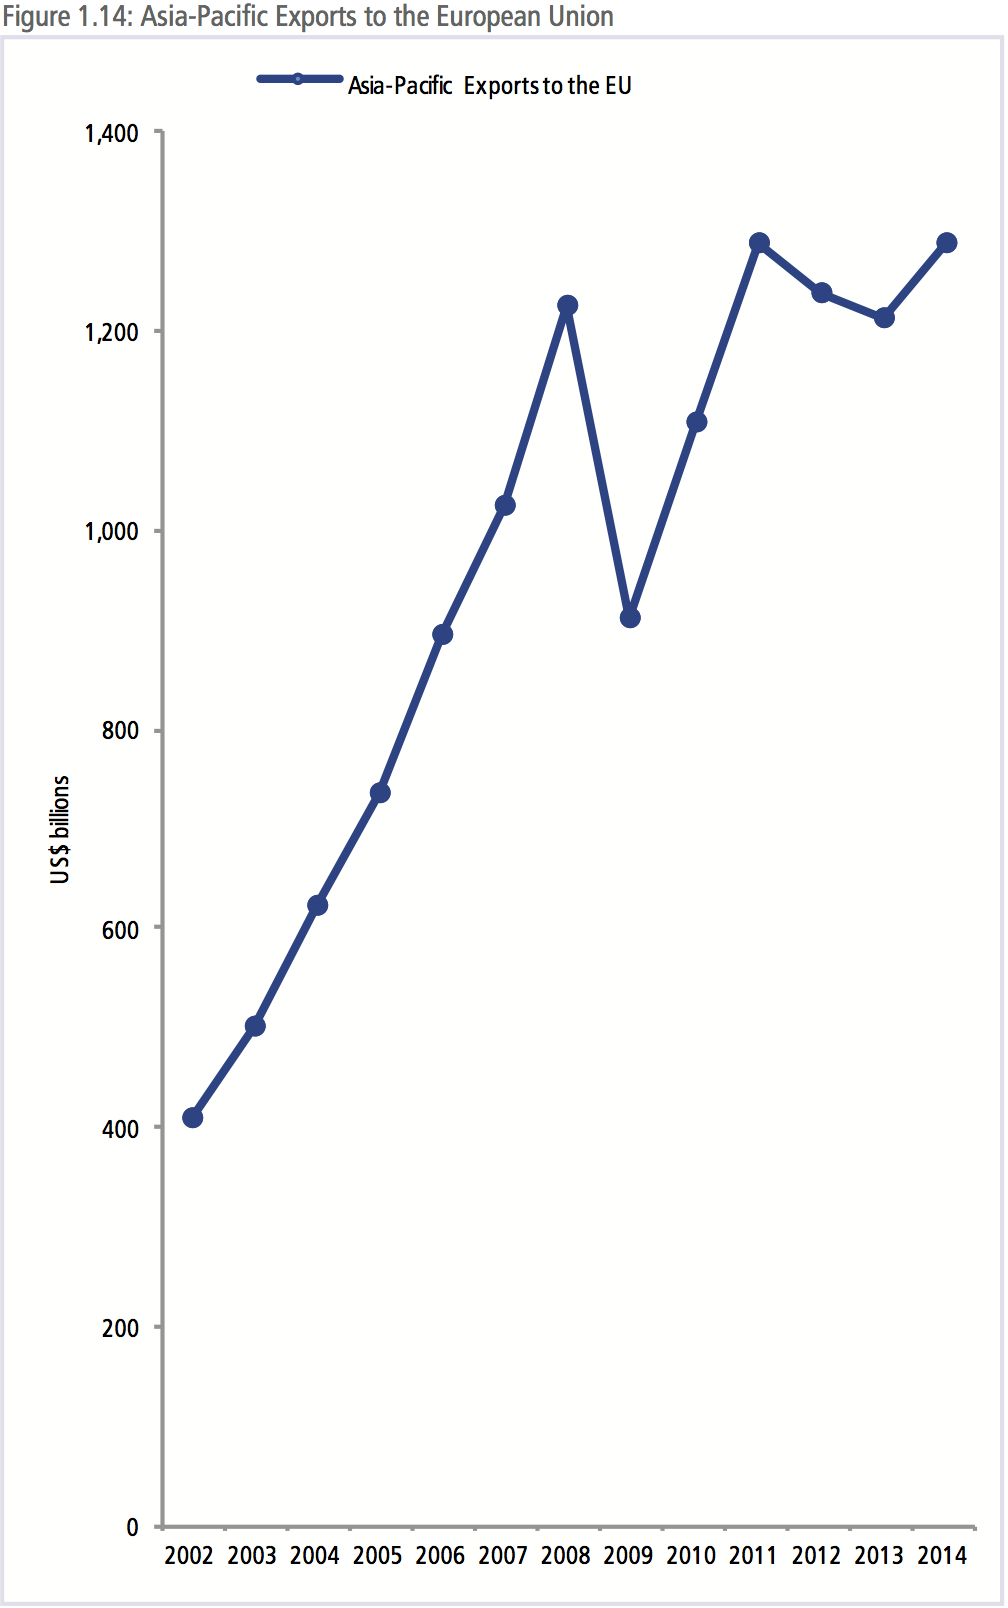
The results of the UK referendum to leave the European Union had immediate and devastating effects on Europe and beyond. The decision introduces another element of volatility into an already extremely fragile global economy. Total exports from the Asia- Pacific to the EU stand at around US$1.2 trillion, or around 15 percent of the region’s total exports. Even though growth in the EU has been subdued, exports to the EU have been steadily recovering to reach pre-Global Financial Crisis levels of over US$1.2 trillion.
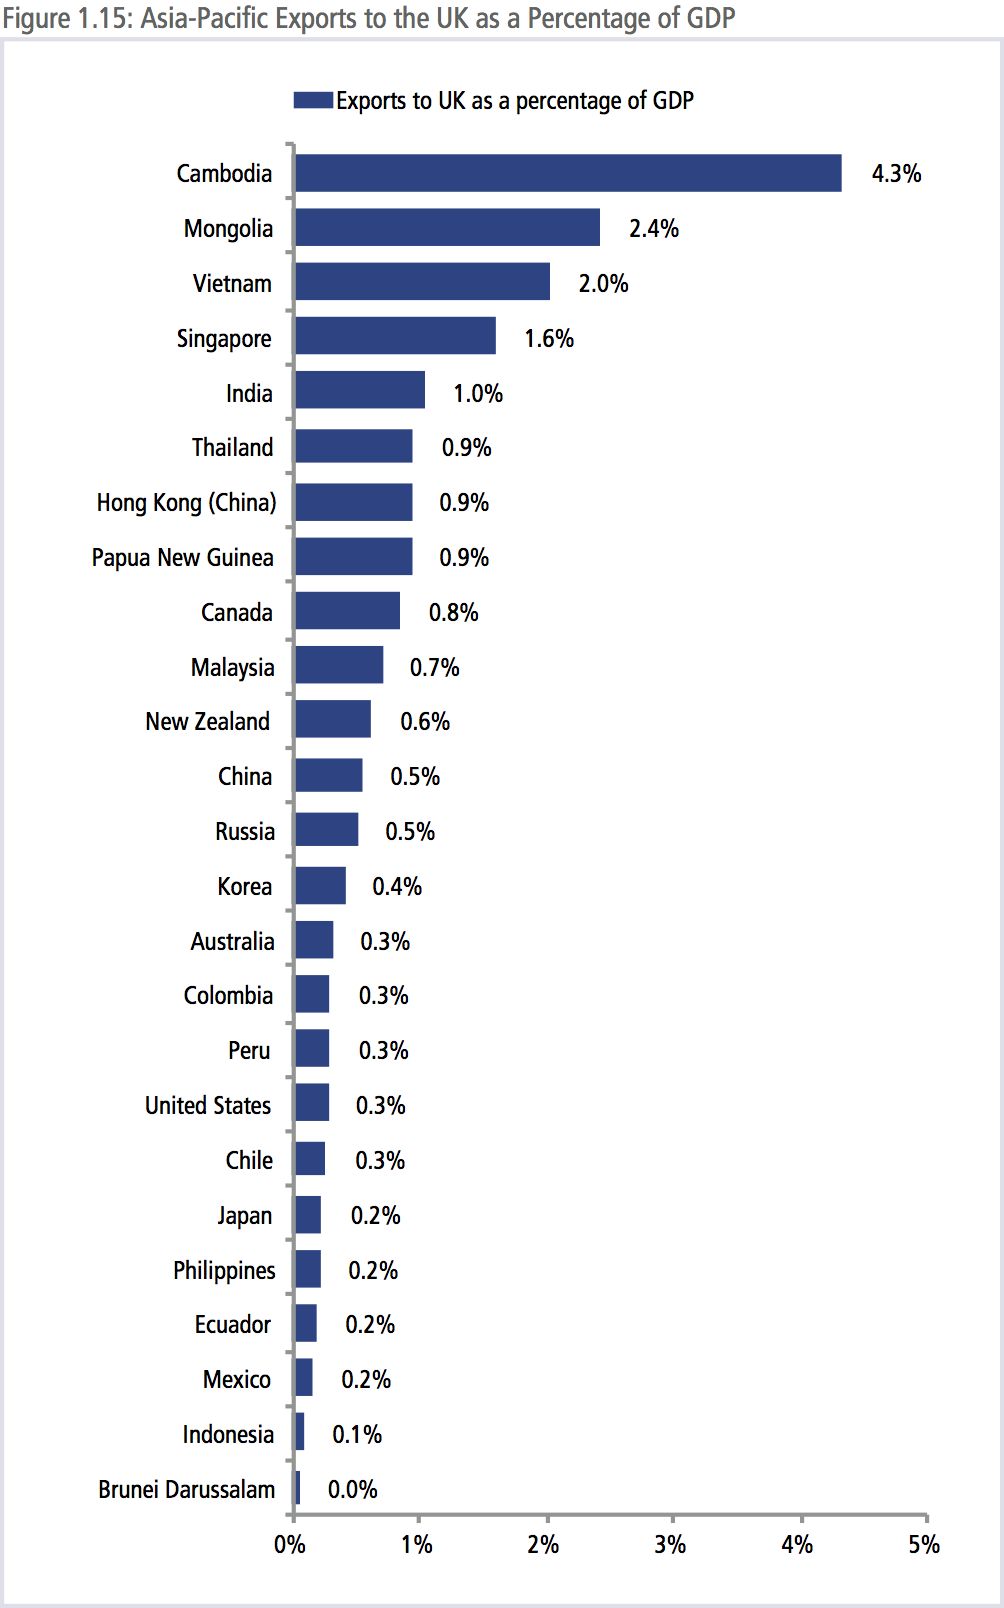
As shown in Figure 1.15, regional economies are not that heavily exposed to the UK in terms of exports/GDP ratio. While the priority for the UK will be negotiating the terms of its future relationship with the European Union, another problem that will impact the economies of the Asia-Pacific is the terms of the UK’s relationship with the region’s economies. Many of the terms that currently define the UK’s relationship with other economies are those extended to the UK as a member of the EU; there is no guarantee that those terms would remain the same when - and if - the UK were to leave.
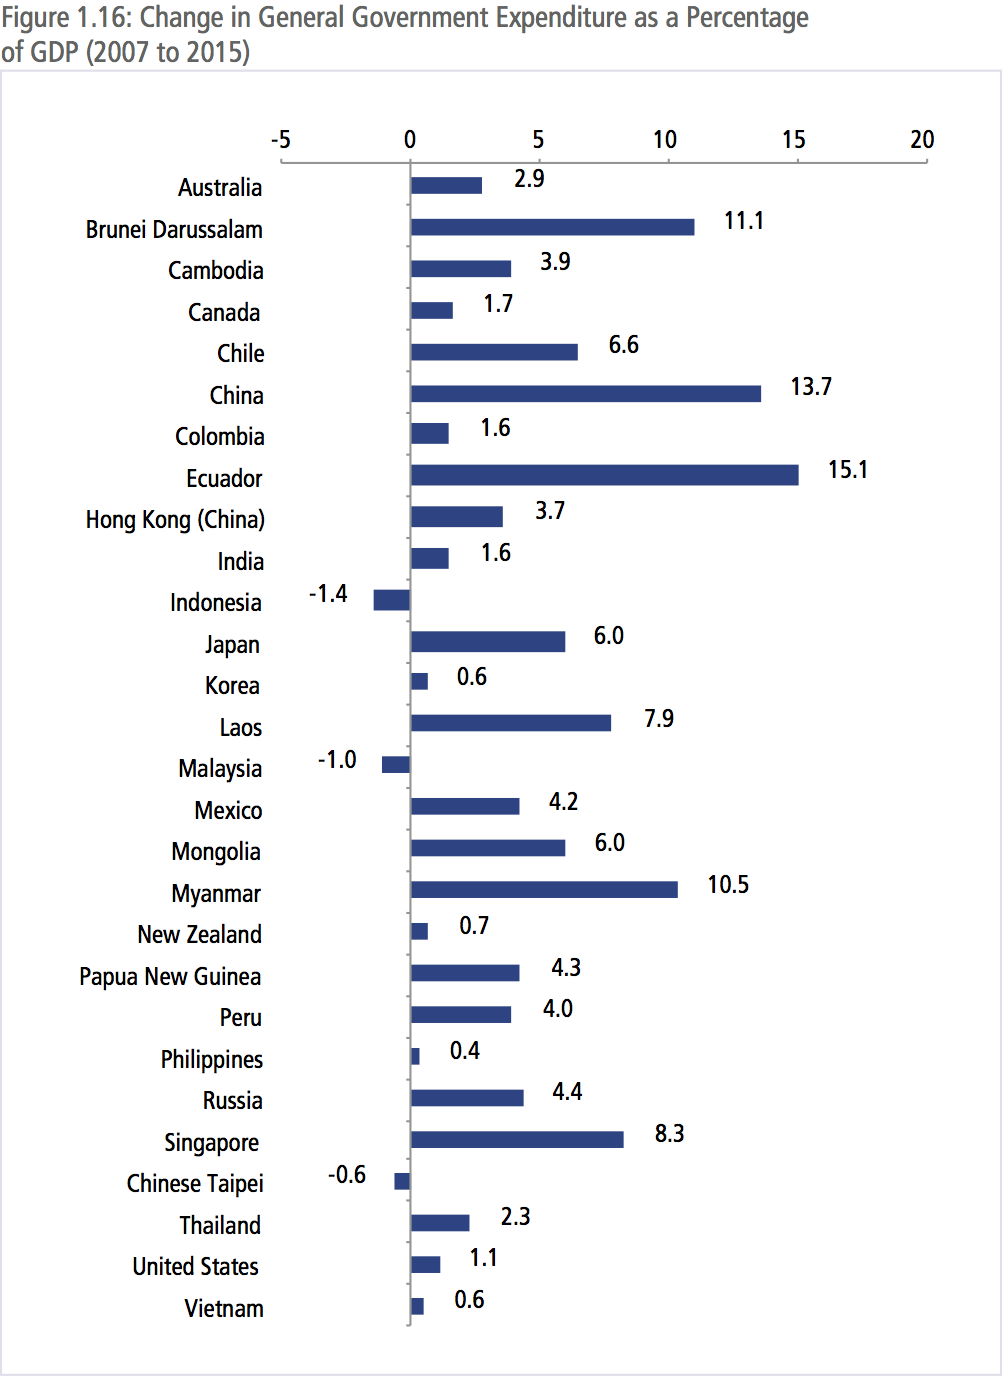
ENGINES FOR GROWTH
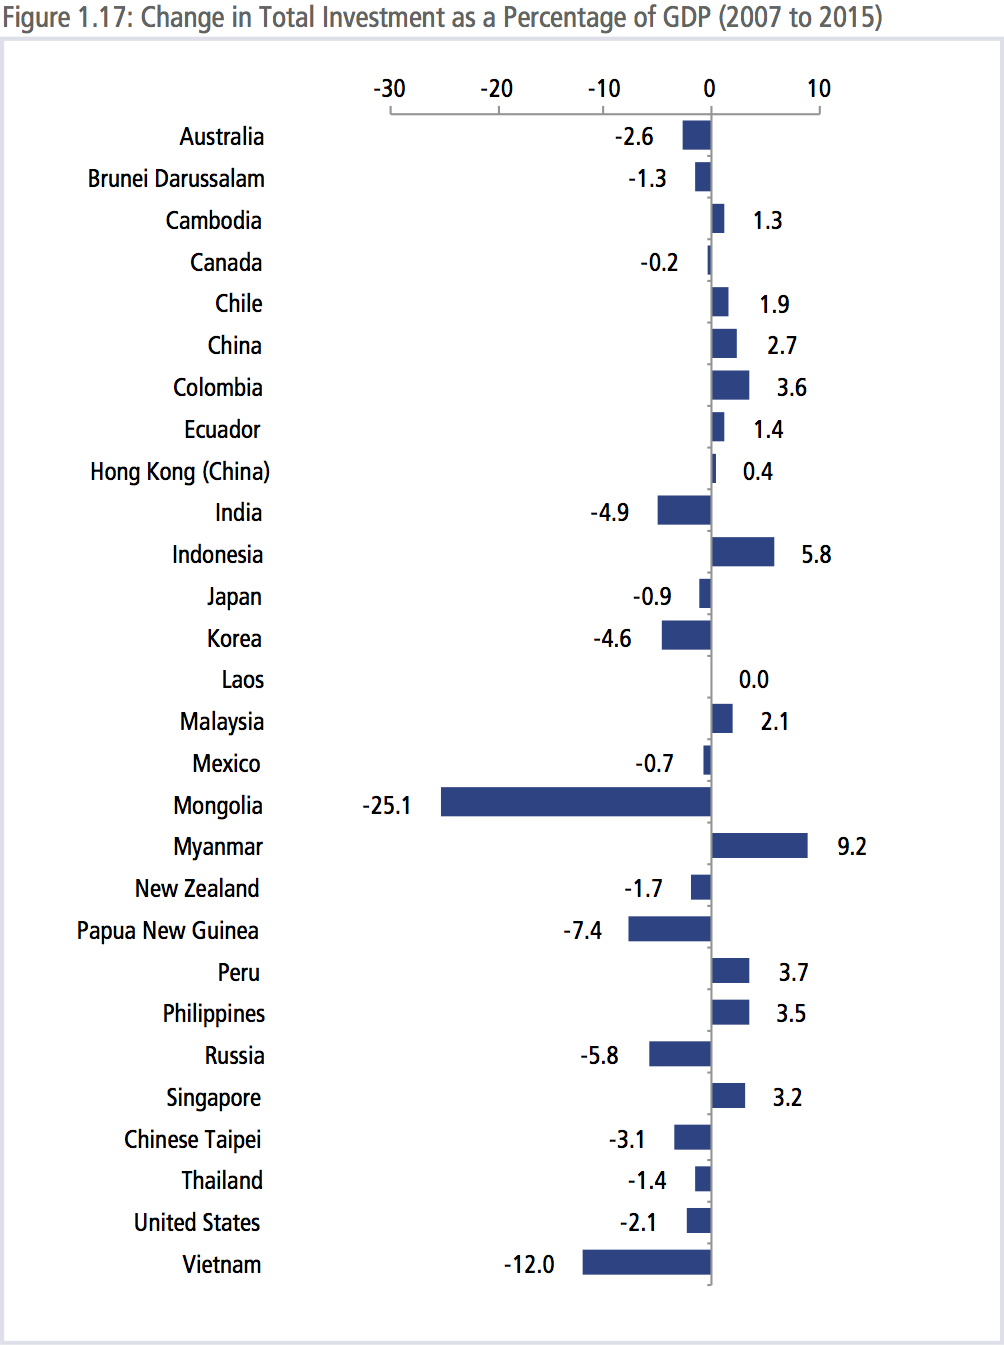
With reference to Figure 1.16, government expenditure as a percentage of GDP has increased for most regional economies since the Global Financial Crisis. Some economies took the opportunity to frontload domestic spending, but conversely, investment as a percentage of GDP has dropped for a number of economies in the region – especially advanced economies.
In 2007, investment accounted for 26 percent of total GDP in the region. By 2015, this had increased to 27.5 percent. Looking more closely however, much of that investment represented increased investment in the region’s emerging economies, especially in China where investment increased from about 41 percent of GDP to a peak of 46.5 percent in 2013. Since then, investment growth in China has slowed down below the rate of GDP growth. These numbers are very large when considered in US$ terms, with investment in emerging Asia-Pacific economies totaling around US$6.8 trillion and for advanced economies US$5.9 trillion. As impressive as these numbers are, growth numbers in investment remains below trend for all advanced economies. On average, investment accounts for about 25 percent of total output, with investment relatively more important for emerging economies.
While investment is cyclical in nature, as shown in Figure 1.18, the downward trend over the past five years should be of concern to policy-makers, evidence of increased cautiousness in the business community since the Global Financial Crisis. The roots of this cautiousness could also be part of a self-fulfilling prophesy preventing the global economy from achieving a full recovery. The business community remains uncertain about the future trajectory of demand and therefore are holding back on investments, thus constraining growth.
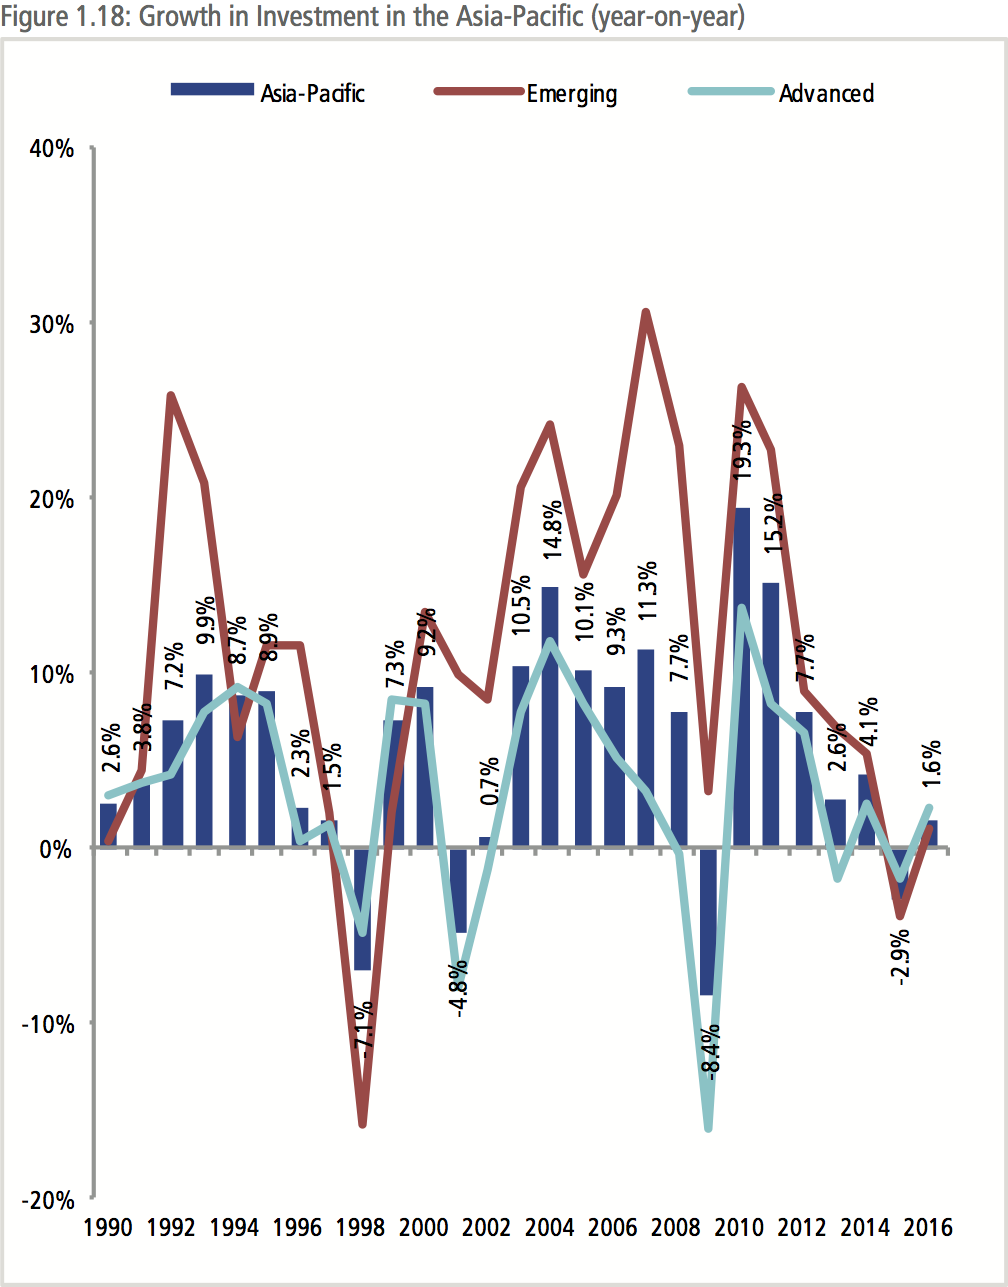
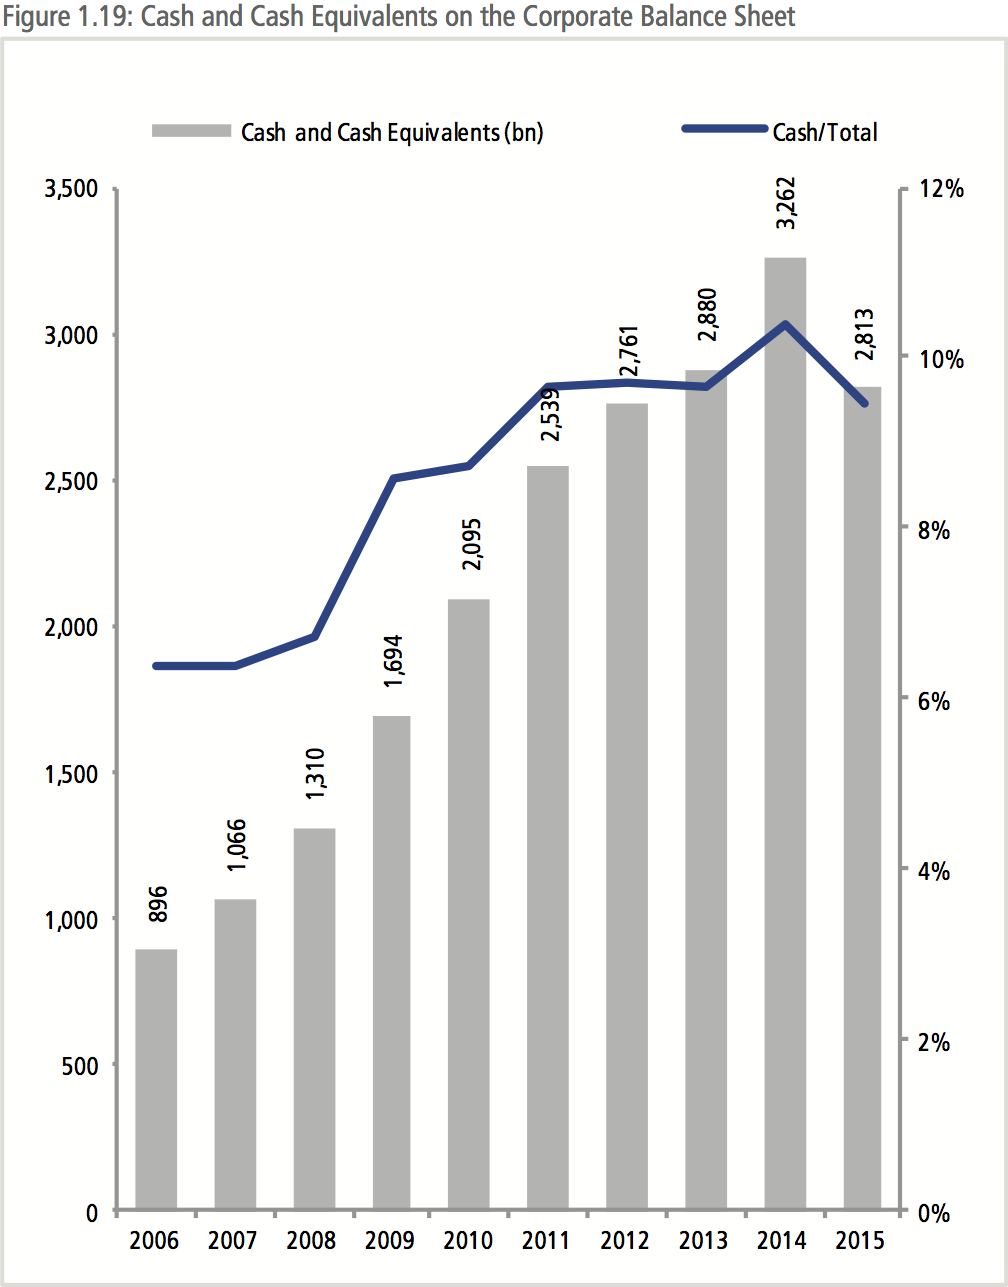
Figure 1.19 shows the amount of cash and cash equivalents held by 100 of the largest companies in the Asia-Pacific region. Since the Global Financial Crisis, the amount of cash as a percentage of total corporate assets had been steadily increasing from around 6.5 percent in 2007, up to 10 percent or around US$3 trillion in 2014. In 2012, then Bank of Canada governor Mark Carney described the phenomenon as ‘dead money’ saying that “their [the corporate sector’s] job is to put money to work. If they can’t think of what to do with it, they should give it back to their shareholders.” The debate that these comments triggered point to a series of policy discussions that ought to be happening that range from corporate governance practices to international and domestic tax policies.
Whatever the ultimate reasons for the corporate anxiety, if the cash/total asset ratio were the same as it was in 2006, it would imply an additional US$1.5 trillion in investment from just 100 companies. This phenomenon is not limited to the financial sector in which mandated reserve ratios have been increasing; indeed, it has been most prevalent in the technology sector.
BOX 1.3: CHALLENGES FOR JAPAN`S ECONOMIC POLICIES
Contributed by JANCPEC
Since returning to office in 2012, Prime Minister Shinzo Abe has launched active economic policies dubbed “Abenomics” consisting of monetary easing, fiscal policy and structural reform. Abenomics has entered a stage where monetary and fiscal policy have been employed in tandem to accelerate structural reform.
Overview of monetary policy
The Bank of Japan (BOJ), under the leadership of Governor Haruhiko Kuroda, introduced an unconventional monetary policy (QQE: Quantitative and Qualitative Monetary Easing) and set an inflation target of 2 percent in 2013. As the BOJ intended, QQE succeeded in bringing down real interest rates2 to boost business and housing investment, and in lowering real exchange rates for the Japanese yen, which was expected to accelerate exports. QQE also pushed up asset prices, including stock prices, inducing credit expansion as well as positive wealth effects. Since its launch, the consumer price index (CPI) has turned positive, and other macroeconomic figures, particularly employment trends, have moved upward. According to an estimate by the BOJ, QQE contributed to filling the output gap by 1.1 percentage points to 3.0 percent.3 However, this trend is not very strong. In July 2016, the CPI, excluding fresh foods, was -0.5 percent and the CPI excluding foods and energy was 0.3 percent.
Despite the expansionary monetary policy, continuous slow economic growth, which might be called “secular stagnation,” has cast serious doubts about achieving the 2 percent inflation target. Lower real interest rates have not generated large investment demand as anticipated. The average annual potential growth rate has been 0.2 percent over the past five years, indicating the highly mature status of the economy. The money stock (M3) and bank lending have grown at a slower pace. Moreover, larger Japanese companies have been retaining rather than reinvesting their substantial earnings. Accumulated retained corporate earnings amounted to 366 trillion JPY – approximately 3.66 trillion USD – as of March 2016. Domestic private consumption and exports have also not boosted the demand. Private consumption stagnated or even fell after the consumption tax rate was increased to 8 percent in April 2014. Exports have grown slowly, buffeted by the slowdown of the world economy. Despite the overstretching the BOJ’s monetary efforts, the recent weak economic figures suggest that monetary policy alone have not been adequate to further revitalize the economy. In view of the limits of monetary policy, the real challenge is how to strengthen the economic structure itself.
Prospects of fiscal policy
At the G7 Ise-Shima summit held in May, the leaders of the G7 economies discussed measures to address the struggling world economy. PM Abe’s efforts as the summit chair to build a consensus around enhanced fiscal policy were not fully successful, but the world leaders agreed to flexible use of fiscal policy together with mutually-reinforcing monetary and structural reform policies. Following the G7 summit, PM Abe first announced a delay in raising the consumption tax rate from 8 to 10 percent and, more recently, a fiscal package of 28 trillion JPY, although the actual amount of fresh spending is only about a quarter of this announced amount. It has been pointed out that the economic impact of conventional fiscal policy in Japan, which typically involves infrastructure investment, have sharply diminished over the past decades. The linkage between long-term economic goals and conventional economic stimulus is also weakening. Hence, budget spending that aligns with long-term policy goals is particularly important. In economic terms, fiscal policy should simultaneously address the supply and demand constraints.
How can we assess the new stimulus package? Some innovative aspects can be recognized in the realm of investment but the real effects of these over the long run remain to be seen. The stimulus package dubbed “Investments for the Future”4 covers four broad areas, of which the first two mainly address supplyside constraints. These two areas account for about half of the 28 trillion JPY total. First, the policies under the category of “Promoting the Dynamic Engagement of All Citizens” are designed to tackle the aging and declining population. The budget will be spent to increase the supply of childcare and elderly care services since more than half of working women quit their jobs after giving birth and that some workers find it difficult to continue their jobs while taking care of elderly family members. The policies aim to create an environment conducive to continuing their careers. Reforms to the traditionally long working hours are also being undertaken. Labor productivity can improve by shifting from a time-intensive working style to a more efficient one. Labor market reform also includes encouraging older people to stay in the workforce and accepting more foreign workers in certain industries. As for human resource investments, scholarships for students will be upgraded to provide more grants and interest-free loans. Secondly, the policies under “21st Century Infrastructure Development” aim to develop potential growth industries and new infrastructure in Japan and overseas. The budget will be allocated to upgrading hard and soft infrastructure to attract more foreign tourists. In 2015, Japan saw a record 19.7 million tourists from overseas, and the government has set a target of 40 million tourists by 2020. Investments will be made to enhance competitiveness in the agricultural sector and to promote exports of agricultural products. As for new infrastructure development, the budget will be spent to accelerate construction of high-speed maglev train lines between Tokyo and Osaka and to promote Japan`s “Partnership for Quality Infrastructure” initiatives overseas via Japan International Cooperation Agency (JICA) and Japan Bank for International Cooperation (JBIC).
Japan`s economic policy goal is to strengthen its economy by addressing long-term structural issues. It will take a long time to achieve this. However, monetary and fiscal policies aligned in tandem with a structural reform agenda should make steady progress toward the ultimate goal.
CURRENT ACCOUNT
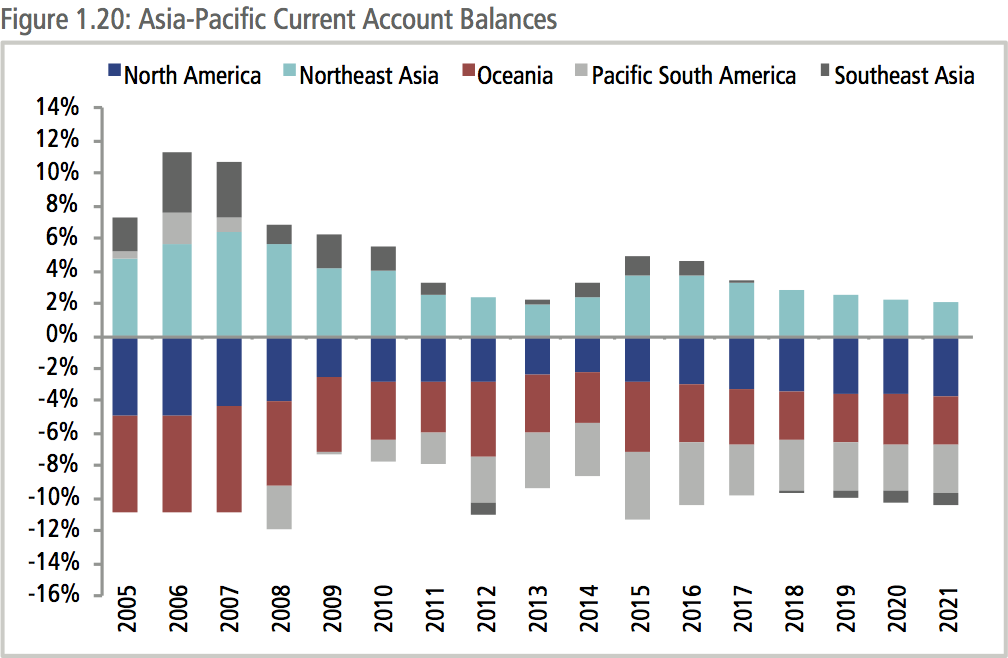
In the run-up to the Global Financial Crisis, one of the key concerns was current account imbalances, and in particular, the ‘transpacific imbalance.’ The US was running deficits that reached a peak in 2006 of close to 6 percent of GDP while China’s current account surplus peaked in 2007 at 10 percent of GDP. Since then the imbalances have receded to more ‘normal’ and sustainable levels. There are some shifts taking place in the structure of the region’s trading patterns. Southeast Asia, long thought of as a region of net exports, is beginning to run current account deficits.
SOUTHEAST ASIA
The ASEAN grouping is expected to grow at 4.5 percent this year, roughly the same rate as in 2015, and then to begin a gradual improvement over the following three years to around 5.3 percent. These growth rates are well below ASEAN members’ previous performance in the 1990s and 2000s. Part of this comes from a maturing of some economies such as Malaysia and Thailand, and also the exposure of a number of economies in Southeast Asia to the poorer external environment.
The end of 2015 marked the formal launch of the ASEAN Economic Community (AEC), a market of US$2.6 trillion and over 622 million people. The objective of the AEC was to create: a) a single market and production base, b) a highly competitive economic region, c) a region of equitable economic development, and d) a region fully integrated into the global economy. Initial work to create the AEC focused on the elimination of tariffs under the ASEAN Free Trade Area (AFTA) starting in 1992 and then the ASEAN Trade in Goods Agreement (ATIGA) in 2010. To date, the ASEAN-6 (Brunei Darussalam, Indonesia, Malaysia, the Philippines, Singapore and Thailand) have 99.2 percent of tariff lines at 0 percent while for Cambodia, Laos, Myanmar and Vietnam (CLMV), the figure stands at 90.86 percent. ASEAN is now working on a broad trade facilitation agenda including the simplification of rules of origin and self-certification processes and an ‘ASEAN Single Window,’ which will create a single point of entry where trade-related documents and information can be submitted to speed up customs clearances and reduce transaction times. ASEAN is looking to further deepen integration through the adoption of the ASEAN Economic Community Blueprint 2025. The objective of the Blueprint is to achieve a “highly integrated and cohesive; competitive, innovative and dynamic; with enhanced connectivity and sectoral cooperation; and a more resilient, inclusive, and people-oriented, people-centered community, integrated with the global economy.”
PACIFIC SOUTH AMERICA
The economies on the Pacific side of South America show a very mixed performance. Commodity exports in economies like Chile and Peru have been affected by lower commodity prices but macroeconomic reforms have helped them remain much more resilient than they would have otherwise been. As they integrate their markets through the Pacific Alliance, the expectation would be that businesses would see the potential of a single market and single production base in the region.
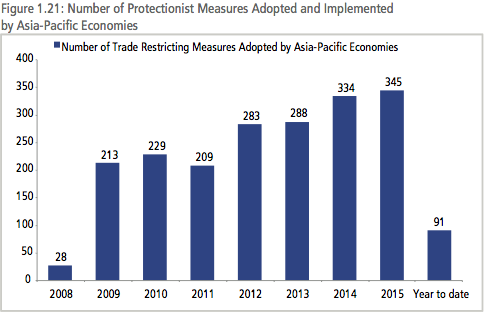
THE RISING SCEPTER OF PROTECTIONISM
Although it has been more than seven years since regional and global growth slumped as a result of the Global Financial Crisis, the damage it wrought continues to bear heavily on the world economy. The swift action from the international community through the newly created G20 and APEC economies prevented what could have been a repeat of the Great Depression. Critical among the policy responses was an unequivocal rejection of the adoption of protectionist measures. While this prevented the type of tit-for-tat tariff hikes that characterized trade policy in the 1930s, since 2008, according to data from the Global Trade Alert, there has been a steady increase in the number of trade-restricting measures that economies have been implementing. While some of these measures may comply with global trade rules they nonetheless have the impact of restricting already tepid trade growth. These include trade finance for local companies, trade defense measures, localization requirements in public procurement and import tariffs.
BOX 1.4: PACIFIC ALLIANCE: MEETING EXPECTATIONS
Contributed by Loreto Leyton, CHILPEC / Executive Director, Chile Pacific Foundation
As APEC returns to Peru for the second time in eight years, the landscape of regional economic integration has changed considerably since 2008. ASEAN’s milestone of achieving Economic Community has passed, negotiations for the TPP have been concluded and those for the RCEP are expected to be completed by the end of 2016. The 2013 State of the Region report included a chapter on the Pacific Alliance titled: “Pacific Alliance – Deep integration, deep expectations.” In spite of changes in governments, the process has proved to be successful so far. The Additional Commercial Protocol to the framework agreement of the Pacific Alliance entered fully into force on May 1st 2016.
One of the challenges ahead is to continue deepening the agenda and reach new agreements in areas such as financial integration, and services. Another important challenge is to implement what has already been agreed through the Commercial Protocol.
While governments work hard to fully comply with what was agreed, they are also starting more formal conversations with other economies, blocs and regions in order to develop a working agenda between them and the PA as a whole. As was stated in the PA Charter, one of the main objectives of this group after achieving their integration is to explore new markets, specifically in the Asia region.
Pacific Alliance and ASEAN
In this regard, the Ministers of the Pacific Alliance met with their counterparts in the Association of Southeast Asian Nations (ASEAN) on September 2014, in the context of the United Nations´ General Assembly. They stated their willingness to develop a space for dialogue and mutual understanding, and also, to reflect on the possible topics and initiatives of an agenda for joint work between the Pacific Alliance and ASEAN. Later, in May 2015, Ambassadors and Representatives of the Pacific Alliance and the Permanent Representatives Committee of ASEAN met in Jakarta, Indonesia, to define an initial agenda of issues, such as energy and minerals, trade facilitation, innovation, logistics, infrastructure and small and medium enterprises.
On the occasion of the 70th session of the UN General Assembly in New York, in September 2015, the Ministers of the Pacific Alliance met again with their ASEAN counterparts in order to continue strengthening the links between PA and other Asia- Pacific economies. They presented the advances “that have obtained both integration mechanisms and agreed to promote closer economic cooperation to facilitate trade and investment flows between the two regions for mutual benefit” (“Pacific Alliance identifies areas for cooperation with ASEAN,” 2016)5 On May 10th 2016, another meeting was held between the PA and ASEAN representatives in Bangkok. They focused on developing a framework document on economic cooperation, education, mutual knowledge and innovation that could be endorsed by their Ministers of Commerce during the next UN General Assembly.
Pacific Alliance and APEC
At the 23rd APEC Economic Leaders’ Meeting in 2015, an informal dialogue between PA and APEC economies took place, which was co-chaired by Peru and the Philippines. This meeting explored possible synergies and opportunities between the PA and APEC agendas. Among other things, they analyzed the progress of regional economic integration and collaboration opportunities, identifying at least three areas of cooperation—participation of SMEs in global value chains; regional integration and human capital development.
APEC has spoken against protectionism, but much more needs to be done. With the Doha Round effectively dead, trade liberalization has moved toward plurilateral negotiations. The bilateral trade agreements of the 2000s are now being replaced by mega-regional deals such as the Trans-Pacific Partnership (TPP), the Regional Comprehensive Economic Partnership (RCEP), the Trans-Atlantic Trade and Investment Partnership (TTIP), and the Pacific Alliance (PA). Nonetheless, the fate of some of these ‘second best’ solutions hang in the balance.
While the TPP negotiations have been concluded with an agreement signed on February 4th 2016, the agreement does not enter into force unless at least six or more of the twelve signing countries representing at least 85 percent of the group’s GDP have completed ratification procedures. This means that inaction by either Japan or the United States could nullify the agreement. While Japan has begun its ratification procedures, the negative positions on the TPP on the part of both US presidential candidates makes US ratification any time soon extremely unlikely.
Although the RCEP negotiations began four years after the TPP, 14 negotiating rounds have now taken place, having missed the first deadline of the end of 2015 for conclusion. In comparison, the TPP took 19 rounds plus numerous officials’ and ministerial meetings. It is far from clear whether or not the RCEP will meet its deadline for completion by the end of the year. Both the TPP and RCEP offer the Asia-Pacific region tremendous opportunities for boosting economic growth. Economic estimates suggest that the TPP could boost baseline global GDP by over US$200 billion and the RCEP US$650 billion. If these two tracks should eventually result in an Asia-Pacific free trade area, it would provide a boost of over US$2 trillion to global output by 2025.
The likelihood of this happening remains in the balance. The political atmosphere in the US has become ambivalent about the TPP, and some argue that the results of the UK referendum to leave the European Union represent a deeper and broader backlash against integration and globalization. Public views on the benefits of trade remain mixed. According to a 2014 survey undertaken by the Pew Global Institute, 50 percent of those surveyed in the US thought that trade destroyed jobs and 45 percent thought that trade lowered wages. This compares with attitudes in China where 67 percent of those surveyed thought that trade led to job creation, 61 percent to higher wages. During the PECC conference held in partnership with the Jakarta Post last April, then Indonesian Trade Minister, Thomas Lembong stressed the importance of public communications to explain the benefits of trade to “men and women on the street in very simple terms without which there will not be public support for regional economic integration.”
INTEGRATION AND INEQUALITY
A longer term structural issue in the region and the world is increasing income inequality. While increases in GDP per capita across the Asia-Pacific region have undoubtedly raised millions in the region above the poverty line, the income share of the richest has been rising disproportionately faster than the rest of society. The linkage between globalization and income inequality has long been an issue on the regional and global agenda but this concern has come increasingly to the forefront in recent years. In the aftermath of the 1997-98 Asian crisis, some fundamental questions on the nature of globalization were asked:
- Has inequality among economies increased ordecreased?
- Has inequality within economies increased?
- Is globalization responsible for increased inequality indeveloping economies?
- What can explain the disappointments of recentglobalization?
These questions were posed at the PECC General Meeting in 2001 by Paul Krugman. The conclusion at that time was that the benefits of globalization and integration far outweighed the costs, but that the downsides should “alert all of us in the region to the need to prepare forward-looking capacity building programs which can act as insurance against tomorrow’s emerging concerns about globalization.”6 While addressing income inequality has long been on the regional agenda, since the Global Financial Crisis a framework has been put in place through the APEC Growth Strategy to ensure that future growth is more sustainable and inclusive. The challenge today is that the pace of structural changes is accelerating with the wider and deeper uptake of technology. The Global Financial Crisis accentuated many of these changes that the policy community has largely been unable to effectively address. Much more needs to be done to deal with the structural changes taking place both internationally and within the region’s economies. Although trade, integration, and globalization have all too easily been blamed for many of socioeconomic problems that individuals, companies, and communities face, those critiques fail to take into account the tremendous benefits that have come with deeper integration in the long run. While much of the focus on the regional agenda has been on the benefits of integration, it might also be worthwhile articulating the cost of a stalling or even a reversal of the process. Estimates by the UK Treasury suggest that the cost to the UK of Brexit would be a reduction to baseline GDP of between 3.4 to 9.5 percent after 15 years depending on the type of relationship the UK is able to develop with its trading partners in the European Union.
Given the sentiments towards freer trade and globalization, the Asia-Pacific would do well to set a forward-looking agenda that addresses concerns about rising incoming inequality and wage stagnation. As is argued in the next chapter, this would involve deepening integration, especially in services sector where the majority of people in the region now work. In a 21st century economy, an efficient services sector is a prerequisite to efficiency in all other sectors – manufacturing, mining, and agriculture.
<< Previous
Next >>