Chapter 3 - Measuring economic integration in the Asia-Pacific region*
* CONTRIBUTED BY DR. BO CHEN
 The economic integration of the Asia- Pacific region has been one of the defining characteristics of the past quarter of a century supported by technological change and policy changes such as the liberalization and facilitation of the flows of goods, services, capital and people. PECC’s index of economic integration attempts to measure the extent to which the process is deepening.
While some might consider the integration and globalization processes as inevitable, one startling result of the Global Economic Crisis was the onset of ‘dis-integration’ with trade and investment flows dropping at a much faster rate than overall economic activity. Indeed, many had feared that the response to the crisis would be similar to that of the Great Depression with economies adopting protectionist policies in an attempt to ‘protect’ domestic industries at a time of poor growth. However, a concerted effort by organizations especially APEC and the G20 led to pledges to avoid all forms of protectionist measures avoiding the types of tit-for-tat raising of barriers to trade that characterized the global economy in the 1930s.
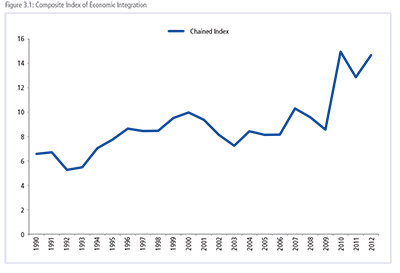
The result of that concerted action is seen in the changes in the index of integration since the crisis with integration rebounding quickly from the drop between 2009-2009 to new highs this year. However, the crisis years serve as a warning that integration is not inevitable and can be reversed placing a high priority on actions to maintain momentum in the policy reforms to continue the integration process.
The index measures the degree of integration taking place in the Asia-Pacific region based on intra-regional flows of: goods; investment; and tourists and five measures of convergence: GDP per capita; share of non-agriculture to GDP; the urban resident ratio; life expectancy; and share of education expenditure in GNI. The index was developed in 2008 as a tool to measure the degree of integration taking place in the Asia-Pacific. Regional economic integration has become a core objective of the Asia Pacific Economic Cooperation (APEC) forum. The process of economic integration is commonly defined as the freer movement of goods, services, labor, and capital across borders.
The degree of economic integration can be analyzed at bilateral, regional, and global levels. Even though the Asia-Pacific region is not covered by a single trading agreement, there is much anecdotal evidence to suggest that it is becoming more integrated. As defined by APEC membership, the region consists of not only developed economies such as the US, Japan, Canada, and Australia, but also emerging markets such as the ASEAN economies. It is well known that parts of the region are already highly integrated through production networks that facilitate trade of intermediate and finished goods across borders. Since 1998, many economies in the region have negotiated bilateral and sub-regional free trade agreements with partners in the region as well as outside the region. APEC Leaders have also endorsed a proposal to investigate the idea of a Free Trade Agreement of the Asia Pacific (FTAAP), which if successful, would constitute the largest regional trading bloc in the world.
An important feature of the index is that it excludes trade and investment flows among geographically contiguous sub-regional trading partners, namely NAFTA, the ASEAN Free Trade Area, and Australia-New Zealand Closer Economic Relations. It also excludes flows between China, Hong Kong (China), and Chinese Taipei. This is to control for the effect that sub-regional flows may have on the index, whereby a very high degree of integration among, for example, NAFTA economies could result in a falsely high measure of integration with the Asia-Pacific region as a whole.
Furthermore, since the trade, investment, and tourism measures are calculated relative to global transactions, the index will rise for a given economy only if that economy’s share of trade/investment is growing relative to total trade and investment.
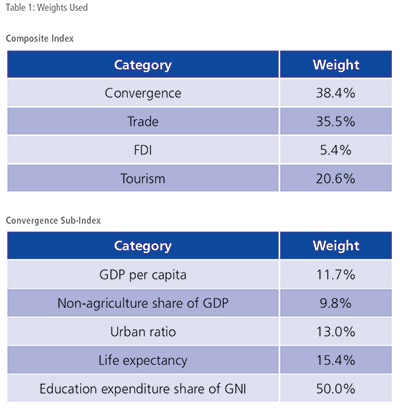 The weights given to each dimension are determined using principal component analysis.
The convergence measures are premised on the notion that integration will lead to greater uniformity among the economies. Accordingly, more trade and investment among regional partners may not translate into a higher score on the integration index if at the same time the partners are diverging in terms of income, education, life expectancy, urbanization, and economic structure.
Caution should be exercised in the interpretation of these findings. The measures chosen for inclusion in the composite index are imperfect indicators of “convergence” and trade/investment integration. The rankings in turn should not be read normatively as “league tables” in the sense that a higher ranking is superior to a lower ranking. Indeed, a low ranking may simply indicate that an economy is more oriented globally than regionally, as is likely the case for China and the United States.
Nevertheless, the change in index value for a given economy over time can be read as a measure of its changing economic orientation. The index value for the region as a whole can also be seen as a measure of closer economic ties among Asia-Pacific economies and as one indicator of APEC’s success.
The 2015 update to the index is based on data from 2012. Missing data were approximated using standard interpolation and extrapolation techniques.
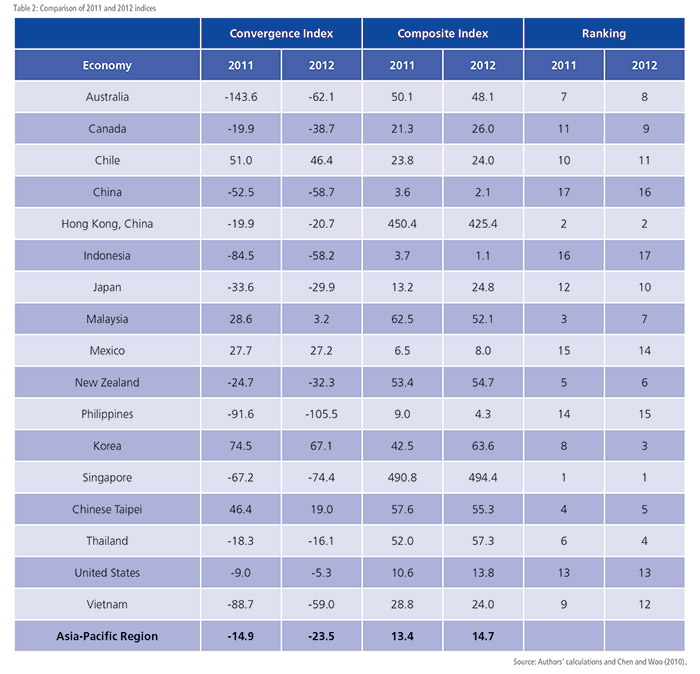
The index has reached its highest level over the twenty year period. After a sharp increase in 2010, the index declined again in 2011 and then resumed the increase trend in 2012. It mainly results from the rebound of trade and tourism. However, the convergence indices kept on declining at a fast pace. The 2012 update to indices by economy shows how the overall convergence process had been suspended since 2011; as a result, 11 out of the 17 included Asia- Pacific economies diverge farther away from the mean level of the Asia-Pacific region in 2012.
Noticeably, Singapore and Hong Kong (China) are still the most integrated economies in the region. Singapore’s level of integration increased slightly from 490 to 494 yet Hong Kong’s decreased a little from 450 to 425. As the freest business harbors, Hong Kong (China) and Singapore benefit the most from economic integration in trade, investment, and tourism.
The two largest economies in this region, namely the United States and China, are still near the bottom in the ranking. It indicates that they may nevertheless be more integrated with other regional or sub-regional markets.
ASIA-PACIFIC TRADE FLOWS
Figure 3.2 shows the share of Asia-Pacific intra-regional imports and exports to regional GDP. After various economic stimulus plans, regional economies showed some recovery in terms of intraregional trade flows. Over the twenty-year period, intra-regional flows of exports and imports (over GDP) have increased from 14 percent to 15 percent. It should be re-emphasized here that this index discounts flows among sub-regions: the economies of Southeast Asia, North America and those among China, Chinese Taipei and Hong Kong (China).
The share of Asia-Pacific intra-regional merchandise trade recovered from the big hit in 2009 to pre-crisis levels of above 15 percent. However, it is still noted that the recovery is not smooth among included economies. Indonesia, Singapore, China, Hong Kong, Chinese Taipei, Korea, Australia, New Zealand, and Chile all showed slight decrease in the Asia-Pacific share of their total trade. Noticeably, this economies are either highly dependent on China’s demand on natural resources or have close ties with China’s economy, whose growth has been slowing down since 2012.
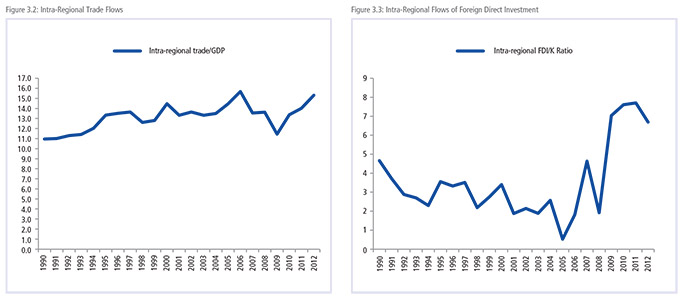
FOREIGN DIRECT INVESTMENT
Compared to flows of goods, intra-regional flows of investment show a much more erratic pattern as shown in Figure 3.3. After the large decrease in FDI flows in 2008, they rebounded by over 200 percent year-on-year between 2008 and 2009, kept the trend till 2011. However, the unstable global and regional economic recovery eventually worried the investors such that the intra-regional investment declined by almost 3 percent. Many economies, especially the US and China, contributed less in terms of intra-regional FDI.
TOURISM FLOWS
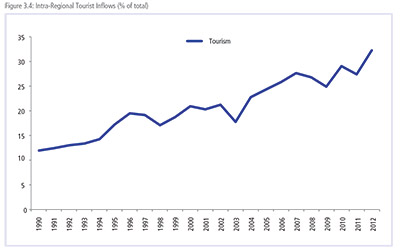
Figure 3.4 shows intra-regional tourist flows: these have recovered to their highest level since 1990. From 2007 to 2009, the number of intra-regional tourist flows had been decreasing and it decreased again in 2011. However, for other years since 2003, intra-regional tourist flows had been grown substantially by around 15 percent to more than 32 percent in 2012, the highest level recorded in our index. According to the data, most ASEAN members and Japan hosted a largest increment of intra-regional tourists.
CONVERGENCE INDEX
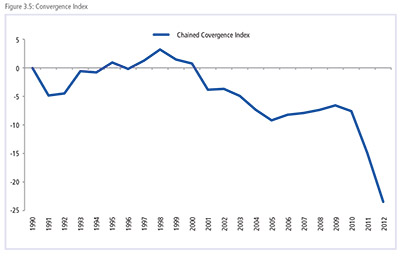
The sub-index of convergence shows that economies in the region have continued their trend towards divergence. GDP per capita levels in the region had been converging somewhat during the crisis years. However, in 2010, divergence in incomes began once again and continued into 2012. It should be noted here that GDP per capita accounts for just 19 percent of the weight of this subindex while education expenditure accounts for 50 percent of the weight. Shifts towards convergence in education, even minor ones would more than outweigh much larger shifts in income.
DIVERGING INCOMES
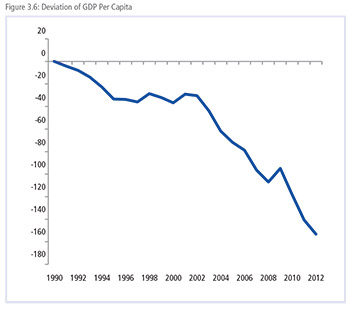
Figure 3.6 shows the divergence in GDP per capita among regional economies. Since 1990, with the exception of a few years, including the period covering the Global Economic Crisis, GDP average incomes have been diverging rather than converging as might be expected. Over the whole index period the divergence in incomes has been driven by differences in growth rates. In 1990 the average GDP per capita was US$9,027, this has increased to US$26,500 by 2012 or a growth rate of around 5 percent. However, the absolute deviation from the average has also increased from US$7,600 to US$19,300. Hence, income levels in some economies have grown at a much higher rate than the average in the region while others under the average.
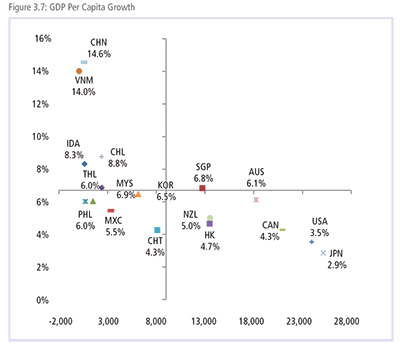
Figure 3.7 shows the GDP per capita of regional economies in 1990 and the average annual growth rate over the period (measured by current US dollars). Economies to the left of the vertical axis started at GDP per capita levels below the regional average, economies below the horizontal axis have been growing at a slower rate than the regional average of 6.7 percent. For incomes to converge, economies with lower incomes per capita need to grow at a significantly higher differential to those with higher incomes for a sustained period.
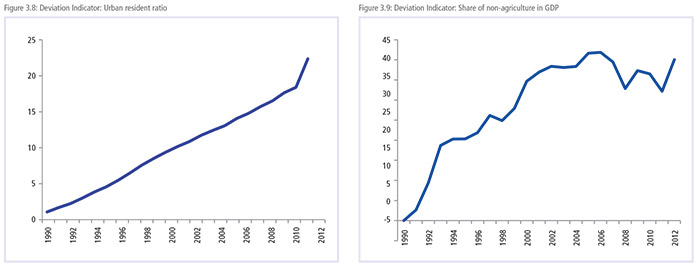
The pace of urbanization in the region has been steady throughout the period as represented by the percentage of population living in urban areas. In 1990, the urban resident ratio was 65 percent with a standard deviation of 22. By 2012, the urban resident ration had increased to 74 percent with a standard deviation of 17, meaning that all economies are increasing and they are converging at a similar rate. As seen in Figure 3.8, this has been a very linear trend with few interruptions to the process unlike the share of non-agriculture in GDP, which has been much more volatile, and diverging since 2009.
As shown in Figure 3.8, the indicator of urban resident share is still steadily converging over time thanks to the ambitious urbanization process in developing economies such as China and Southeast Asia. Regardless of the last two years of divergence, the share of nonagriculture in GDP increased both on average and its convergence: in 1990 the average share of non-agriculture in GDP was 89 percent with a standard deviation of 8.2; over the following 22 years, the share of non-agriculture steadily increased in the region and currently accounts for more than 96 percent of total output with a standard deviation of 4.9.
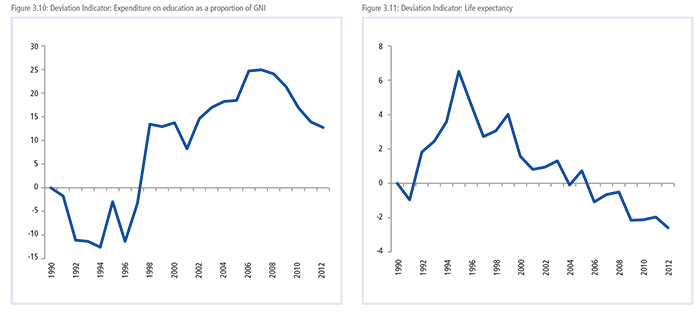
While the proportion of expenditure on education in the region has significantly risen by 2010 compared to 1990, Figure 3.10 shows that its level of convergence has declined since 2008. In 1990, the average expenditure on education as a percentage of gross national income was 3.6 percent; the latest data shows that average expenditure was around 4.4 percent of GDP.
In 1990, the average life expectancy in the region was 72.4 years; by 2012, it had increased by five years to 78.1, with a standard deviation of 3.6. As seen in Figure 3.11, between 1990 and 1995, life expectancies had been converging. However, the level of convergence began to decrease thereafter. The latest update to the index shows that the level of convergence in life expectancy in the region is even below the level in 1990. This means life expectancy is increasing faster in certain economies than others.
When APEC Leaders set out the Bogor Goals in 1994, they set out a vision through which the region would not only maintain high growth rates but also narrow development gaps. While the region has done well in integrating and overall incomes have increased at a dramatic pace, the index shows that there is a long way to go in terms of closing development gaps. Integration is not an end in itself but a means to ensuring that all citizens can achieve their potential.