Chapter 4 - Index of Regional Economic Integration*
*Contributed by Chen Bo, Assistant Professor, Shanghai University of Finance and Economics, Shanghai, China.
The process of economic integration of the Asia-Pacific region has resumed since the slowdown brought about by the global economic crisis according to the latest update to the PECC index of regional economic integration. The index measures the degree of integration taking place in the Asia-Pacific region based on intra-regional flows of: goods; investment; and tourists and five measures of convergence: GDP per capita; share of non-agriculture to GDP; the urban resident ratio; life expectancy; and share of education expenditure in GNI.

The index was developed in 2008 as a tool to measure the degree of integration taking place in the Asia-Pacific. Regional economic integration has become a core objective of the Asia Pacific Economic Cooperation (APEC) forum. The process of economic integration is commonly defined as the freer movement of goods, services, labor, and capital across borders.
The degree of economic integration can be analyzed at bilateral, regional, and global levels. Even though the Asia-Pacific region is not covered by a single trading agreement, there is much anecdotal evidence to suggest that it is becoming more integrated. As defined by APEC membership, the region consists of not only developed economies such as the US, Japan, Canada, and Australia, but also emerging markets such as the ASEAN. It is well known that parts of the region are already highly integrated through production networks that trade intermediate and finished goods across borders. Since 1998, many economies in the region have negotiated bilateral and sub-regional Free Trade Agreements with partners in the region as well as outside the region. APEC leaders have also endorsed a proposal to investigate the idea of a Free Trade Agreement of the Asia-Pacific (FTAAP), which if successful, would constitute the largest regional trading bloc in the world.
An important feature of the index is that it excludes trade and investment flows among geographically contiguous sub-regional trading partners, namely NAFTA, the ASEAN Free Trade Area, and Australia-New Zealand Closer Economic Relations. It also excludes flows among China, Hong Kong (China), and Chinese Taipei. This is to control for the effect that sub-regional flows may have on the index, whereby a very high degree of integration among, for example, NAFTA economies could result in a falsely high measure of integration with the Asia-Pacific region as a whole.
Furthermore, since the trade, investment, and tourism measures are calculated relative to global transactions, the index will rise for a given economy only if that economy’s share of trade/investment is growing relative to total trade and investment.
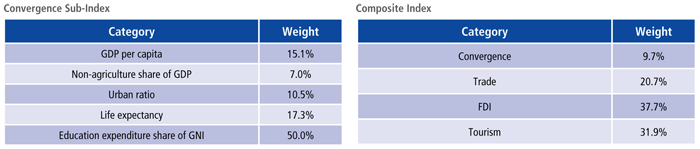
The weights assigned in the index to each dimension are determined through statistical methodology to avoid subjective judgments on the relative importance of any factor in the integration process. This index uses principal component analysis which assumes that there is some structure behind the variation of the indicators.
The deviation indicators are grouped together since they may be highly inter-correlated macroeconomic variables. The indicators selected are based on the assumption that they would be expected to narrow over time as economies integrate with each other. The absolute deviation of real GDP per capita measures dispersion of overall welfare of the sample economies, that of the nonagriculture sectoral share measures the dispersion of industrialization levels, that of the urban residents ratio measures the dispersion of modernization levels (since most industrial and business activities occur in urban areas), that of the life expectancy approximates the dispersion of inputs in health, and the education expenses approximates the dispersion of investment in human capital (which is believed to be a key factor accounting for long run economic growth).
The second part of the index is commonly used indicators that measure flows of goods (trade), capital (FDI), and people (tourists) in the region.
Weights Used
The convergence measures are premised on the notion that integration will lead to greater uniformity among the economies. Accordingly, more trade and investment among regional partners may not translate into a higher score on the integration index if at the same time the partners are diverging in terms of income, education, life expectancy, urbanization, and economic structure.
Caution should be exercised in the interpretation of these findings. The measures chosen for inclusion in the composite index are imperfect indicators of “convergence” and trade/investment integration. The rankings in turn should not be read normatively as “league tables” in the sense that a higher ranking is superior to a lower ranking. A low ranking may simply indicate that an economy is more oriented globally than regionally, as is likely the case for China and the United States.
Nevertheless, the change in index value for a given economy over time can be read as a measure of its changing economic orientation. The index value for the region as a whole can also be seen as a measure of closer economic ties among Asia Pacific economies and as one indicator of APEC’s success.
The 2013 update to the index is based on data from 2010. Missing data were approximated using standard interpolation and extrapolation techniques.
The index has reached its highest level over the twenty year period. This sharp increase in the index comes mainly as a result of improved intra-regional flows of trade, tourists and investment. The 2013 update to index shows all regional economies increasing their level of integration with the rest of the Asia-Pacific region.
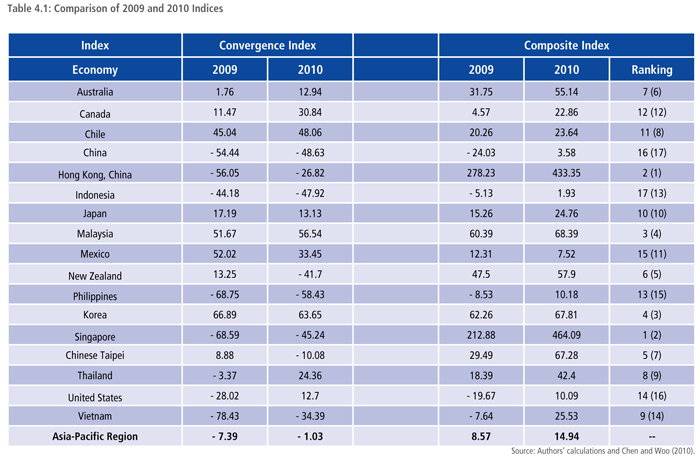
The latest update to the index shows that all Asia-Pacific economies, except Mexico are more integrated or dependent on Asia Pacific markets. Noticeably, Singapore and Hong Kong are still the most integrated economies with the AP markets, their levels of integration increased to 464 and 433 from 213 and 278 in their previous update. As the freest business harbors, Hong Kong and Singapore benefit the most from economic recovery in trade, investment, and tourists.
The index shows that two largest economies in this region, namely the United States and China, although still near bottom in the ranking, are nevertheless more integrated with the other regional markets since both of their integration indices turn from negative to positive and their relative rankings also improved. The main reason is that after the outbreak of the debt crisis in Europe and the rapid economic recovery in the Asia-Pacific, both the United States and China have seen increased flows with other Asia-Pacific economies.
Asia-Pacific Trade Flows
Chart 4.2 shows the share of Asia-Pacific intra-regional imports and exports to regional GDP. After various economic stimulus plans, regional economies showed some recovery in terms of intra-regional trade flows. Over the twenty year period intra-regional flows of exports and imports (over GDP) have increased from 11 percent to 13.4 percent. It should be emphasized here that this index discounts flows among sub-regions: the economies of Southeast Asia, North America, and China, Chinese Taipei, and Hong Kong (China).

The share of Asia-Pacific intra-regional merchandise trade recovered from the big hit in 2009 to pre-crisis levels of above 13 percent. The recovery was largely led by regional trade in both China and the United States who contributed above 6 percent each to the increase in total merchandise trade. With the exception of Thailand, all Asia-Pacific economies showed increase in the Asia-Pacific share of their total trade.
Foreign Direct Investment

Compared to flows of goods, intra-regional flows of investment show a much more erratic pattern. After the large decrease in FDI flows in 2008, they grew by over 200 percent year on year between 2008 and 2009, and another 29 percent from 2009 to 2010. The biggest increases were for Singapore, the United States, and China, where FDI flows grew by above 6 percent year on year.
Tourism Flows

Another positive signal of recovery can be shown by the intra-regional tourism statistics. Chart 4.4 indicates that the intra-regional tourist share (to total annual international tourists hosted by each of the sample economies) stopped its declining trend seen since 2007 and exhibited a strong increase from 2009.
The total number of tourists coming into the Asia-Pacific region has been steadily increasing by roughly 1 percent a year, while the number of those traveling within the region has increased by about 5.6 percent a year. From 2007 to 2009, the number of intraregional tourist flows had been decreasing. However, in 2010, intra-regional tourist flows rebounded to close to 30 percent, the highest level recorded in our index.
The market with the highest number percentage of regional tourist inflows is China, which in 2010 received 22 percent of the region’s share, followed by Korea, Japan, and the US, each receiving around 10 percent of the regional tourist inflows.
Convergence Index
The sub-index of convergence shows that economies in the region have resumed their trend towards divergence. GDP per capita levels in the region had been converging somewhat during the crisis years. However, in 2010, the divergence in incomes began again. It should be noted here that GDP per capita accounts for just 15 percent of the weight of this sub-index while education expenditure accounts for 50 percent of the weight. Shifts towards convergence in education, even minor ones would more than outweigh much larger shifts in income.

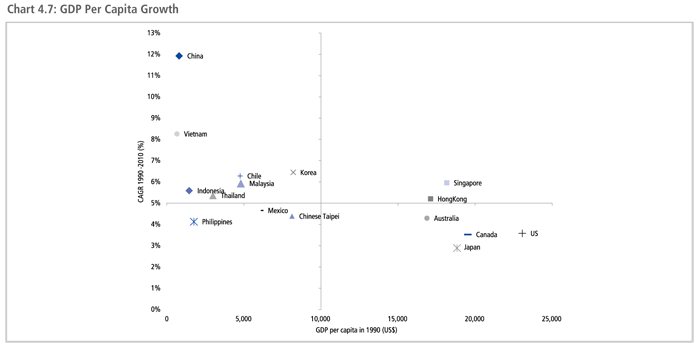
Diverging Incomes
Chart 4.6 shows that the convergence indicator of real GDP per capita decreased in 2010 which reveals that the gap in real income among sample economies has resumed its diverging trend. This finding suggests that the higher-income economies (ie US, Japan), which suffered more from the recent global economic crisis than the lower-income (ie the Southeast Asian economies), are now recovering.


In 1990, the average life expectancy in the region was 72.4 years. By 2010 it had increased by 5 years to 77.5, with a standard deviation of 3.8. As seen in Chart 4.11, between 1990 and 1995, life expectancies had been converging. However, after 1995, the level of convergence began to decrease until in 2004, when there was a divergence. The latest update to the index shows that the level of convergence in life expectancy in the region is at the same level as in 1990.
When APEC leaders set out the Bogor Goals in 1994, they set out a vision through which the region would not only maintain high growth rates but also narrow development gaps. While the region has done well in integrating and overall incomes have increased at a dramatic pace, the index shows that there is a long way to go in terms of closing development gaps. Integration is not an end in itself but as means to ensuring that all citizens can achieve their potential.