Chapter 1 - Regional Economic Outlook*
*Contributed by Eduardo Pedrosa, Secretary General of PECC and Coordinator of the State of the Region report.
The author would like to thank Wu Zhenglong (CNCPEC) and Charles E. Morrison (USAPC) for their comments.
The global economy continues to grow at a moderate pace in spite of the uncertainties about economic prospects in a number of large emerging and developed economies. Growth is expected to come in at about 3.1 percent this year before accelerating up to 3.8 percent in 2014, according to IMF forecasts. The Asia-Pacific region which accounts for more than half of total global output is expected to continue to act as an anchor for the global recovery and grow at 3.5 percent this year and 3.9 percent in 2014.
While there are signs that the global recovery is becoming sustainable and less reliant on continued stimulus, much more needs to be done to ensure that future growth is balanced and sustainable. Indeed, as last year, there are considerable downsized risks in the forecast and considerable uncertainty about new growth drivers. For the Asia-Pacific region containing the three largest single economies in the world, a more robust and sustainable recovery will depend on a series of economic and political changes that will require a significantly enhanced level of political leadership.
First, at the regional level, current significant freer trade efforts, including RCEP and TPP, need to move forward aggressively. If finalized, approved, and implemented, these agreements, and their eventual merger into an FTAAP, can be a growth driver for years to come. If deadlines continue to be missed, or if these agreements are so watered down that they do not meet the needs of the 21st century economy, the business communities will lose interest and the economic momentum of more efficient resource and capital use will be lost. Estimates suggest that the completion of these agreements could add as much US$2 trillion to global economic output by 2025.
Second, many of the individual economies need to undertake serious structural reforms to update growth models that are no longer reliable or which have faltered years ago. Japan’s government is committed to a new growth strategy involving fiscal and monetary stimulus and structural reform, but the test of this will come largely in the area of structural reform and the responses or not of the business community. China is in the course of reigning in credit and unproductive investment, but whether it can change its economic model to push up the level of consumer spending remains to be seen. The United States needs to unwind its monetary stimulus program credibly in line with its delicately balanced recovery, and build a consensus on its economic direction. Third, innovation remains a potential key driver of the region and global economy. This requires a serious objective analysis of the policy regime that can best unleash this potential. It also requires economies to adopt macroeconomic policies that enable resilience and facilitate change when innovation comes. This further underscores the need for economies to implement the structural reforms as part of their new growth strategies.

While the main concern is over the prospects for growth in the European Union, there are significant concerns developing in the region - growth in the US remains fragile, a harder than expected landing for the Chinese economy, India’s growth rate is sharply lower, and it remains unclear whether Japan will finally be able to end its long deflationary cycle. Some emerging economies in the Asia-Pacific region, including Indonesia, are facing major adjustments.
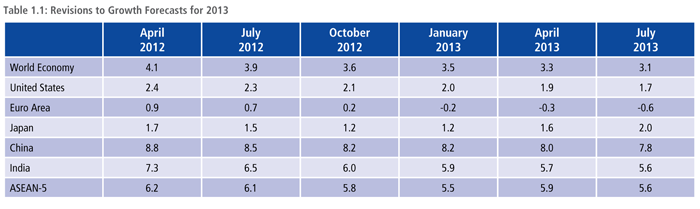
While the IMF forecast is for a recovery to pre-crisis growth levels of above 4 percent in 2014, such forecasts have proved optimistic in the past. As recently as April 2012, global growth for 2013 had been forecast to be 4.1 percent. These downgrades for global growth accompanied worsened expectations for almost all major economies with the exception of Japan, which, partly due to the extraordinary measures taken to reflate the Japanese economy this year and improved export prospects, is now forecast to grow at about 2.0 percent (see Table 1.1).
Unlike in the first phase of the post-crisis period, emerging market currencies are now depreciating against the US dollar, reflecting the unwinding of US quantitative easing and expectations of a narrowing of interest rate differentials. The critical question in emerging markets is whether depreciations will lead to higher interest rates and threaten already fragile growth prospects. The economies running large current account deficits, such as Indonesia and India, are of greatest concern. Currency depreciation should improve exports but will also raise prices of imports.
For the global recovery to be truly robust and sustainable, governments need to implement policy initiatives to remove the uncertainty holding back private sector investment in both productive capacity and employment.
The Asia-Pacific Outlook
The IMF forecasts the Asia-Pacific region to grow at 3.5 percent this year and 3.9 percent in 2014. Emerging markets continue to drive growth in the region accounting for 2.6 and 2.7 percentage points of the region’s growth in 2013 and 2014 respectively. More recent forecasts for growth in 2013 and 2014 for almost all Asia-Pacific economies are lower compared to those made in 2012 with the notable exception of Japan.
United States
In spite of the sequester cutbacks in government expenditure t, the US continues to recover from the economic crisis with growth forecast at 1.7 percent and 2.7 percent in 2013 and 2014 respectively. Increases in private consumption and investment are both expected to drive growth contributing 1.0 percentage point and 0.9 percentage points to overall economic growth.
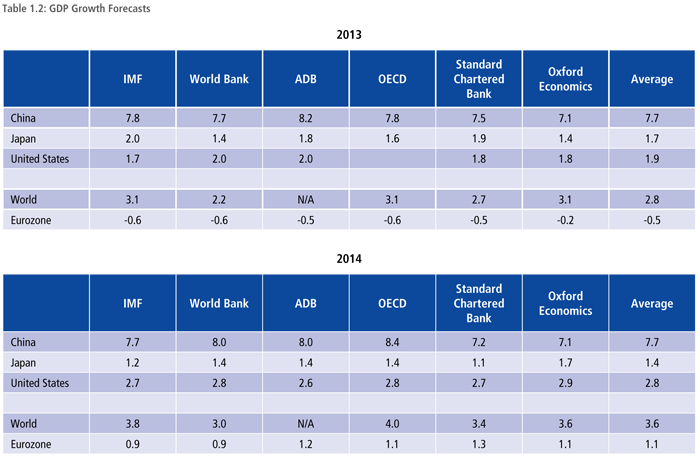
There are some differences in views from various institutions on the US economy ranging from 1.7 to 2.0 percent growth in 2013 and 2.6 to 2.9 percent for 2014. The forecasts cited in Table 1.2 above were made at different times with more recent numbers tending to be on lower side. Although not large differences they reveal a certain amount of uncertainty about the extent to which the recovery in private consumption and investment is taking place.
There are at least two critical questions: one involving economic policy and the other political leadership. The biggest economic question is when and how the US will ease back on its buying of US$85 billion of assets a month. The Federal Reserve has indicated that it will keep monetary policy loose until unemployment levels reach a target of 6.5 percent and inflation projections are no more than half a percentage point above 2 percent. Now at 7.4 percent, the OECD forecasts unemployment in the US to be 7.0 percent while Oxford Economics and the IMF at 7.5 percent in 2014. With the unemployment rate declining by an average of 0.1 percentage points a month much depends over what happens over the next two to three quarters.
Washington politics also cloud any forecast. The sequester has become an increasing drag on economic expansion, and budget hawks are anxious to force further reductions, even at the cost of closing government. While some compromise is almost inevitable, an unstable budgetary and fiscal outlook will increase uncertainty and could significantly lower growth.
China
Growth in the region’s second biggest economy is forecast to remain at the same rate as 2012 at 7.8 percent this year and 7.7 percent in 2014 before accelerating back up to 8.5 percent in 2015. While still impressive growth – the fastest in the region except for Mongolia - it is below the average of the past three decades. In recent years but especially since the Global Economic Crisis, China’s growth has been driven by investment, reaching an astounding 45 percent of total GDP. The challenge over the near term will be weaning the economy off investment at a time when demand in traditional export markets such as the United States and especially Europe is unlikely to be as strong. Boosting private consumption would be one way to keep the economy growing at the pace it has been, but China will need to take far more aggressive steps to achieve this. In recent years consumption has been growing only at around 3 percent a year – well below the growth of whole economy. Thus, as China’s leaders recognize, in order to achieve growth with greater inclusiveness, important shifts are needed in China’s growth model.
Over the medium and longer-term, China’s growth rate will trend downward. China is currently in a “sweet spot” demographically, with an average age of about 35 and the lowest dependency ratio in its history. But in future years, larger and larger numbers of older workers will retire, and they will not be fully replaced by new workers. This should increase average incomes, but will also sharply increase the share of dependents in the aging workforce.
There are large differences in forecasts for the Chinese economy with the most pessimistic at 7.1 percent to 8.2 percent growth in 2013 and 7.1 percent to 8.4 percent in 2014, a variation of about $90 billion, more than the combined GDPs of Cambodia, Laos and Myanmar. The large variations in estimates reveal the amount of uncertainty that currently prevails on the Chinese economy. This should not come as a surprise as the government is in the midst of policy adjustments to rein in credit growth.
China’s Economy1
1 Contributed by CNCPEC.
China has sustained stable and fast economic development over the past three decades since reform and opening up, leading to a marked improvement of the comprehensive domestic strength. However, difficulties, problems and risks are looming large on the way forward. First, the problems of imbalance, inconsistency and unsustainability are still outstanding; secondly, major structural problems are impeding further development; thirdly, factors that lead to instability and uncertainty of the world economy are increasing. China is at the crucial period of further reform and opening up. At the 18th National Congress of CPC held in last October, a new development strategy was adopted; ie to deepen economic structural reform across the board, implement innovation-driven development, carry out strategic adjustment of the economic structure, integrate urban and rural development, and improve open economy in an all-round way.
I. China’s Economic Performance in the First Half of 2013
According to the National Statistics Bureau of China, China’s GDP grew by 7.6 percent year-on-year in the first half of the year, with 7.5 percent in the second quarter, indicating a slowing growth. However, the major economic indicators of the first half of the year were in the reasonable range of the expectations for the year. The prices were stable with the CPI going up by 2.4 percent and supply of key commodities remaining adequate.
To implement the abovementioned strategy steadily, the government has put forward the policies of “stabilizing growth, adjusting economic structure and promoting reform.”
Despite the slowing growth rate of the first half of the year, the increase of both urban employment and rural migrant workers kept the urban unemployment at a low level. The bumper summer harvest is projected to be followed by another one in the autumn. The quality of the economy also improved with the accelerated increase of added value in both the tertiary industry and the hi-tech industry. Domestic consumption became a strong driver of the economic growth. Of the 7.6 percentage points of growth, 3.4 points were driven by the final consumption while 4.1 points came from the gross capital formation, with only 0.1 point contributed by net export of goods and services.
Positive progress has been achieved in the reform process. Institutional reform and functional transition were made in an orderly way with 183 items subject to administrative approvals either eliminated or discharged to nongovernmental agencies. ‘Business tax’ was changed to ’value-added tax.’ With measures to make liquidity more accessible to the real economy and the deregulation of loaning interest rate, the financial market is developing at a fast speed. Breakthroughs were also made in the reform of resource goods pricing and the railway system.
II. Challenges Faced by China’s Economy
Externally, the world economy is undergoing deep adjustment and faces great uncertainty, while China is experiencing fiercer competition for the international market and more trade protectionism in various forms. Internally, while some deep-rooted problems accumulated in the long course of development are yet to be solved in a fundamental way, new challenges have emerged, mainly including the weakening economic growth, the overcapacity of production, increased business difficulties for the enterprises, hard and costly financing for the SMEs, as well as fiscal and financial risks, etc.
III. China’s Economic Policy and Measures
To tackle the challenges in the latter half of the year and in the future, China will maintain steady growth, adjust economic structure and forge ahead with reform. Great efforts will be made to improve the quality and efficiency of economic development, maintain the continuity, stability and consistency of the macroeconomic policies, and carry on proactive fiscal policies and prudent monetary policies in order to inject more dynamism to and create greater room for economic development while keeping the economy running in the reasonable range.
First, China will take a comprehensive package of measures to upgrade the internal demand. China will make full use of public consumption and national investment to back-up the economic growth.
Secondly, China will strengthen policy support and services to revitalize enterprises, especially the SMEs, and substantially boost the development of the real economy.
Thirdly, China will optimize the spending structure and make better use of the fiscal funds. It is unlikely to initiate large-scale stimulus plans. However, investment will be used to accelerate the development of the information, energy conservation, environmental protection, new-energy industries, railway and other transportation, shanty quarters transformation and the rural power grids.
Fourthly, China will keep liquidity at a suitably adequate level by revitalizing the stock and optimizing the increment so as to control risks and promote development. More efforts will be made to reform the financial sector to serve the real economy better.
Fifthly, China will promote urbanization. For this purpose, a series of reforms in household registration, land titles, tax and finance, and social security network will be introduced in a coordinated way to ensure the quality of urbanization and sustainable development of the new cities.
Sixthly, China will stabilize foreign trade, broaden exports and raise imports, while encouraging qualified entrepreneurs to invest overseas.
Japan
The latest IMF forecast for Japan is GDP growth of 2.0 percent in 2013 and 1.2 percent in 2014. Japan is the only major Asia-Pacific economy which received an upgrade in the IMF’s latest forecast. While 2 percent growth this year is an improvement, the forecast of 1.2 percent growth in 2014 and similar rates in subsequent years are of concern. They suggest that the forecasters recognize the challenges of removing years of deflationary expectations and of implementing the structural reforms that are part of the “third arrow” in Prime Minister Abe’s quiver. A few other factors weigh on the forecast, such as the impact of the proposed increase in the sales tax and as well as potential decreases in public investment once the current stimulus has ended.
There are also some significant differences in forecasts for Japan, ranging from 1.4 to 2.0 percent growth this year and 1.1 to 1.7 percent in 2014. Some variations in the forecasts can be accounted for by the time at which they were made, while others due to differences in views on how the business community responds to the policy stimuli. Large Japanese companies have huge retained earnings, and the higher estimates of growth rate will be achieved only if they begin to invest these in infrastructure or higher employee wages.
Abenomics May Revive Japanese Economy 2
2Contributed by JANCPEC.
Japan has experienced about two decades of a stagnant economy since its economic bubble burst in the early 1990s. Japanese Prime Minister Shinzo Abe started introducing a series of economic policies right after the December 2012 election that gave him a second opportunity to lead. Abe’s economic recovery policies – popularly known as “Abenomics” – consist of three approaches often symbolized as “three arrows”. The Abe administration first focused on ceasing the declining trend in domestic prices that had lasted throughout the economic downturn. The first arrow was therefore to pressure the Bank of Japan to launch more aggressive monetary easing and to set up an inflation target of two percent. The Bank of Japan has in fact pumped unprecedentedly vast quantities of money into the economy under the bank’s new governor, Haruhiko Kuroda. The second arrow was government spending worth 10.3 trillion yen. These first and second arrows are macroeconomic stimulus policies implemented at the initiative of the monetary authorities and government. In June 2013, the third arrow, multiple sets of structural reforms, was fired by Prime Minister Abe. The third arrow represents the most important economic policies for the Japanese economy as they are designed directly to boost economic competitiveness and to achieve solid long-term economic growth. These structural reforms include the relaxation or elimination of government restrictions as well as anticompetitive and onerous laws and regulations that enhances the vigor and efficiency of private-sector economic performance, the establishment of strategic special economic zones in which companies can enjoy preferential treatment in terms of tax and regulation, the expansion of investment in the energy sector, the augmentation of agricultural product and food exports, and the enhancement of the competitiveness of domestic universities.
Abenomics has been functioning well to date, though it is still just getting underway, and there remain many economic reforms to be planned and steadily implemented. At the end of July 2013, just six months since the launching of Abenomics, the Nikkei Stock Average reached 13,668 yen, a level 31 percent higher than at the end of December 2012. The accommodating monetary policies effectively worked to rectify the overvaluation of the yen, and exporting industries were able to boost their profits. Expectations of inflation as well as of improvements in the corporate sector’s performance encouraged investors at home and abroad to take long positions, boosting overall stock prices. There are also good signs of economic recovery in active investment and consumption. According to a report released in June by the Cabinet Office, January-March real GDP growth was revised upward from the previous 0.9 percent to 1.0 percent, an annualized rate of 4.1 percent. The IMF and ADB also upgraded their economic forecasts of Japan’s GDP growth rate in July. Due to the effects of the stimulus policies under the Abe administration, the IMF increased the annual rate for 2013 by 0.5 percent from the previous April forecast of 1.5 percent. The ADB raised the rate of GDP growth forecast for 2013 by 60 basis points from 1.2 to 1.8 percent. There are indications that the deflationary trend has been shrinking and the effects of Abenomics have been permeating into households. Most recent surveys showed that this summer’s bonuses were higher than those of the previous year. The July 2013 election again gave the Liberal Democratic Party (LDP) an outstanding victory, and the ruling parties gained a majority in the House of Councilors. It became much easier for the ruling parties now holding a majority in both Houses to pass bills into law in the Diet. The Abe administration received a strong mandate to continue Abenomics more boldly and swiftly. It is too early to evaluate the overall effects of Abenomics, but it has great potential to pull the Japanese economy out of two decades of mild recession.
Southeast Asia
Southeast Asia continues to show remarkable resilience in the face of slower grow in China and the United States. The region is forecast to grow at 5.5 percent in 2013 and 5.6 percent in 2014.
Southeast Asia’s aggregate current account surplus has been narrowing from above 6 percent of the region’s GDP to around 2 percent. Much of this has been due to its largest economy, Indonesia, slipping into a current account deficit since 2012. Recent volatility caused by expectations of a reduction of QE in the US is having unintended consequences in many emerging markets, especially those that have been recipients of cheap capital in recent years. Policy responses to this volatility may act as a brake on growth further highlighting the need for raising productivity through policy reforms.
Indonesia, which accounts for 38 percent of output in ASEAN, and host to this year’s APEC meeting, is forecast to grow at 6.4 percent over this year and next. Growth is being held up by robust domestic demand, evenly split between consumption and investment. Private gross capital formation accounts for above 30 percent of GDP and private consumption another 55 percent. A more competitive export sector would boost growth as would higher levels of public investment.
Like Indonesia, the Philippines has benefitted from resilient domestic demand. However, in the Philippine case consumption is driving growth with a much lower contribution from private investment. The Philippine economy is forecast to grow at 6.0 percent this year and then slow to 5.5 percent in 2014 as a result of slower growth in private consumption. With recent credit upgrades and renewed confidence in the economy, private investment should begin to play a bigger role in driving growth.
Thailand’s relatively strong economic performance following the flooding two years ago is also due to resilient domestic demand with growth in private consumption accounting for 3.8 percentage points of its overall 5.9 percent growth this year. Growth is forecast to moderate in 2014 to 4.5 percent due to slower performance in both private consumption and investment.
Malaysia is forecast to growth at 5.1 and 5.2 percent in 2013 and 2014 respectively with strong growth in private consumption. However, the drivers of growth are expected to change between this year and the next with slower investment but higher public consumption in 2014. Singapore is forecast to grow at 2.0 percent in 2013 but recover strongly to 5.1 percent in 2014 with a rebound in exports and investment growth.
ASEAN Economic Community – A Work in Progress3
3 Contributed by Sanchita Basu Das, Fellow and Lead Researcher-Economics, ASEAN Studies Centre; Coordinator, Singapore APEC Study Centre, Institute of Southeast Asian Studies (ISEAS).
There are now less than two years left till the deadline for the achievement of an ASEAN Economic Community (AEC). The ambitious plan to create a ‘single market and production base’ would effectively create a market of more than 600 million people and US$2 trillion in production. The region has maintained a resilient growth rate of around 5 per cent for the last few years and its total trade crossed US$2.3 trillion mark.
The AEC, if achieved, has the potential to put Southeast Asia on a higher growth trajectory, so critical at this time when many of ASEAN’s traditional export markets are suffering from economic malaise. Petri, Plummer and Zhai (2010) estimate that the full implementation of the AEC would raise ASEAN real incomes by US$69.4 billion, or 5.3 percent over the 2004 baseline income. All ASEAN members stand to gain from the AEC. The manufacturing sector, especially highly tradable products ones like electrical equipment, machinery, metals in the region will particularly benefit, with additional increase in the services due to their linkages with the manufacturing.
However, there are questions on the nature of the economic community that the region will deliver. In April 2013, while the Leaders declared that 77.5 percent of the AEC Blueprint has been implemented, one should keep in mind that this figure, known as the AEC Scorecard, is a compliance tool; it neither measures the impact of the policy nor does it verify whether the members are aligning their domestic laws to the regional initiatives.
Despite its simplicity, the scorecard does signify ASEAN’s progress towards an economic community by 2015. The region is on its way to deliver a free trade area ‘plus’ (FTA+) arrangement, where there is likely to be free trade in goods with additional provisions for services, investment, skilled labor and infrastructure.
The region has maintained a resilient growth rate of around 5 percent for the last few years and its total trade crossed US$2.3 trillion mark. The success in trade is mainly linked to the emerging Production Networks (PNs) in the region; ie slicing of production processes into geographically separated stages. These PNs have been driven by both market forces (advances in technology and ICT) and institutional factors, like deregulation in trade and investment policies or trade facilitation measures that reduce the cost of cross-border business activities.
However, for now, ASEAN faces several challenges; there are non-tariff barriers (NTBs) such as custom surcharges, internal taxes, administrative price fixing, single channel of imports, requirement of product characteristics, and labeling. In the meantime, the ASEAN Single Window is also challenged by regulatory incoherence and inefficiency.
Other policies that could positively affect the way business is conducted in the region are: the ASEAN Framework Agreement on Services (helps in skilled labor movement and facilitates business services), the ASEAN Comprehensive Investment Agreement (helps in business expansion and reduces cost of capital) and financial integration in ASEAN (ease in movement of capital). The effectiveness of these instruments and their implementation will depend on how much political capital regional leaders are willing to spend on them.
In 2010, ASEAN Leaders endorsed the Master Plan of ASEAN Connectivity (MPAC), which prioritized 15 key cross-border ‘hard’ and ‘soft’ infrastructure projects over the next few years. The Asian Development Bank (ADB) estimates that ASEAN members will require infrastructure investment of US$596 billion during 2006-2015. Given this, ASEAN offers huge investment opportunities, especially as members are looking increasingly to public-private-partnerships (PPP) in infrastructure. Lastly, ASEAN follows a policy of open regionalism and hence, AEC seeks to accelerate the region’s integration into global markets. The region has seen the realization of the ASEAN-China and ASEAN-Korea FTA, commencement of ASEAN-Australia- New Zealand FTA and ASEAN-India and ASEAN-Japan trade in goods agreement. These are going to have notable impacts on the region.
While a lot of progress is being made, ASEAN instruments tend to emphasize flexibilities, which, while politically necessary, reduce the effectiveness of the agreements. For example, the AEC envisages free movement of skilled labor through Mutual Recognition Arrangements (MRAs) and although ASEAN has signed seven MRAs, only engineering and architectural services provide standardized recognition of skills.
There is a need to see the regional integration as an ongoing process for which the ASEAN Leaders are laying down the initial foundations by 2015. The rest of the process of ASEAN economic integration will continue much beyond 2015.
Pacific South America
South American economies in the Asia-Pacific are also displaying resilience, expecting growth on average by 4.9 percent in 2013 and 2014. Peru is expected to lead at 6.3 and 6.1 percent over the same period. By comparison, the forecast for the whole of Latin America and the Caribbean is for only 3.0 and 3.4 percent over the same period. Brazil, while gaining much attention as part of the BRICS group, is expected to grow at 2.5 and 3.2 percent over this year and next, which is well below the rates of other major emerging market economies that are part of the Asia-Pacific region.
Pacific Alliance – Deep integration, deep expectations5
5Contributed by Fidel Duque, Director General, COLPECC with the assistance of Esteban Restrepo, Advisor, COLPECC and Ministry of Foreign Affairs, Colombia. The authors would like to thank the Secretary pro tempore of the Pacific Alliance. In particular, Nicolas Campo (Ministry of Foreign Affairs), Maria Alejandra Benitez (Ministry of Trade Industry and Tourism), and the Bureau of Asia, Africa and Oceania, Ministry of Foreign Affairs of Colombia. Special thanks to Martin Salazar, intern at the Bureau for his support in the preparation of graphics and tables.
Since June 2012, when the framework agreement for the Pacific Alliance (PA) was signed, the interest and expectations for the economic integration of Chile, Colombia, Mexico, and Peru have increased dramatically. Today the PA has more observers than members. Panama and Costa Rica have recently expressed their intention to become members. Other observers include economies such as Canada, the United States, Guatemala, Honduras, El Salvador, Dominican Republic, Ecuador, Paraguay, Uruguay, China, Republic of Korea, Australia, Japan, and New Zealand.
In particular, the PA has been identified as one of the potential trade blocs in Latin America; the attention has focused not only on the prospects of its economic features, but also on the uncertainties about the recent pace and future prospects for other integration arrangements in the region.
The Pacific Alliance aims to constitute a platform to diversify exports, create jobs, encourage economic growth and competiveness, and thus, a greater social and economic welfare, including other related issues like migration. It is an inclusive mechanism that does not intend to be a counterweight to other regional integration mechanisms or blocs. No doubt, part of the attraction to the PA is found in the political and economic strengths of its members. They share solid democratic institutions, dynamic, globalized markets and positive investment conditions. According to the World Bank's Doing Business 2012 report, of the 32 economies in the Latin American and Caribbean region, the current members of the Alliance hold first, third, fourth and fifth place, respectively, in the ease of doing business ranking.
As a group, the total population of the PA is 210 million, amounting for almost 35 percent of the population of Latin America and the Caribbean (LAC). In 2012, GDP growth in the PA was 5 percent, 1.9 points above the LAC average and 2.8 points above the average global growth (2.2 percent). The GDP per capita in the PA was almost US$13,000. The average unemployment rate in the PA was 7.6 percent. The average inflation in the PA was 3.2 percent, below the regional average of 6 percent. ECLAC’s projections for 2013 indicate that PA members will sustain an average economic growth rate of 4.7 percent, compared to the LAC average of 3.8 percent.
PA members account for 33 percent of total LAC trade, with exports of US$369,231 million and imports of US$352,310 million. FDI into Latin America and the Caribbean in 2012 totaled US$122,486 million, of which 26 percent were located in the PA. Twenty-nine percent of services exported from LAC originate from the PA (US$38,737 million) and 30 percent of imported services are destined for the PA (US$61,747 million).
As of 2012, trade among PA members reached nearly US$535 billion8, Mexico being the main exporter with a share of 65.3 percent. Total PA exports to the APEC region reached US$434 billion, nearly 67 percent of the combined exports of the PA members9. Total imports reached US$314 billion10, mainly from the US and China. With the exception of Mexico, PA economies experienced substantial increases in the levels of FDI, in comparison to 2011: Chile 32.2 percent, Colombia 10.9 percent, and Peru 49 percent.
So far the Pacific Alliance has achieved agreement on tourism cooperation and e-commerce, reduction on visa restrictions to ease migration between members, a platform for education, coordination between export promotion agencies and the establishment of a business council, but the focus is on the results of the current negotiations on: market access for the trade of goods, rules of origin, sanitary and phytosanitary measures, technical barriers to trade, trade facilitation and customs cooperation, services (including financial services, shipping, telecommunications, air services and professional services), investment and government procurement.
Today, the most important challenge ahead for the PA is to achieve concrete results out of these negotiations, to position itself into the regional architecture of Asia-Pacific and Latin America. There is a need to strengthen its integration process and to maintain its momentum by adopting an overall external relations strategy that goes beyond the bilateral agendas, which will help build bridges with other regional and transpacific institutional initiatives.
Northeast Asia
As a subgroup, Northeast Asia is dominated by the world’s second and third largest economies, China and Japan, which account for close to 80 percent of its economic weight. Mongolia has been growing at a tremendous rate since 2011 and is forecast to hit 14 percent this year and moderate to 11.6 percent in 2014. Much of this growth comes from investment, especially in the mining sector. Should the current slowdown in demand for minerals continue, there are considerable risks for Mongolia. The outwardoriented economies of Hong Kong (China), Korea and Chinese Taipei are all expected to have slightly better growth this year compared to 2013 and then accelerate in 2014 as the global economy recovers.
Oceania
The Oceania subregion, defined here as Australia, New Zealand and Papua New Guinea, is forecast to grow at 3.0 percent in 2013 and improve to 3.3 percent in 2014. Australia alone accounts for 90 percent of the economic weight of the subregion. There is considerable debate within Australia about its economic future as Chinese demand for its mineral resources has slackened. New Zealand is forecast to grow at 2.7 percent in 2013 and 2.6 percent in 2014, while resource-rich Papua New Guinea is forecast to grow at 4.4 percent in 2013 and accelerate to 5.6 percent next year.
Transpacific Imbalances
Transpacific current account imbalances which reached their peak in 2006-2007, remain largely in check. As shown in Chart 1.2, the North American current account deficit hit a peak at US$789 billion or 5 percent of GDP in 2006. Since then it has come down to below US$600 billion, just under 3 percent of GDP. In the case of the United States the current account deficit is forecast to begin edging up into the ‘risky’ territory of above 3 percent of GDP in 2014 but still well below the 6 percent rate in 2006.

A 2009 PECC taskforce established to consider regional responses to the economic crisis noted that before the crisis, unsustainable borrowing supported high US consumption, while unprecedented savings – including more than half of China’s GDP income – went into investments in export industries and dollar assets. These internal imbalances in expenditures led to large international imbalances in terms of trade and capital flows between the United States and China, Japan and other economies. Since 2009, the US current account deficit has declined to under 3 percent of GDP, a level widely considered sustainable. The IMF notes that global current account divergences have narrowed to 2 percent of global GDP compared to 6 percent in 2006, with the US, China and Japan all having reductions. However, the OECD estimates that as much as 40 percent of the decline in global current account imbalances is explained by divergences in business and housing market cycles. If a housing market boom occurs, there is a risk that imbalances will re-emerge.
This places more emphasis on the need for economies in the region to undertake structural reforms to rebalance their economies to avoid a re-emergence of the imbalances seen by the regional economy in the lead up to the crisis.
Trade Flows

Export growth for the region in 2013 is forecast to improve slightly to 4.5 percent over last year’s tepid 3.2 percent, with acceleration in 2014 to 6.9 percent. Imports are expected to follow a similar pattern, growing at 5.1 percent this year and improving to 7.0 percent in 2014. Even though the forecast for export and import growth are an improvement over the drops seen during the crisis years, they are well below the performance seen during the boom years of the 1990s when export growth averaged around 7.7 percent a year.
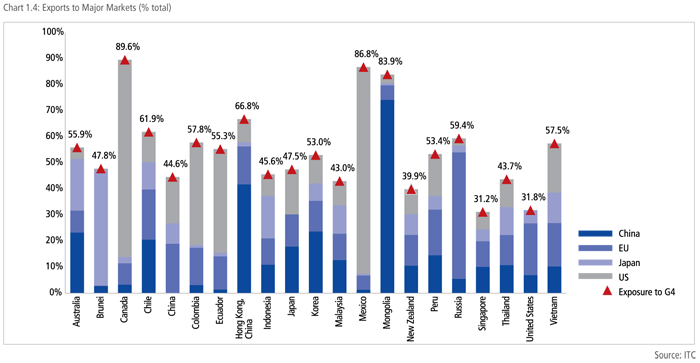
Some economies are highly dependent on trade with particular markets; for example, Hong Kong (China) and Mongolia sell 42 and 74 percent of their exports to China respectively, while about half of Russia’s exports are bound for the EU. The United States is the key market for most of the exports from other economies in the Americas, accounting for 76 percent of all of Canada’s exports, and 87 percent of Mexico’s.
For Southeast Asian economies, risks are most spread out with the G4 major markets of China, EU, Japan and the US accounting for a much lower percentage of their total exports. However, given ASEAN integration into global supply chains, much of their trade in components still leaves the region exposed to trade downturns as final demand for products continues to be in these major markets. Given the forecast for much lower growth in exports over the coming period, it is critical for surplus emerging economies of the economies for the region to find alternative engines of growth and increase domestic demand if they are to sustain the high levels of growth exhibited over the past few decades, as suggested by Petri et al. in the PECC 2009 taskforce report, ‘Inclusive, Balanced and Sustained Growth.’


The conventional wisdom has been that the monetary easing in developed economies would lead to capital inflows and exchange rate appreciation for emerging markets. Over the past year, most regional currencies have weakened against the US dollar over the period reflecting capital flows back to advanced economies. The notable exceptions were China, Korea, Chinese Taipei and Thailand. However, the biggest mover over the period has been the Japanese Yen which has depreciated against the US dollar by 27 percent.
Over a longer horizon the picture of exchange rate movements is quite different. Taking the week of the collapse of the Lehmann Brothers as the base date, the biggest regional mover has been Russia whose currency has depreciated by 27 percent against the US dollar, while the Japanese Yen has appreciated by 6 percent judged over this period. The IMF notes that there is little evidence to suggest the depreciation of the Yen over the last year has had any negative trade impacts except in specific sectors. They argue that this reflects supply chain effects with economies that import components from Japan benefitting from lower export prices.
Capital Flows
As noted in last year’s report, the quantitative easing in developed economies would have mixed impacts for emerging markets. The accommodative monetary policy stances were adopted to restore confidence in financial markets which in turn would drive global trade and investment flows. However, there were strong concerns that it was fuelling high capital inflows, currency appreciation and catalyze asset bubbles. On the flip side, without these extraordinary measures the potential for financial market disorder would have been high, as the IMF’s Multilateral Policy Issues report notes: “the mere talk of tapering off QE by the US Federal Reserve officials pushed bond yields up worldwide and created significant volatility in equity markets.”

The World Bank expects private capital flows to developing economies are expected to rebound this year and continue to increase into 2014 and 2015. Equity inflows which account for 70 percent of private capital inflows are expected to grow by 18 percent this year and another 12.5 percent in 2014. Capital going to emerging markets accounting for 70 percent of total inflows.
The World Bank also suggests that “bond flows are projected to decline in 2013 because many borrowers have taken advantage of the current low-interest environment to pre-finance future borrowing, and because with reduced deleveraging pressures – some borrowers will return to more traditional bank-financing.” The volatility in exchange rates and equity markets reflects the uncertainty about when quantitative easing in the Recent volatility in emerging economy currencies and capital markets largely in response to expectations about the slowing of quantitative easing highlight difficulties in international policy coordination.
Rebalancing Aggregate Demand
In 2009, a PECC taskforce used a simple simulation to estimate the magnitude of changes to the pattern of aggregate demand to avoid the excess imbalances in the region. The basic assumption was that a US current account deficit of 3 percent of GDP was sustainable. A few key points emerged from the study: a number of surplus economies in East Asia could sustain their growth rates in the face of declining external demand by increasing either consumption or investment, while the US needed to decrease the percentage share of private consumption and increase exports.

Prior to the crisis, some economies were characterized as being unbalanced. For example, surplus economies this meant lower percentages of private consumption and for deficit economies excess consumption. Chart 1.7 above shows estimates of the changes to the share of various components of aggregate demand in regional economies from their levels in 2007. The rebalanced growth scenario by the PECC taskforce suggested the imbalances that characterized the region were not that large in percentage terms of the Asia-Pacific economy and that relatively small adjustments to the pattern of aggregate demand would prevent a re-emergence of those imbalances in the future.
As a general assessment, a number of East Asian economies that had large surpluses in the period before the Global Economic Crisis have ramped up domestic demand – either through higher consumption or investment. The largest adjustments to the pattern of demand in the region have been a decrease in the relative importance of net exports.
However, the region’s two largest economies, China and the United States, are still facing a number of challenges that make an assessment at this stage early. As part of the stimulus measures in response to the crisis, investment in China has risen from the already high baseline in 2007 of around 40 percent to 45 percent of GDP. Without this stimulus it is probable that growth would have been much slower in recent years, the challenge now is weaning the economy off this reliance on investment and finding alternative engines of growth. Conversely, investment as a percentage of US GDP has come down and aggregate demand supported by rising private and public consumption. However, on a positive note, US exports have improved considerably over the period with the shale gas phenomenon likely to further improve net exports over time.
Investment
While there have been increases in investment as a share of GDP, there remains an enormous challenge to meet the infrastructure requirements to avoid bottlenecks to growth and meet developmental goals.

Before the Asian Financial Crisis of 1997-98, investment as a percentage of GDP in the ASEAN region was relatively high at above 30 percent. From 1999 onwards, investment levels were between 20 and 25 percent of GDP. In recent years investment levels have been moving gradually upwards to move above the 30 percent of GDP level, the rate of investment exhibited by the newly industrializing economies during their high growth periods. Sustaining this level of investment will be critical to sustaining aggregate demand as well as avoiding infrastructure bottlenecks. Given constrained public finances there is an urgent need to get private sector investment moving. The ADB has estimated that during 2010-2020, developing Asia needs to invest around US$8 trillion in infrastructure while the OECD estimates that globally US$53 trillion of investment is need, with US$11 trillion alone for ports, airports and key rail routes.
Based on the experience of the last 20 years, serious policy reforms will be required if private sector investment is to fund investment in infrastructure. From 1990-2011, private investment commitments in infrastructure amounted to US$953 billion in the developing Asia-Pacific economies.
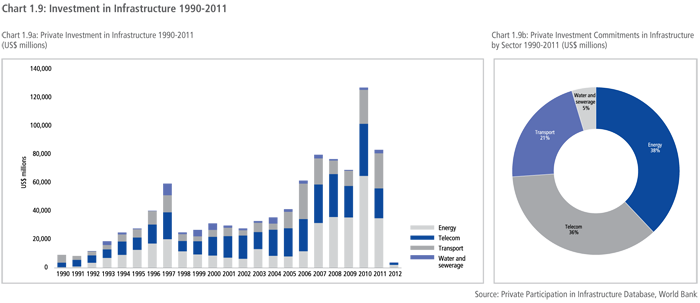
Despite the upward albeit uneven trend in the private investments, there are great variations among regional economies. In terms of the total amount of investment, India takes the lead in having received $273 billion of private investment from 1990 to 2011. Trailing are Russia (US$121 billion), China (US$116 billion) and Mexico (US$109 billion). However, in terms of percentage of GDP, smaller economies like Laos and Cambodia do better.
The investment breaks down to 38 percent in energy (US$361 billion), 36 percent in telecommunication (US$342 billion), 21 percent in transport (US$204 billion) and 5 percent in water and sewerage (US$44 billion).
The scale of the infrastructure challenge ahead is enormous; for example, per capita electricity consumption in the Asia-Pacific region is currently at around 5,000 kwh and has been increasing by about 1.3 percent a year. To reach the OECD level of over 8,000 kwh, it would take some 43 years. In terms of access to water, currently 84 percent of the population in the Asia-Pacific has access to water; to reach the OECD level it would take some 25 years at current growth rates.
It is not all bad news though in terms of providing citizens with access to basic necessities. Just 10 years ago a bare fraction of the population had a mobile phone. Today, the lowest penetration rate in the region is 50 percent of the population with the overall regional gap to the OECD average likely to be closed within the next couple of years.
Barriers to Improved Infrastructure
Meeting the region’s infrastructure needs will require substantial engagement of the private sector in both delivery of the services as well as funding. While private sector investment in infrastructure has been increasing, judging by the participation of the private sector in infrastructure over the past 20 years, policy reforms are needed. Public-private partnerships in infrastructure have been touted almost as panacea to the dilemma. However, PPP readiness assessments emphasize a need for a conducive macroeconomic environment (strong growth), the presence of sophisticated financial systems, and strong and clear legal and regulatory environment.
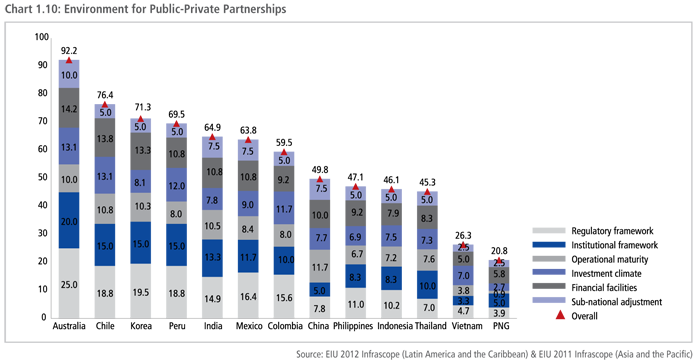
The types of policy reforms required to encourage private sector participation in infrastructure projects are indicated in various publicprivate partnership readiness assessments. The Infrascope studies conducted for the ADB and the IADB use major dimensions: regulatory framework, institutional framework, operational maturity, investment climate, financial facilities, and a sub-national adjustment.
While a number of regional economies - notably Peru, India, Mexico, and Colombia - are ranked relatively highly, others such as China, Indonesia, and the Philippines less well. With reference to Charts 1.9 and 1.10 on private sector investment in infrastructure, there is a strong correlation between performance in these readiness assessments and actual private sector participation in infrastructure.
Structural Reforms Critical for Meeting Infrastructure Needs
The need for improved regulatory, legal and institutional frameworks further emphasizes the need for regional economies to focus on structural reforms. The region has done well in removing at-the-border barriers to trade but behind-the-border barriers impede both trade and domestic growth. In 2004, APEC adopted an agenda to promote structural reforms which included five priority areas for reform: regulatory reform, competition policy, public sector governance, corporate governance, and strengthening economic and legal infrastructure. In 2011, APEC adopted a new strategy, which expanded work on structural reforms to include: more open, well-functioning, transparent and competitive markets; better functioning and effectively regulated financial markets; labor market opportunities, training and education; sustained SME development and enhanced opportunities for women and for vulnerable populations; and effective, fiscally sustainable social safety net programs.
A study conducted by the APEC Policy Support Unit estimates the benefits of structural reforms in the telecommunications, transport, and energy sectors to be around US$175 billion a year in additional real income (in 2004 US dollars). The same study notes that the introduction of competition into markets has real tangible benefits for consumers. For example, the entry of low-cost carriers can lower airfares by 20-30 percent. Reforms in the electricity sector covering third-party access regime; a whole electricity market; and an unbunding of generation from transmission would lead to electricity prices that are 23 percent lower.
Future Growth Prospects
While there is no doubt that the Asia-Pacific has become the core of the global economy through rapid growth over the past few decades, there is no guarantee that as the global economy enters into a ‘new normal’ that growth will continue along the same trajectory. While the region and particularly East Asia has followed Akamatsu’s ‘flying geese’ pattern of development - at first led by Japan, then the newly industrializing economies such as Korea, Singapore, and Chinese Taipei and now China - the future trajectory remains unclear. Japan’s own poor economic performance over the past decades stands as a testament to the need for continuous policy innovation to foster growth.
As seen in Chart 1.11, net exports are still expected to contribute to growth, especially as the advanced economies like the US, EU and Japan develop growth momentum. However, it is unlikely that exports, especially goods trade will drive growth to the extent that it did in the 1990s.

While risks remain, there are chances that 2014 and 2015 will see a synchronized recovery from the US, EU and Japan which will in turn have more positive impacts for the region, especially export-oriented economies. Gains from the further dismantling of border barriers are likely to be small except for still highly protected, specific sectors such as agriculture. The inability of governments thus far to reach an agreement on the Doha Round increases the risk that gains from liberalization might be rolled back. “Plan Bs” in the form of large-scale regional agreements like the TPP, RCEP and TTIP all have the potential to put global growth back on a higher trajectory. A global plurilateral agreement on services would similarly do so. Indeed, many of the gains from structural reforms are specific to services sectors which remain closed, poorly regulated and uncontested.
A further risk to economic growth is increasing economic inequality both among and within regional economies. Addressing these inequalities is a major part of the new growth strategy adopted by APEC in 2010 – and are part of the efforts to formulate post- 2015 Millennium Development Goals. Development goals such as access to education, finance, healthcare, water, electricity and so on are all services where behind-the-border barriers prevent more efficient and wider delivery. Addressing these development goals could provide a much needed boost to growth.