Chapter 4 - INDEX OF REGIONAL ECONOMIC INTEGRATION*
*Chen Bo is Assistant Professor at the Shanghai University of Finance and Economics.
The previous chapters discussed a variety of regional economic integration initiatives being pursued in the Asia- Pacific region. PECC’s index was developed to measure the extent of economic integration in the Asia- Pacific region. The composite index is based on a combination of measures that on the one hand look at the extent to which the reference economies are becoming more alike in their economic characteristics (“convergence” measures) and on the other hand at the relative importance of trade, investment and human flows within the region compared to flows with the rest of the world.
The convergence measures are premised on the notion that integration will lead to greater uniformity among the economies. Accordingly, more trade and investment among regional partners may not translate into a higher score on the integration index if at the same time the partners are diverging in terms of income, education, life expectancy, urbanization, and economic structure.
Furthermore, since the trade, investment, and tourism measures are calculated relative to global transactions, the index will rise for a given economy only if that economy’s share of trade/investment is growing relative to total trade and investment. The index was first unveiled in 2008, using data up to 2005, and it has since been updated to include 2009 data.
An important feature of the index is that it excludes trade and investment flows among geographically contiguous sub-regional trading partners, namely NAFTA, the ASEAN Free Trade Area, and Australia-New Zealand Closer Economic Relations. It also excludes flows between China, Hong Kong (China), and Chinese Taipei. This is to control for the effect that sub-regional flows may have on the index, whereby a very high degree of integration among, for example, NAFTA economies could result in a falsely high measure of integration with the Asia Pacific region as a whole.
Caution should be exercised in the interpretation of these findings. The measures chosen for inclusion in the composite index are imperfect indicators of “convergence” and trade/investment integration. The rankings in turn should not be read normatively as “league tables” in the sense that a higher ranking is superior to a lower ranking. Indeed, a low ranking may simply indicate that an economy is more oriented globally than regionally, as is likely the case for China and the United States.
Nevertheless, the change in index value for a given economy over time can be read as a measure of its changing economic orientation. The index value for the region as a whole can also be seen as a measure of closer economic ties among Asia Pacific economies and as one indicator of APEC’s success. These data are collected from 17 regional economies starting from 1990 and ending at 2009. Missing data were approximated using standard interpolation and extrapolation techniques.
Economic Slowdown Takes Toll on Regional Integration
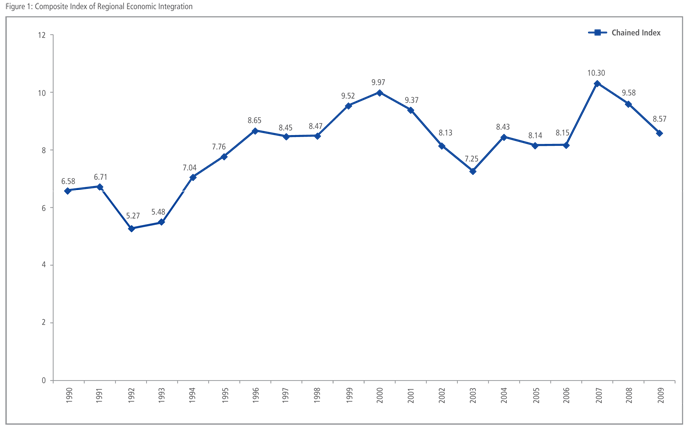
The overall pattern of integration since 1990 remains broadly positive albeit fairly erratic over the last 20 years. The global economic slowdown continues to impact regional economic integration with the composite index of economic integration slowing a decline over the past three years. The overall decline in the index comes from reductions in intra-regional trade in merchandise goods, investment flows, and tourism.
Figure 2 shows the index results for the 17  regional economies based on the latest available data. Small open economies of Hong Kong (China) and Singapore have been the top two most integrated economies of the region since we began the index. The regional trend where the convergence index is a negative factor is generally replicated at the level of the economies, with the exception of Chile, Korea, Malaysia, and Chinese Taipei. Large regional tourist flows (relative to global tourist flows) account for much of the top two economies greater levels of integration compared to other economies.
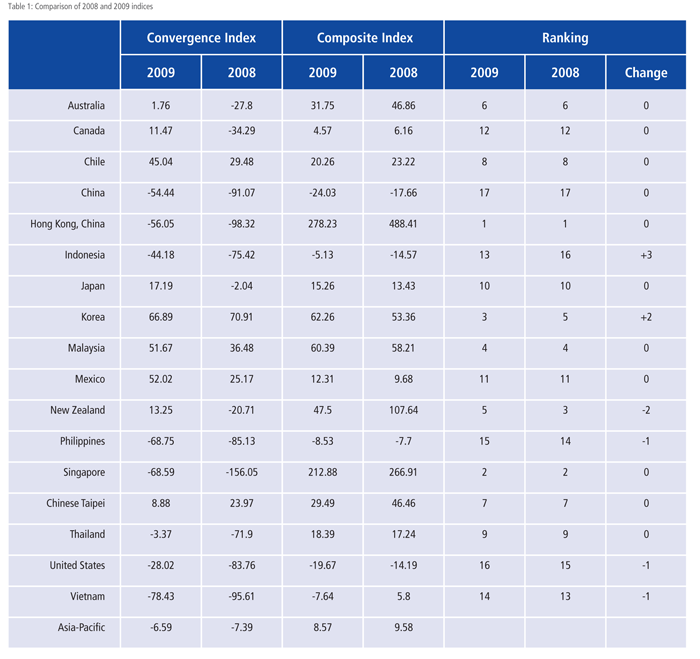
Between 2008 and 2009 six out the seventeen regional economies showed an increase in their integration with the rest of the region: Indonesia; Japan; Korea; Malaysia; Mexico; and Thailand. Hong Kong, China and Singapore were still the most integrated economies with the Asia-Pacific region, their integration indices (278.23 and 212.88, respectively), compared to theirs in 2008 (488.41 and 266.91, respectively), substantially declined. As the freest economies they have suffered the most from less flows in trade, capital, and tourists (See Table 1).
Most economies kept their relative integration ranking in 2009 compared to the 2008 ranking. However, the two largest economies in this region, namely the United States and China, were the bottom two in the ranking. The reasons are threefold. First, these two largest economies are more diversified in their international business. For instance, both economies have deep economic connections with Europe. Second, both of them have very important economic relations with their immediate neighbors, the United States with Canada and Mexico, and China with Hong Kong (China) and Chinese Taipei. Third, since both are so large, they, especially the United States, rely relatively more on their domestic economies than other regional economies.
Intra-Regional Flows Impacted by Crisis
As is well known, international trade was much more  volatile during crisis and hence we find the trade share dropped to its 2007 level. Figure 3 shows the share of Asia-Pacific intra-regional imports and exports (to regional GDP).
Figure 4 shows that the intra-regional FDI share (to regional  Gross Capital Formation) had dipped dramatically in 2008, and the 2009 level was even slightly lower than 2008, which indicates that the investors in 2009 were still quite conservative about the prospect of economic performance. Compared to trade, FDI responded earlier to the economic crisis as it is pro-cyclical.
Figure 5 indicates that the intra-regional tourist share (to  total annual international tourists hosted by each of the sample economies) continued its declining trend since 2007. In sum, all the three flow indicators in Figures 3 to 5 imply that the world economic crisis has dampened the regional economic integration trend in the Asia-Pacific.
The Convergence Index
The five measures included in the convergence index are shown in Figure 8. Except for Chinese Taipei and Korea, all the other 15 economies experienced convergence to the regional average. As a result, Figure 8 shows that the regional divergence had continued to decline since 2005, though at a modest rate.
Income Inequality in the Region
This year’s PECC survey shows growing income inequality as a major risk to growth for regional economies (See chapter 2). Over the years that PECC has been issuing the index of integration, the biggest single factor accounting for ‘dis-integration’ has been a growing gap in incomes across the region. As shown in Figure 8, for the past 20 years, incomes, as represented by GDP per capita, have been diverging while other factors have either been constant or converging. In 1990, the average GDP per capita in the region was US$9,836; by 2009 it had increased to US$22,974 (shown in Figures 6 and 7). However, in 1990 the average absolute deviation among regional economies GDP per capita was US$ 6,910, by 2009, this had increased to US$14,423. Also the most recent economic crisis, on average, hit the more developed economies more than it did the emerging economies.

The deviation indicator of non-agriculture share shows that Asia-Pacific economies’ industrialization (as measured by the deviation indicator of non-agriculture share), though somewhat reversed during 2006 to 2008, was resumed in 2009. The indicator of urban resident share is still steadily converging over time thanks to the ambitious urbanization process in developing economies such as China and Southeast Asian economies. The overall divergence trend of regional economies’ life expectancy was still preserved in 2009. Data shows that the life expectancy differs more between the developed and emerging economies even though all the sample economies report longer life expectancy. Finally, the education indicator implies that the share of education expenses across the region have been converging over time.

Methodology
The index assigns weights to the variables using statistical methodology. 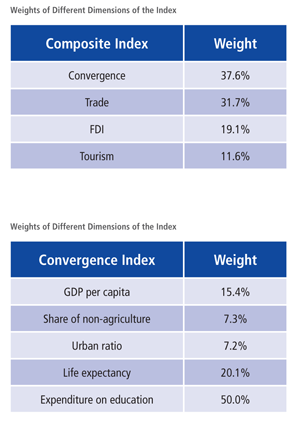 Rather than assign weights based on the perceived importance of the different dimensions of integration, the index uses variations within the data to determine the weights.
An important feature of this index is that it excludes trade and investment flows among geographically contiguous sub-regions:
- North America
- Southeast Asia
- Australia and New Zealand
- China, Hong Kong (China), and Chinese Taipei
This is to control for the effect that sub-regional flows may have on the index whereby a very high degree of integration within a sub-regional could lead to a false high measure of integration within the whole Asia-Pacific.
The weightings for each dimension of the index are derived using principal component analysis – they are determined by the variation among the indicators themselves. What this means is that while the indices’ weights change over time, they are more objective being derived from the data rather than any preconceived notions of which factors are more important.