Chapter 3 - Regional Economic Integration
The Asia-Pacific region consists of diverse economies ranging from very small to the world’s biggest three, from island states to continental economies. The region is also very diverse in terms of economic development, with a very wide range in GDP per capita. Despite these differences, members of APEC share in common the desire for closer economic integration and a commitment to regional cooperation.
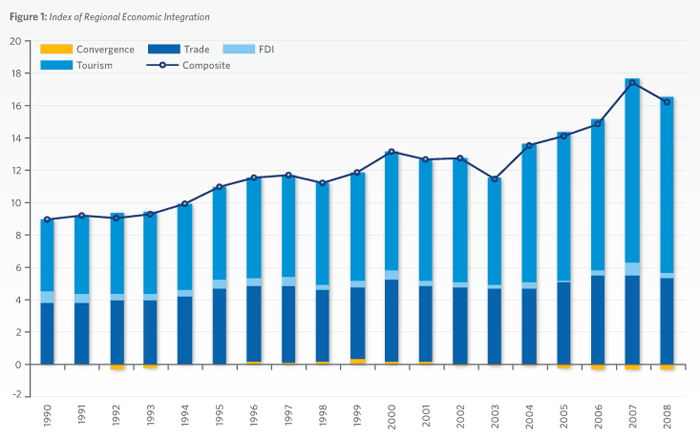
The process of economic integration is commonly characterized by the liberal movement of goods, services, labor, and capital across borders. Since 2008, PECC has been tracking regional economic integration through a unique index that was developed specifically for this task. The index tracks regional flows in goods; people and investment as well as how much the region is converging in terms of key economic indicators: GDP per capita; non-agriculture share of GDP, the urban resident ratio, life expectancy and education expenditure to GDP.
As data availability is limited, the index is updated on a lagged basis. The latest version presented in this report uses data from 2008. Data was collected from 17 economies in the Asia-Pacific region, as follows: Australia; Canada; Chile; China; Hong Kong (China); Indonesia; Japan; Korea; Malaysia; Mexico; New Zealand; Philippines; Singapore; Chinese Taipei; Thailand; United States and Vietnam.
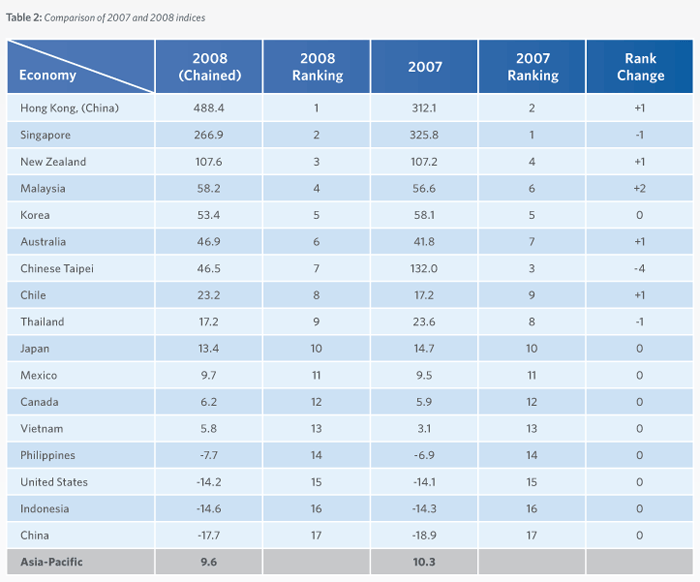
This latest update to the index shows a fall in all components of the index between 2007 and 2008, and hence in the overall composite index as well. The fall in the index is the first in five years, and reflects the decline in intra-regional trade, investment, and people flows during the global recession that started in 2008, as well as the widening disparity in “development” indicators. While the reversal in regional economic integration may be due to special factors related to the recession, the “two-speed” recovery that has since taken place could set in motion a longer-term trend away from deeper regional integration.
While the decline in intra-regional trade and investment is very recent, and possibly temporary, there has been a longer-term decline in the “convergence” measure, which is a key component of the overall composite index. In previous years, the decline in the convergence measure has been more than compensated by increases in intra-regional trade and investment, resulting in a rise in the overall index. The convergence measure includes differences in per capital GDP, which have been widening for the entire period that the index has been calculated.
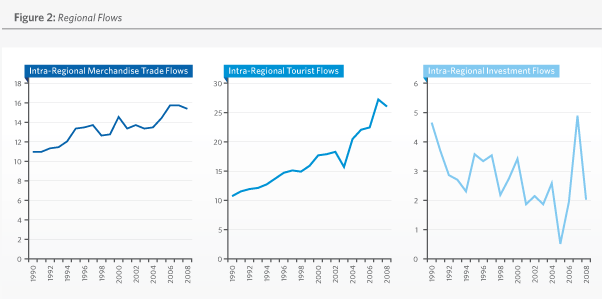
Figure 2 below shows the share of intra-regional imports and exports (to regional GDP), intra-regional FDI share (to regional gross capital formation), and the intra-regional tourist share (to total annual international tourists hosted by each of the sample economies). As illustrated in Figure 2: the trade share decreased in 2008, though slightly; the FDI share in 2008 dropped to its 2006 levels; and the tourist share also stopped its increase. In sum, though intra-regional trade and tourism shares only decreased a little in 2008, the intra-regional FDI share, a pro-cyclical indicator, dipped significantly as a result of the economic downturn.
An important feature of this index is that it excludes trade and investment flows among geographically contiguous sub-regions:
- North America
- Southeast Asia
- Australia and New Zealand
- China, Hong Kong (China), and Chinese Taipei
This is to control for the effect that sub-regional flows may have on the index whereby a very high degree of integration within a sub-regional could lead to a false high measure of integration within the whole Asia-Pacific. As discussed in Chapter 1, some product flows within the Asia-Pacific are concentrated within a particular sub-region.
- Merchandise Trade Flows - Merchandise trade flows (exports and imports) account for 35 percent of the weight of the index. From 2007 to 2008 intraregional merchandise trade flows decreased slightly from 15.8 percent to 15.5 percent.
- Tourist Flows - The index measures the intra-regional tourist share as a proportion of worldwide tourists of the receiving economy. The number of intra-regional tourists tripled between 1990 and 2008 rising from 22 million to over 65 million.
- FDI Flows - The index’s measure of FDI integration takes an economy’s FDI flows from the rest of the region as a proportion of nominal GDP over the economy’s gross capital formation. Intraregional flows of FDI fell sharply between 2007 and 2008 from US$329 billion to US$155 billion.
 Convergence Criteria
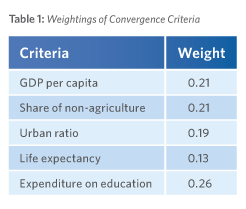
In addition to intra-regional flows, the index also includes convergence criteria. These are macroeconomic indicators of development. The index measures absolute deviation among the regional economies in each of the five dimensions and aggregates them into a ‘convergence index’ on a weighted basis.
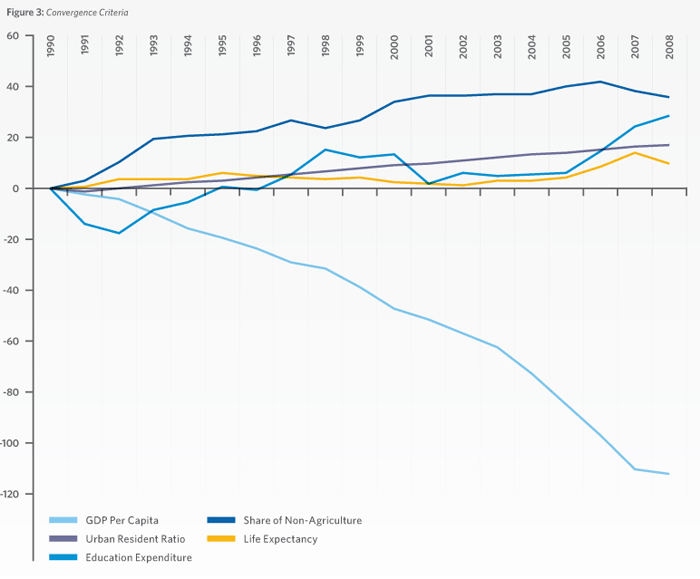
The measures of convergence have been normalized to zero for the base year - 1990 - a positive result implies the absolute deviation of that year is smaller than that of the base year, i.e. there has been convergence compared to 1990; a negative number implies the opposite – greater divergence. As in previous versions of the index, there has been steady convergence across four of the five dimensions: share of non-agriculture; the urban resident ratio; life expectancy and expenditure on education. However, over the period GDP per capita has been diverging..
I. GDP PER CAPITA
Between 1990 and 2008, average incomes as measured by GDP per capita in the region increased from US$9,785 to US$23,338. The index measures divergence of each individual economy’s GDP per capita from the regional average. A value of zero for an individual economy within the index implies that the economy’s GDP per capita is exactly that of the regional average (US$23,338).
On an aggregate basis, negative values indicate that income differences are increasing compared to their level in 1990 and positive values indicate that differences are narrowing.
Over the sample period, the divergence of incomes within the region has been growing, even though the latest figures comparing 2007 with 2008 suggest some moderation in the rate at which incomes are diverging. The long-term widening of per capital incomes in the region is a source of concern and could emerge as a serious constraint on deepening integration in the years to come.
II. DEVELOPMENT : SHARE OF NON-AGRICULTURE SECTOR
Another component of the convergence index is the share of the non-agriculture sector (manufacturing and services) in the economy. The regional average has been steadily increasing over the sample period, from 89 to 94 percent. Differences in the share of nonagriculture are much smaller than those of the other indicators used in the index.
III. URBAN RESIDENT RATIO
A similar measure of convergence to the share of the non-agricultural sector in GDP is the urban resident ratio. The regional average of urban residents to total population in 1990 was 63 percent; this has increased to over 70 per cent by 2008. The index shows that the divergence among Asia-Pacific economies has been steadily decreasing over time.
IV. LIFE EXPECTANCY
As with the other convergence measures, life expectancy in the region has also been increasing; from an average of 72 years in 1990 to 77 years in 2008. As with the degree of urbanization and share of non-agriculture GDP the divergence within the region is relatively small; the spread is just 13 years between the economy with the highest life expectancy and the economy with the lowest.
V. EDUCATION EXPENDITURE
The last deviation measure is public expenditure on education as a percentage of GDP. Over the period the regional average has increased from 3.6 to 3.9 percent. The deviation between regional economies’ expenditure on education has been decreasing over time.
Methodology
The index assigns weights to the variables using statistical methodology. Rather than assign weights based on the perceived importance of the different dimensions of integration, the index uses variations within the data to determine the weights. An important feature of this index is that it excludes trade and investment flows among geographically contiguous sub-regions:
• North America
• Southeast Asia
• Australia and New Zealand
• China, Hong Kong (China), and Chinese Taipei
This is to control for the effect that sub-regional flows may have on the index whereby a very high degree of integration within a sub-regional could lead to a false high measure of integration within the whole Asia-Pacific. As discussed in Chapter 1, some product flows within the Asia-Pacific are concentrated within a particular sub-region.
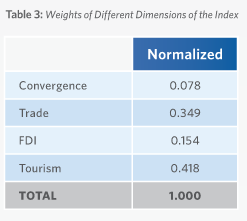
The weights assigned to each dimension of the index are derived from the data itself. Flows of tourists within the region are 42 percent of the index; merchandise trade is 35 percent; investment flows are 15 percent; and the convergence sub-index is 8 percent.
The weightings for each dimension of the index are derived using principal component analysis – they are determined by the variation among the indicators themselves. What this means is that while the indexes weights change over time, they are more objective being derived from the data rather than the analysts pre-conceived notions of which factors are more important.