Economic Outlook Data Tables
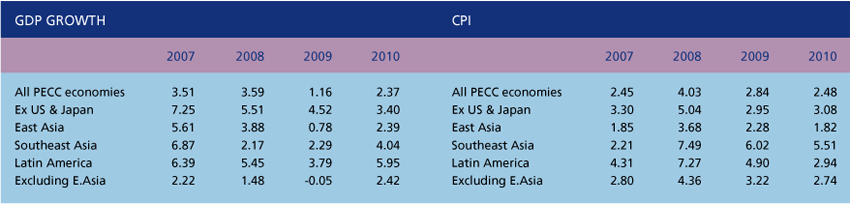
T1: Real economic growth and increase in consumer prices for PECC economies, 2007-2010 (%)
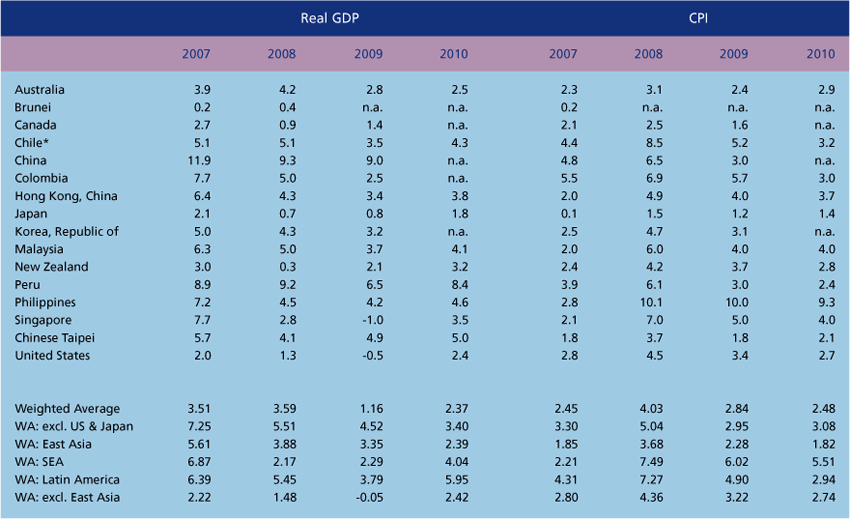
*Statistics from provided by UniversidD de Chile complements the update from the Central Bank of Chile.
Note: National currency based. The weighted average is based on the respective economies’ 2004-2007 Nominal GDP (see T9).
Source: SOTR forecasters
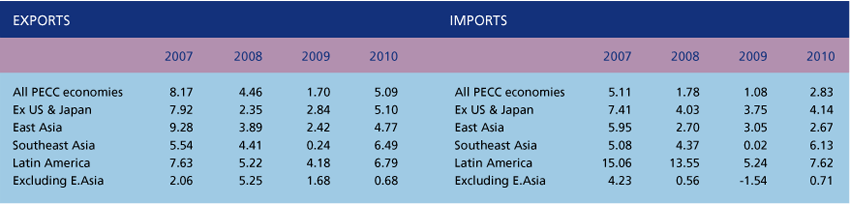
T2: Real export and import growth for PECC economies, 2007-2010 (%)
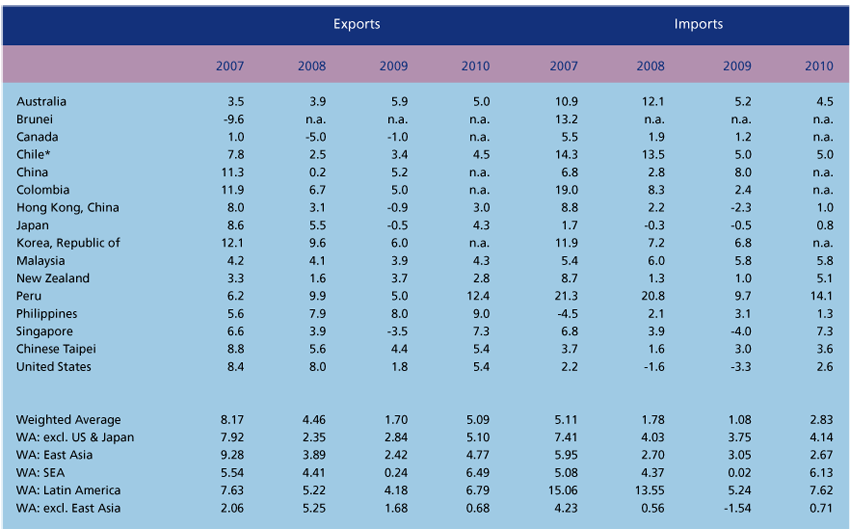
*Statistics from provided by Universidad de Chile complements the update from the Central Bank of Chile.
Note: Export/Imports of goods and services. National currency based. The weighted average is based on the respective economies’ 2004-2007 total trade merchandise (see T8).
Source: SOTR forecasters.
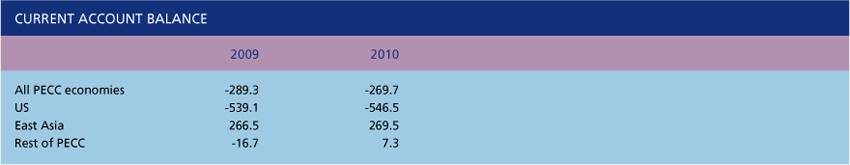
T3: Current account of the balance of payments for the PECC economies, 2007-2010 (US$B and % of GDP)
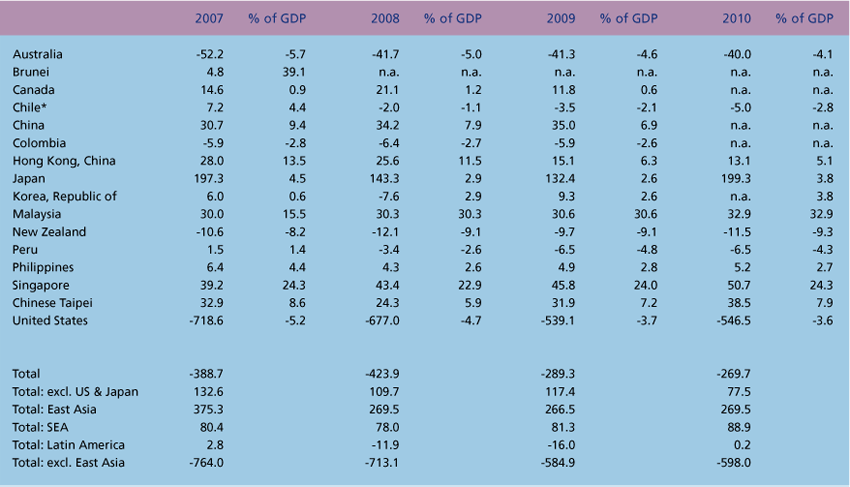
*Statistics from provided by Universidad de Chile complements the update from the Central Bank of Chile.
Source: SOTR forecasters.
T4: Forecast of contributions to real GDP/GNP growth rate for PECC economies, 2009-2010 (% per year)
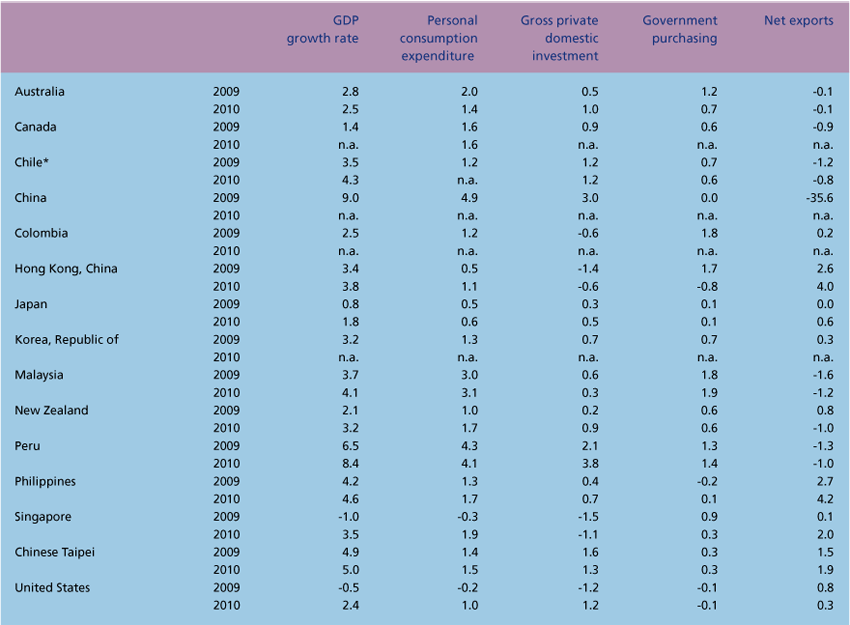
*Statistics from provided by Universidad de Chile complements the update from the Central Bank of Chile.
Note: National currency based. Components of GDP/GNP do not add up to overall growth rates for some economies, due to statistical discrepancies.
Source: SOTR forecasters.
T5: Actual and forecast levels of short-term, long-term interest rates for PECC economies, 2007-2010 (%)
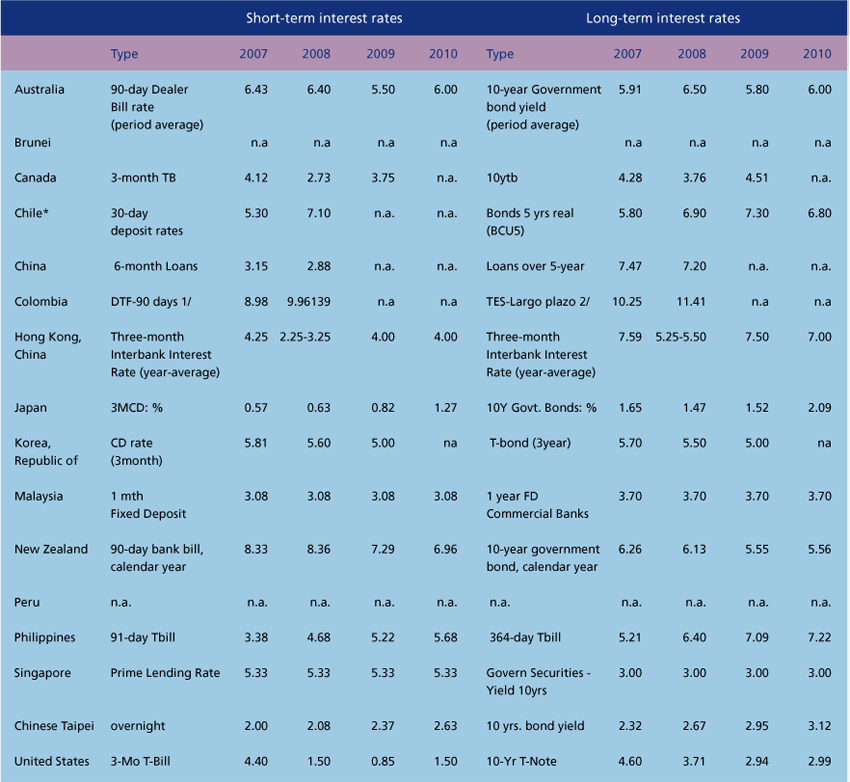
*Statistics from provided by Universidad de Chile complements the update from the Central Bank of Chile.
Source: SOTR forecasters.
T6: Exchange Rates, 2007-2010 (Local Currency Per US$)
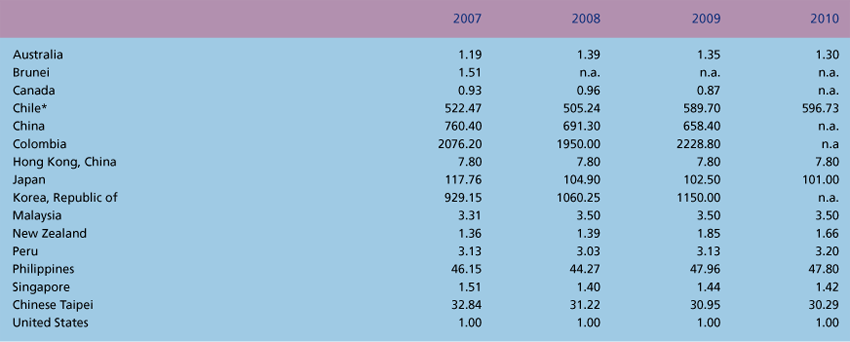
*Statistics from provided by Universidad de Chile complements the update from the Central Bank of Chile.
Source: SOTR forecasters.
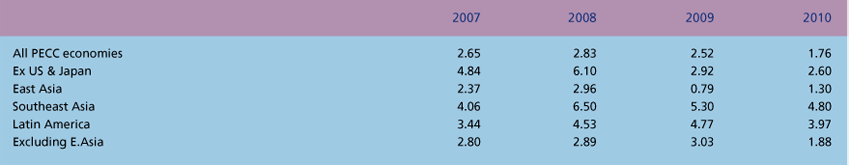
T7: GDP Deflator Growth, 2007-2010 (%)
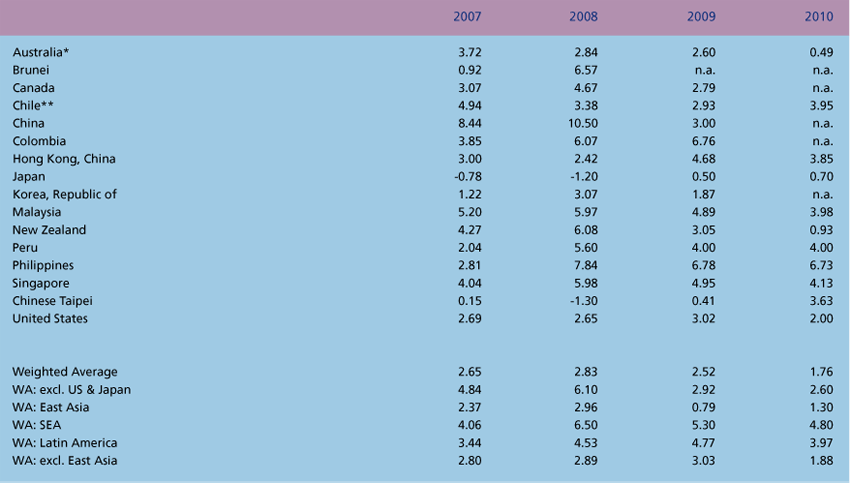
Note: Base year = 100 unless otherwise noted.
* Australian financial year, covering Q3-Q4 of 2003 and Q1-Q2 of 2004.
**Statistics from provided by Universidad de Chile complements the update from the Central Bank of Chile.
Source: SOTR forecasters
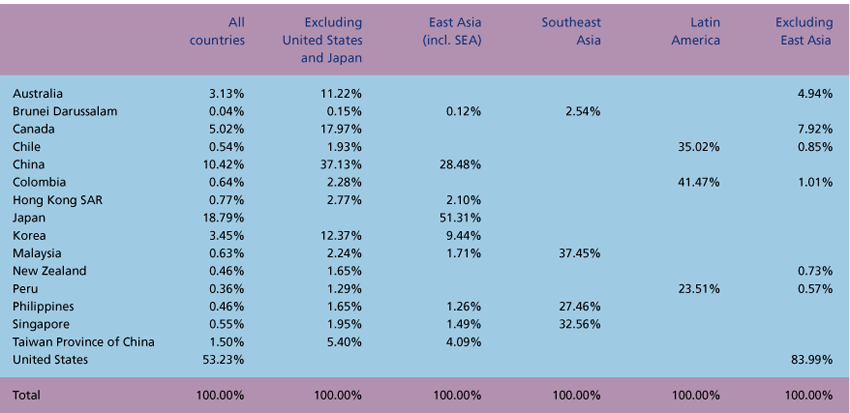
T8: Trade Weights, 2004-2007 average (%)
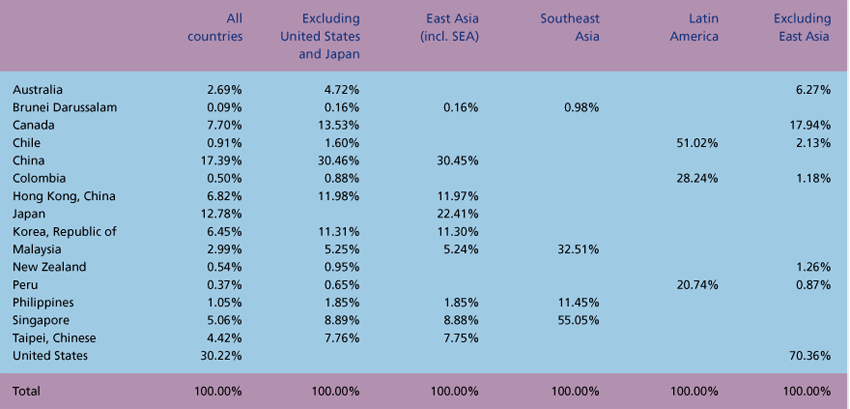
Source: Compiled from WTO Statistics. Trade Weights is the total merchandise (imports and exports) of each country over the total trade merchandise of PEO economies.
T9: GDP Weights, 2004-2007 average (%)
Source: Compiled from IMF Statistics. GDP Weights are the nominal GDP of each country over the total nominal GDP of PEO economies.