Chapter 3 - A Composite Index of
Economic Integration in the Asia-Pacific
The Asia-Pacific Economic Cooperation (APEC) forum celebrates its 20th anniversary in 2009 at a time of great stress and change in the world economy. With the emergence of new global fora such as the G20, and the heightened interest in Asian regional architecture, the validity and success of APEC’s work in the past two decades is under fresh scrutiny. There will be special attention in 2010 when APEC reaches the first of its Bogor targets for free and open trade in the developed member economies. Since APEC has not defined “free and open trade”, there are potentially many different ways to measure its success in achieving this target. It is important, however, that APEC critically assesses its performance against the 2010 target, and uses it as an opportunity to revive and reform the organization.
It is in this context that PECC has created a new measure of economic integration across 17 APEC economies (data was not available for Brunei Darussalam, Papua New Guinea, Peru and Russia). The PECC Composite Index of Asia-Pacific Economic Integration tracks both the extent to which the economies are becoming more alike in their economic characteristics (i.e. “convergence” measures) and the relative importance of regional trade, investment and human flows compared to economic relations with the rest of the world. To the extent that APEC and the Bogor targets are fundamentally about deepening regional economic integration, this index provides one measure of APEC's success in the last 20 years.
The index was first unveiled in 2008, using data up to 2005, and it has been since been updated to include 2006 data.
Major findings of the 2009 Composite Index of Asia-Pacific Economic Integration include:
- The Asia-Pacific region as a whole is more integrated at the end of 2006 than it was in 1990. Last year’s index shows a steady upward trend in the economic integration of the region from 1991 through 2000, followed by a slight decline between 2001 and 2003, before a resumption in the trend of greater regional economic integration through 2004-2006.
- Singapore is the economy most highly integrated with the Asia-Pacific region, followed by Hong Kong and Chinese Taipei. These three economies have held the top positions for most of the period covered by the index.
- The least integrated economy in 2006 was Indonesia, followed by China, the United States and the Philippines. This is consistent with last year’s findings which ranked both Indonesia and China as the two least integrated economies in the region. The US index, which has fluctuated within a limited range since 1991, continues on a mild downward trajectory.
- The economies which have seen the biggest movement towards regional economic integration between 1991 and 2006 are Hong Kong, New Zealand, Viet Nam, and the Republic of Korea.
- Three economies were less integrated with the Asia-Pacific region in 2006 than in 1991: Indonesia, Mexico, and Singapore. Last year’s findings showed a total of six economies that were less integrated in 2005 than in 1990.
Table 3-1: Comparison of 2005 and 2006 Composite Index
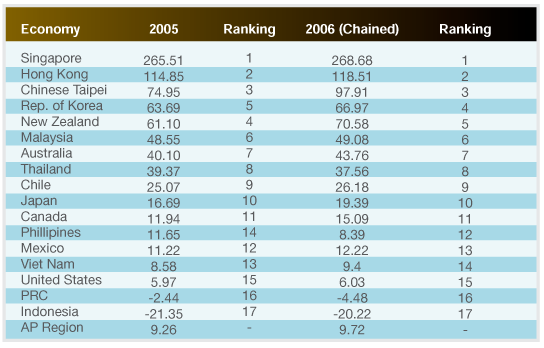
Ranking for the most and least economic intregrated economies remain the same except for New Zealand and Korea who swap spots in the updated composite index. New Zealand drops a spot to 5th place while Korea has risen one position to number 4.
Chart 3-1: Intra-regional trade share, Asia-Pacific
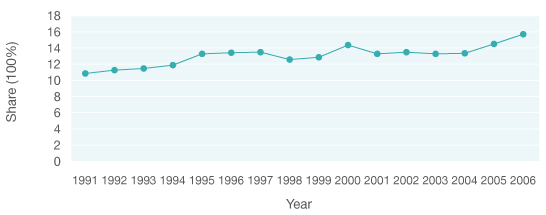
The intra-regional trade share reached a new high in 2006. For the purposes of the index, this calculation excludes trade within sub-regional trading blocs.
Chart 3-2: Intra-regional FDI share, Asia-Pacific
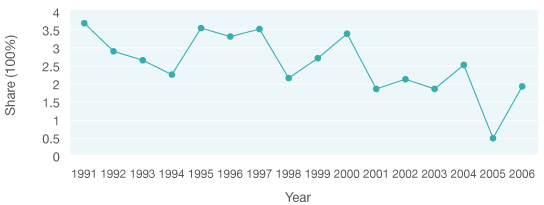
Intra-regional FDI has been very volatile over the period 1991 and 2006. The latest data shows a sharp upward spike.
Chart 3-3: Intra-regional tourist inflow, Asia-Pacific
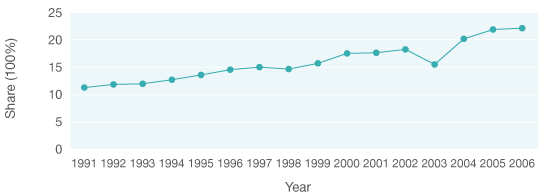
Intra-regional tourism flows continued their upward trend in 2006.
Chart 3-4: Updated Convergence Index: 1991-2006
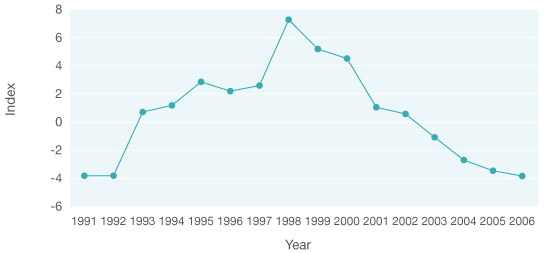
The convergence index –based on deviations from GDP per capita, life expectancy and the level of urbanisation and educational investments—continue to show growing economic differences, suggesting that gaps in the level of economic development in the region remain and may in fact be increasing.
Chart 3-5: Updated Composite Index: 1991-2006
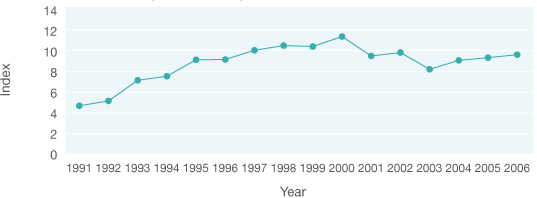
Despite indications of greater economic divergence, the composite index shows that on the whole regional economic integration continued to deepen in 2006.
How to Read the PECC Index of Asia-Pacific Economic
Integration The composite index of economic integration is based on a combination of measures that on the one hand looks at the extent to which the reference economies are becoming more alike in their economic characteristics (“convergence” measures) and on the other hand at the relative importance of trade, investment and human flows within the region compared to economic relations with the rest of the world. The convergence measures are premised on the notion that integration will lead to greater uniformity among the economies. Accordingly, more trade and investment among regional partners may not translate into a higher score on the integration index if at the same time the partners are diverging in terms of income, education, life expectancy, urbanization, and economic structure. Furthermore, since the trade, investment, and tourism measures are calculated relative to global transactions, the index will rise for a given economy only if that economy’s share of trade/investment is growing relative to total trade and investment.
An important feature of the index is that it excludes trade and investment flows among geographically contiguous sub-regional trade agreements, namely NAFTA, the ASEAN free trade agreement, and Australia-New Zealand Closer Economic Relations. It also excludes flows – among the People’s Republic of China, Hong Kong, and Chinese Taipei. This is to control for the effect that sub-regional flows may have on the index, whereby a very high degree of integration among say NAFTA economies could result in a falsely high measure of integration with the Asia-Pacific region as a whole. The exclusion of intra-regional flows did not affect the positions of Hong Kong and Chinese Taipei at the top rankings of the index. On the other hand, the People’s Republic of China’s much lower ranking suggests that a large share of its trade and investment flows with Asia-Pacific partners is with Hong Kong and Chinese Taipei, and that its share of trade and investment with countries outside of the Asia-Pacific is larger than that of other economies in the region.
Caution should be exercised in the interpretation of these findings. The measures chosen for inclusion in the composite index are imperfect indicators of “convergence” and trade/investment integration. The rankings in turn should not be read normatively as "league tables" in the sense that a higher ranking is superior to a lower ranking. Indeed, a low ranking may simply indicate that an economy is more oriented globally than regionally, as is likely the case for China and the United States.
Nevertheless, the change in index value for a given economy over time can be read as a measure of its changing economic orientation. The index value for the region as a whole can also be seen as a measure of closer economic ties among Asia-Pacific economies and as one indicator of APEC’s success. We believe that this finding should be an important – and positive -- factor in assessing APEC’s 2010 Bogor target.
Technical Note on the Composite Index of Asia-Pacific Economic Integration
The index is constructed in two stages, with weights assigned by “Principal Components Analysis” – which calculates the relative importance of each sub-component based on its statistical qualities – rather than by subjective assessment.
In the first stage, a convergence index is constructed to measure the dispersion of selected economic indicators among the Asia- Pacific sample economies. The convergence index is a measure of whether the economies are becoming more alike as a result of closer interaction and economic development. The indicators included in the convergence index are as follows
- Real GDP per capita
- Share of non-agricultural sector in GDP
- Ratio of urban residents to total population
- Life expectancy
- Share of education expenditure in GDP
In the second stage, indicators of trade, investment, and people flows are added to the convergence index and weights are assigned, again using Principal Components Analysis, resulting in the composite index. A change in this year’s index is the use of time-varying weights which are used to update the index using a chained weight approach. Time-varying weights ensure than the relative importance of weights remains accurate from year to year while a chained approach ensures that indices in the composite index are comparable across the 1991 to 2006 period. The chained weights used in the composite index are as follows:
- Composite = 0.2370
- Share of exports and imports to / from other Asia-Pacific economies = 0.2951
- Share of foreign direct investment flows to / from other Asia-Pacific economies = 0.1094
- Share of Asia-Pacific tourist flows from other Asia-Pacific economies = 0.3585
The economies included in the index are all APEC members, namely Australia, Japan, Republic of Korea, People’s Republic of China, Hong Kong, Chinese Taipei, Vietnam, Thailand, Philippines, Indonesia, Singapore, Malaysia, United States of America, Canada, Mexico, Chile, and New Zealand. The stage two components exclude flows among geographically contiguous sub-regional trade agreements, namely the Association of Southeast Asian Nations Free Trade Area (AFTA), North America Free Trade Agreement (NAFTA), and Australia-New Zealand Closer Economic Relations. It also excludes flows among the People’s Republic of China, Hong Kong, and Chinese Taipei.
A full description of the composite index is found in Chen, Bo and Woo, Yuen Pau (2009), A Composite Index of Economic Integration in the Asia-Pacific Region, available at www.asiapacific.ca.