Chapter 3
A Composite Index of Economic Integration in the Asia-Pacific
In the closing months of 2010, the Asia-Pacific Economic Cooperation (APEC) forum is rapidly approaching the first of its Bogor target deadlines for establishing “free and open trade” amongst its developed member economies. Since APEC has not defined “free and open trade”, there are potentially many different ways to measure its success in achieving this target.
In an attempt to provide additional clarity, the Pacific Economic Cooperation Council (PECC) has created a measure of economic integration across 17 APEC economies (data was not available for Brunei Darussalam, Papua New Guinea, Peru, and Russia). The PECC Composite Index of Asia-Pacific Economic Integration tracks both the extent to which the economies are becoming more alike in their economic characteristics (i.e. “convergence” measures) and the relative importance of regional trade, investment and human flows compared to economic relations with the rest of the world.
The index was first unveiled in 2008, using data up to 2005, and it has since been updated to include 2007 data.
Major findings of the 2010 Composite Index of Asia-Pacific Economic Integration include:
Intra-regional Trade Share, Asia-Pacific
Figure 1: Trade Share in AP Region
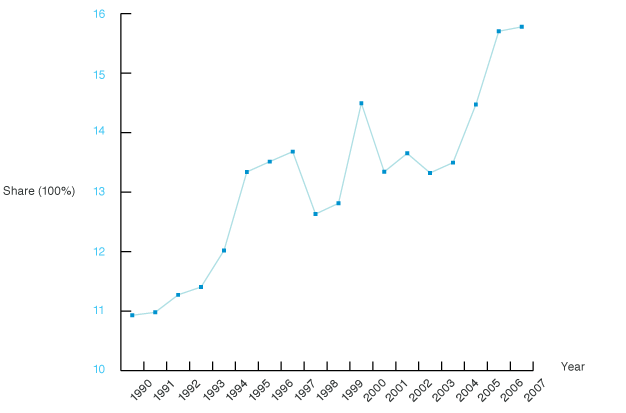
The intra-regional trade share in 2007 remained almost unchanged from 2006 levels. For the purposes of the index, this calculation excludes trade between geographically contiguous economies.
Intra-regional FDI Share, Asia-Pacific
Figure 2: Intra-AP FDI Share within AP Region
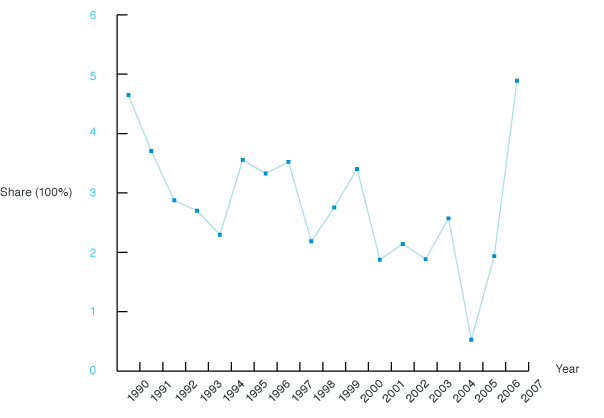
Intra-regional FDI share reached a new high in 2007, reaching nearly 5 percent.
Intra-regional Tourist Inflow, Asia-Pacific
Figure 3: Share of Intra-AP Tourists Inflow
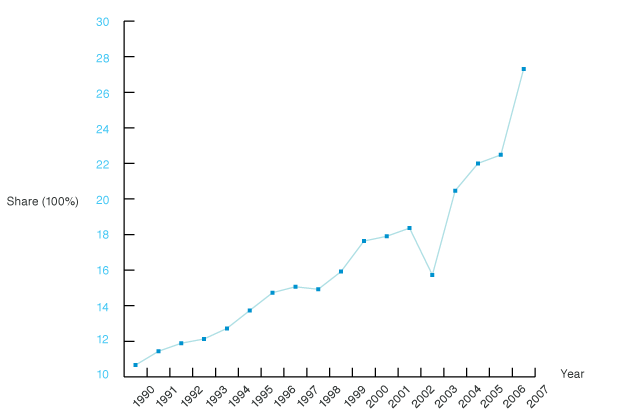
The share of intra-regional tourism inflows showed a sharp increase between 2006 and 2007 .
Updated Convergence Index: 1990-2007
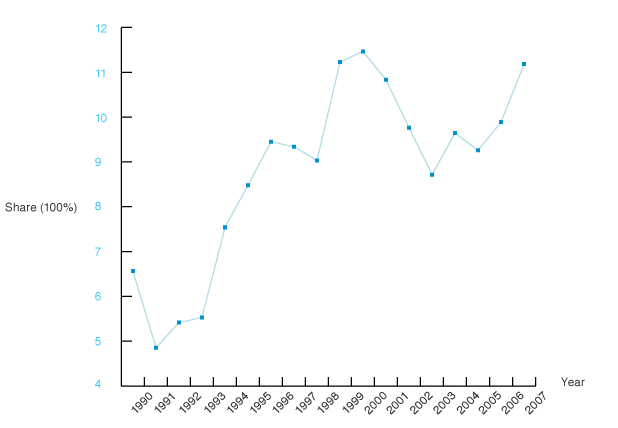
Figure 4: Updated Convergence Index: 1990-2007
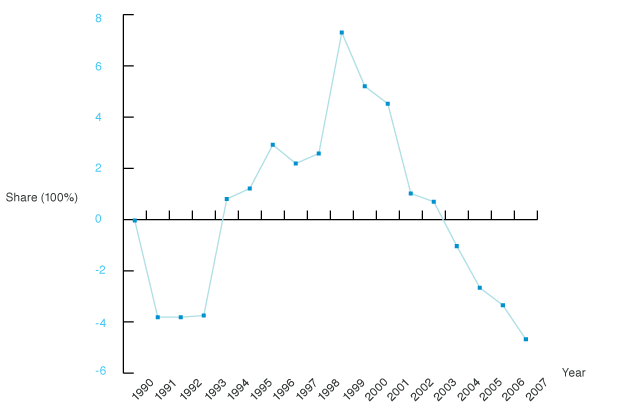
The convergence index suggests that economic disparity in the region has been increasing since 1999, reaching a new high of inequality in 2007. The convergence index is based on deviations from GDP per capita, life expectancy and the level of urbanisation and educational investments.
Updated Composite Index: 1990-2007
Figure 5: Updated Composite Index: 1990-2007
Despite indications of greater economic divergence, the composite index shows that, on the whole, regional economic integration in 2007 increased over 2006 levels.
Table 1: Comparison of 2006 and 2007 Composite Index
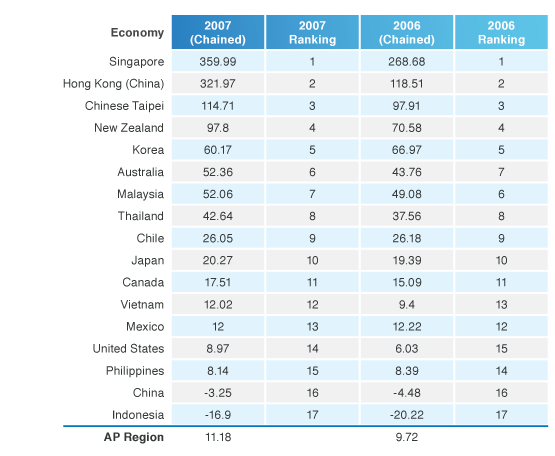
The majority of economies increased their economic integration into the Asia-Pacific region in 2007, but any changes in relative integration rankings were modest. Singapore, Hong Kong (China), and Chinese Taipei strengthened their leading status as the most regionally integrated economies, while Korea, Chile, Philippines and Mexico all experienced a decrease in economic integration in 2007.
How to Read the PECC Index of Asia-Pacific Economic Integration
The composite index of economic integration is based on a combination of measures that on the one hand looks at the extent to which the reference economies are becoming more alike in their economic characteristics (“convergence” measures) and on the other hand at the relative importance of trade, investment and human flows within the region compared to economic relations with the rest of the world. The convergence measures are premised on the notion that integration will lead to greater uniformity among the economies. Accordingly, more trade and investment among regional partners may not translate into a higher score on the integration index if at the same time the partners are diverging in terms of income, education, life expectancy, urbanization, and economic structure. Furthermore, since the trade, investment, and tourism measures are calculated relative to global transactions, the index will rise for a given economy only if that economy’s share of trade/investment is growing relative to total trade and investment.
An important feature of the index is that it excludes trade and investment flows among geographically contiguous sub-regional trade agreements, namely NAFTA, the ASEAN Free Trade Area, and Australia-New Zealand Closer Economic Relations. It also excludes flows between China, Hong Kong (China), and Chinese Taipei. This is to control for the effect that sub-regional flows may have on the index, whereby a very high degree of integration among, for example, NAFTA economies could result in a falsely high measure of integration with the Asia-Pacific region as a whole. In the case of China, Hong Kong (China), and Chinese Taipei, the exclusion of intra-regional flows did not affect the positions of Hong Kong (China) and Chinese Taipei at the top rankings of the index. On the other hand, China’s much lower ranking suggests that a large share of its trade and investment flows with Asia- Pacific partners is with Hong Kong (China) and Chinese Taipei, and that its share of trade and investment with economies outside of the Asia-Pacific is larger than that of other economies in the region.
Caution should be exercised in the interpretation of these findings. The measures chosen for inclusion in the composite index are imperfect indicators of “convergence” and trade/investment integration. The rankings in turn should not be read normatively as “league tables” in the sense that a higher ranking is superior to a lower ranking. Indeed, a low ranking may simply indicate that an economy is more oriented globally than regionally, as is likely the case for China and the United States.
Nevertheless, the change in index value for a given economy over time can be read as a measure of its changing economic orientation. The index value for the region as a whole can also be seen as a measure of closer economic ties among Asia-Pacific economies and as one indicator of APEC’s success. We believe that this finding should be an important – and positive — factor in assessing APEC’s 2010 Bogor target.
Technical Note on the Composite Index of Asia-Pacific Economic Integration
The index is constructed in two stages, with weights assigned by “Principal Components Analysis” — which calculates the relative importance of each sub-component based on its statistical qualities – rather than by subjective assessment.
In the first stage, a convergence index is constructed to measure the dispersion of selected economic indicators among the Asia-Pacific sample economies. The convergence index is a measure of whether the economies are becoming more alike as a result of closer interaction and economic development. The indicators included in the convergence index are as follows:
In the second stage, indicators of trade, investment, and people flows are added to the convergence index and weights are assigned, again using Principal Components Analysis, resulting in the composite index. A change in this year’s index is the use of time-varying weights which are used to update the index using a chained weight approach. Time-varying weights ensure than the relative importance of weights remains accurate from year to year while a chained approach ensures that indices in the composite index are comparable across the 1990 to 2007 period. The chained weights used in the composite index are as follows:
The economies included in the index are all APEC members, namely, Australia, Japan, Korea, China, Hong Kong (China), Chinese Taipei, Vietnam, Thailand, Philippines, Indonesia, Singapore, Malaysia, United States of America, Canada, Mexico, Chile, and New Zealand. The stage two components exclude flows among geographically contiguous sub-regional trade agreements, namely, the Association of Southeast Asian Nations Free Trade Area (AFTA), North America Free Trade Agreement (NAFTA), and Australia-New Zealand Closer Economic Relations. It also excludes flows between China, Hong Kong (China), and Chinese Taipei.
A full description of the composite index is found in Chen, Bo and Woo, Yuen Pau (2009), A Composite Index of Economic Integration in the Asia-Pacific Region, available at www.asiapacific.ca
In an attempt to provide additional clarity, the Pacific Economic Cooperation Council (PECC) has created a measure of economic integration across 17 APEC economies (data was not available for Brunei Darussalam, Papua New Guinea, Peru, and Russia). The PECC Composite Index of Asia-Pacific Economic Integration tracks both the extent to which the economies are becoming more alike in their economic characteristics (i.e. “convergence” measures) and the relative importance of regional trade, investment and human flows compared to economic relations with the rest of the world.
The index was first unveiled in 2008, using data up to 2005, and it has since been updated to include 2007 data.
Major findings of the 2010 Composite Index of Asia-Pacific Economic Integration include:
- Overall, the APEC economies were more integrated at the end of 2007 than in 2006. The composite index for the region as a whole increased from 9.72 in 2006 to 11.18 in 2007, approaching levels of integration not seen since 2000.
- Despite enhanced economic integration, economic disparity in the region has been increasing since 1999, reaching a new high of inequality in 2007.
- Economy-by-economy analysis indicates that the majority of APEC members deepened economic integration into the Asia-Pacific region in 2007, while changes in relative integration rankings were modest.
- Singapore, Hong Kong (China), and Chinese Taipei strengthened their leading positions as the three most regionally integrated economies in the Asia-Pacific.
- Australia, Vietnam, and the United States each moved up a notch in their positions since 2006.
- On the other hand, Malaysia, Mexico, and the Philippines each experienced a decrease in economic integration with the region in 2007. The Philippines replaced the United States to join Indonesia and China as the three economies that are least integrated with the Asia-Pacific in 2007.
- Intra-regional FDI and tourist inflow shares in 2007 saw large gains, increasing to approximately 4.9% and 27.3% respectively.
Intra-regional Trade Share, Asia-Pacific
Figure 1: Trade Share in AP Region
The intra-regional trade share in 2007 remained almost unchanged from 2006 levels. For the purposes of the index, this calculation excludes trade between geographically contiguous economies.
Intra-regional FDI Share, Asia-Pacific
Figure 2: Intra-AP FDI Share within AP Region
Intra-regional FDI share reached a new high in 2007, reaching nearly 5 percent.
Intra-regional Tourist Inflow, Asia-Pacific
Figure 3: Share of Intra-AP Tourists Inflow
The share of intra-regional tourism inflows showed a sharp increase between 2006 and 2007 .
Updated Convergence Index: 1990-2007
Figure 4: Updated Convergence Index: 1990-2007
The convergence index suggests that economic disparity in the region has been increasing since 1999, reaching a new high of inequality in 2007. The convergence index is based on deviations from GDP per capita, life expectancy and the level of urbanisation and educational investments.
Updated Composite Index: 1990-2007
Figure 5: Updated Composite Index: 1990-2007
Despite indications of greater economic divergence, the composite index shows that, on the whole, regional economic integration in 2007 increased over 2006 levels.
Table 1: Comparison of 2006 and 2007 Composite Index
The majority of economies increased their economic integration into the Asia-Pacific region in 2007, but any changes in relative integration rankings were modest. Singapore, Hong Kong (China), and Chinese Taipei strengthened their leading status as the most regionally integrated economies, while Korea, Chile, Philippines and Mexico all experienced a decrease in economic integration in 2007.
How to Read the PECC Index of Asia-Pacific Economic Integration
The composite index of economic integration is based on a combination of measures that on the one hand looks at the extent to which the reference economies are becoming more alike in their economic characteristics (“convergence” measures) and on the other hand at the relative importance of trade, investment and human flows within the region compared to economic relations with the rest of the world. The convergence measures are premised on the notion that integration will lead to greater uniformity among the economies. Accordingly, more trade and investment among regional partners may not translate into a higher score on the integration index if at the same time the partners are diverging in terms of income, education, life expectancy, urbanization, and economic structure. Furthermore, since the trade, investment, and tourism measures are calculated relative to global transactions, the index will rise for a given economy only if that economy’s share of trade/investment is growing relative to total trade and investment.
An important feature of the index is that it excludes trade and investment flows among geographically contiguous sub-regional trade agreements, namely NAFTA, the ASEAN Free Trade Area, and Australia-New Zealand Closer Economic Relations. It also excludes flows between China, Hong Kong (China), and Chinese Taipei. This is to control for the effect that sub-regional flows may have on the index, whereby a very high degree of integration among, for example, NAFTA economies could result in a falsely high measure of integration with the Asia-Pacific region as a whole. In the case of China, Hong Kong (China), and Chinese Taipei, the exclusion of intra-regional flows did not affect the positions of Hong Kong (China) and Chinese Taipei at the top rankings of the index. On the other hand, China’s much lower ranking suggests that a large share of its trade and investment flows with Asia- Pacific partners is with Hong Kong (China) and Chinese Taipei, and that its share of trade and investment with economies outside of the Asia-Pacific is larger than that of other economies in the region.
Caution should be exercised in the interpretation of these findings. The measures chosen for inclusion in the composite index are imperfect indicators of “convergence” and trade/investment integration. The rankings in turn should not be read normatively as “league tables” in the sense that a higher ranking is superior to a lower ranking. Indeed, a low ranking may simply indicate that an economy is more oriented globally than regionally, as is likely the case for China and the United States.
Nevertheless, the change in index value for a given economy over time can be read as a measure of its changing economic orientation. The index value for the region as a whole can also be seen as a measure of closer economic ties among Asia-Pacific economies and as one indicator of APEC’s success. We believe that this finding should be an important – and positive — factor in assessing APEC’s 2010 Bogor target.
Technical Note on the Composite Index of Asia-Pacific Economic Integration
The index is constructed in two stages, with weights assigned by “Principal Components Analysis” — which calculates the relative importance of each sub-component based on its statistical qualities – rather than by subjective assessment.
In the first stage, a convergence index is constructed to measure the dispersion of selected economic indicators among the Asia-Pacific sample economies. The convergence index is a measure of whether the economies are becoming more alike as a result of closer interaction and economic development. The indicators included in the convergence index are as follows:
- Real GDP per capita
- Share of non-agricultural sector in GDP
- Ratio of urban residents to total population
- Life expectancy
- Share of education expenditure in GDP
In the second stage, indicators of trade, investment, and people flows are added to the convergence index and weights are assigned, again using Principal Components Analysis, resulting in the composite index. A change in this year’s index is the use of time-varying weights which are used to update the index using a chained weight approach. Time-varying weights ensure than the relative importance of weights remains accurate from year to year while a chained approach ensures that indices in the composite index are comparable across the 1990 to 2007 period. The chained weights used in the composite index are as follows:
- Composite = 0.2370
- Share of exports and imports to / from other Asia-Pacific economies = 0.2951
- Share of foreign direct investment flows to / from other Asia-Pacific economies = 0.1094
- Share of Asia-Pacific tourist flows from other Asia-Pacific economies = 0.3585
The economies included in the index are all APEC members, namely, Australia, Japan, Korea, China, Hong Kong (China), Chinese Taipei, Vietnam, Thailand, Philippines, Indonesia, Singapore, Malaysia, United States of America, Canada, Mexico, Chile, and New Zealand. The stage two components exclude flows among geographically contiguous sub-regional trade agreements, namely, the Association of Southeast Asian Nations Free Trade Area (AFTA), North America Free Trade Agreement (NAFTA), and Australia-New Zealand Closer Economic Relations. It also excludes flows between China, Hong Kong (China), and Chinese Taipei.
A full description of the composite index is found in Chen, Bo and Woo, Yuen Pau (2009), A Composite Index of Economic Integration in the Asia-Pacific Region, available at www.asiapacific.ca