Amidst global trade slowdown and rising protectionism, APEC economies face a potential threat of backsliding on the progress in trade liberalization and regional integration under the Bogor Goals. In response, APEC leaders have set out to establish “a seamlessly and comprehensively connected and integrated Asia-Pacific” by 2025 through the APEC Connectivity Blueprint, with a mid-term review to be conducted by officials by 2020. The ‘APEC Connectivity Framework’ first emerged in 2013 and was further developed into the Blueprint for formal endorsement at the Leaders’ Meeting in Beijing the subsequent year. It comprises a set of agreed initiatives and targets under the physical, institutional and people-to-people connectivity pillars that APEC leaders have committed to accomplish with the view to bring the APEC region closer together and strengthen economic integration.
Connectivity is a broad term which can potentially encompass everything from improvements in energy grids, transportation networks and digital infrastructure to trade facilitation. Recognizing multi-dimensional aspect of connectivity, the APEC Connectivity Blueprint stays away from defining the term directly and explains it as consisting of physical, institutional and people-to-people elements. According to the Blueprint, the overarching goal of the APEC Connectivity Agenda is to strengthen physical, institutional and people-to-people connectivity by taking agreed actions and meeting agreed targets by 2025, with the objective of achieving a seamless and comprehensively connected and integrated Asia-Pacific.
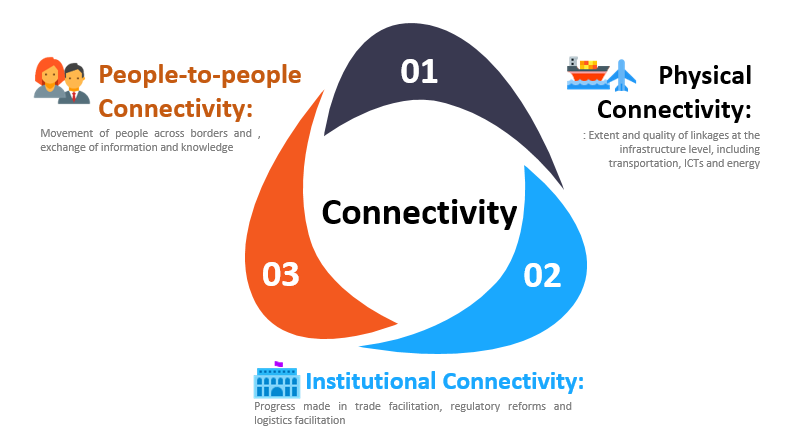
The APEC Leaders defined the three pillars as below:
- Physical connectivity involves improving supply chain performance, connects and integrates logistics, transport, energy and telecommunication infrastructure in the APEC region.
- Institutional connectivity refers to advances in regulatory and procedural cooperation and coherence among APEC economies.
- People-to-people connectivity involves improvements in interaction, mobility and joint endeavors in people movement among APEC economies.
While the Blueprint sets ambitious targets to realize its vision and provides a high-level framework to organize the relevant work streams, it would need to include measurement methods, monitoring and evaluation strategy to be able to claim what progress APEC has made toward achievement of these goals. In this respect, PECC has undertaken to develop a new composite index to assess the state of connectivity among APEC members, and between APEC/PECC economies and the rest of the international community.
The project is carried out in two phases:
• Phase 1: Conceptualization and Design of the Connectivity Index (first half of 2017)
• Phase 2: Development of the Connectivity Index (second half of 2017)
The composite index will be updated every two years and serve as a basis for some specific policy recommendations. The PECC Connectivity Index is intended to contribute to APEC’s ability to assess and track progress of APEC economies towards fulfilling the connectivity vision set out in the Blueprint.
Connectivity Index Results
(https://www.pecc.org/state-of-the-region-reports/282-2019-2020/841-chapter-3-index-of-economic-connectivity-in-the-asia-pacific)
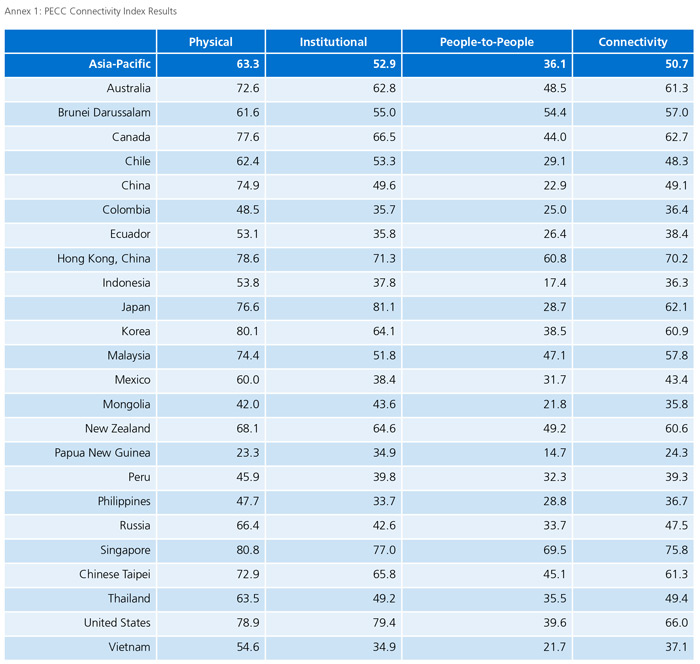
Figure 3.2 below shows the overall connectivity score divided into the 3 pillars, as well as the scores for the three pillars and their component sub-indices for the Asia-Pacific region as whole.
For the region, physical connectivity accounts for 41 percent of connectedness followed by institutional at 35 percent and people to people at 24 percent. While there are some differences at the level of individual economies, the pattern is fairly common across all regional economies no matter the level of development.
In Figure 3.2, the scores have been normalized to be out of 100 to allow for comparison across each sub-index. As shown in the chart, overall physical connectivity is much higher than both institutional and people-to-people. Within each pillar there is considerable variance in performance on each sub-index. As argued in the conceptual framework for the Index, there three pillars are selfreinforcing and inter-related; better transportation linkages between economies foster movements of goods and services which would indicate the need for greater focus on the institutional and people-to-people pillars.
The Index also shows considerable variance among economies on the overall level of connectivity as well as within each sub-index. While this may well be a result of deliberate policy choices and development models, at the same time, the index identifies possible areas for action.
The difference shown at both the pillar and sub-index pillar provides policy-makers areas for focus in the post-2020 mid-term review phase of the APEC Connectivity Blueprint.
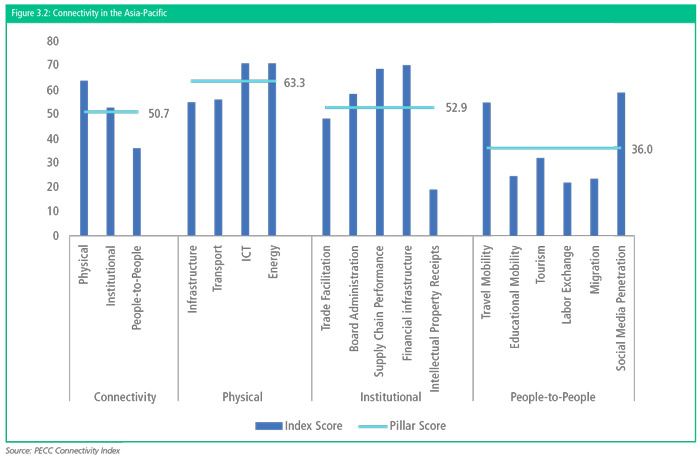
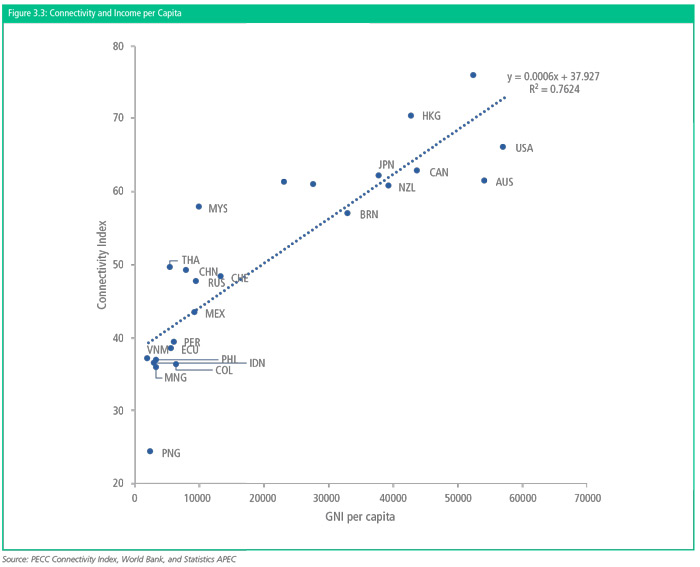
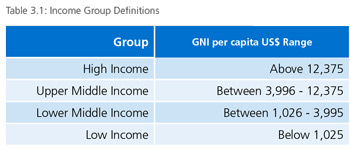
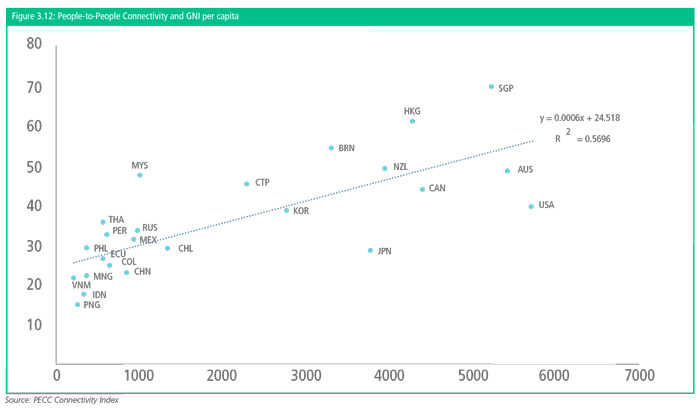
Figure 3.3 shows regional economies’ index values with their GNI per capita levels. The line shows the best fit between the two sets of data. To further analyze these results economies included in the index were divided into major income groups as defined by the World Bank.
Some caution is required in interpreting the data this way; the data should not be interpreted as a ranking but as a way to identify areas for further investigation because of the eccentricities in constructing an index. For example, several indicators in the people-to-people pillar are normalized using population which tends to result in high results for economies with smaller populations and lower results for those with high populations.
High Income Economies The high-income group includes 11 economies whose overall connectivity scores ranges from Singapore at 76 to Chile at 48, this matches the spread of the group in terms of GNI per capita, Singapore having the highest at US$52,000 and Chile the lowest of this group at US$13,420. Even though Chile has the lowest Index score amongst high-income economies, it scores higher than the regional best fit line would otherwise indicate.
Amongst the high-income group several economies lie well above the line – Singapore and Hong Kong (China), Korea, and Chinese Taipei while others fall below such as Australia and the United States.
A deeper look at the sub-pillar level suggests reasons why some economies tend to fall above or below the line of best fit. For example. Singapore’s people-to-people connectivity score is 51 percent higher than the average for high-income economies while Japan’s score is 38 percent lower than peers and the United States is 14 percent lower. On the other hand, the United States scores 18 percent higher than the average for high-income economies on institutional connectivity.
Upper Middle Income The middle-income group includes 8 economies whose overall connectivity scores ranged from Malaysia at 57.8 to Colombia at 36.4. As shown in Figure 3.3, Malaysia is well above the line of best fit. Malaysia scores above the average for upper middle economies across all pillars but it is its performance in people to people connectivity at 48 percent higher than the average for its income cohort that stands out. While China on the other hand outperforms its peers in this cohort in terms of physical and institutional connectivity, its score on people to people connectivity is significantly lower than average. Indeed, some of the upper middle-income economies physical connectivity scores place them on par with those in the high-income group – in addition to those already mentioned, Thailand and Russia also perform well.
Lower Middle Income The lower middle-income group includes five economies whose scores range from Vietnam at 37.1 to Papua New Guinea at 24.3. As shown in Figure 3.3, the economies in this group tend to be clustered below the line of best fit leading to the conclusion that the relatively high range in incomes per capita in the region may be distorting some of the analysis. Even just amongst peers, some trends stand out, for example even though Vietnam does not have the highest income per capita amongst this group it scored the highest albeit by a small margin. Both Indonesia and Vietnam tended to do better than the cohort average on the physical pillar while Papua New Guinea was significantly further behind. The Philippines on the other hand was well above its peer group in terms of people-to-people connectivity.
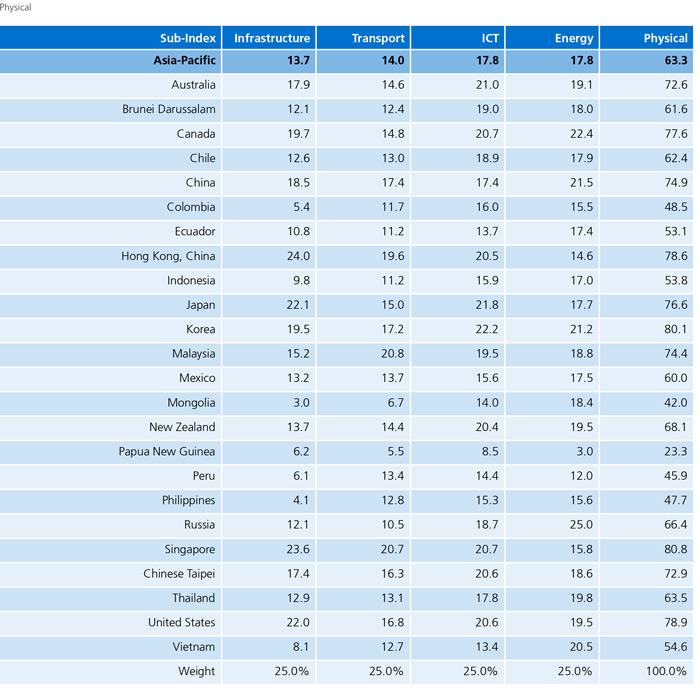
Physical Connectivity
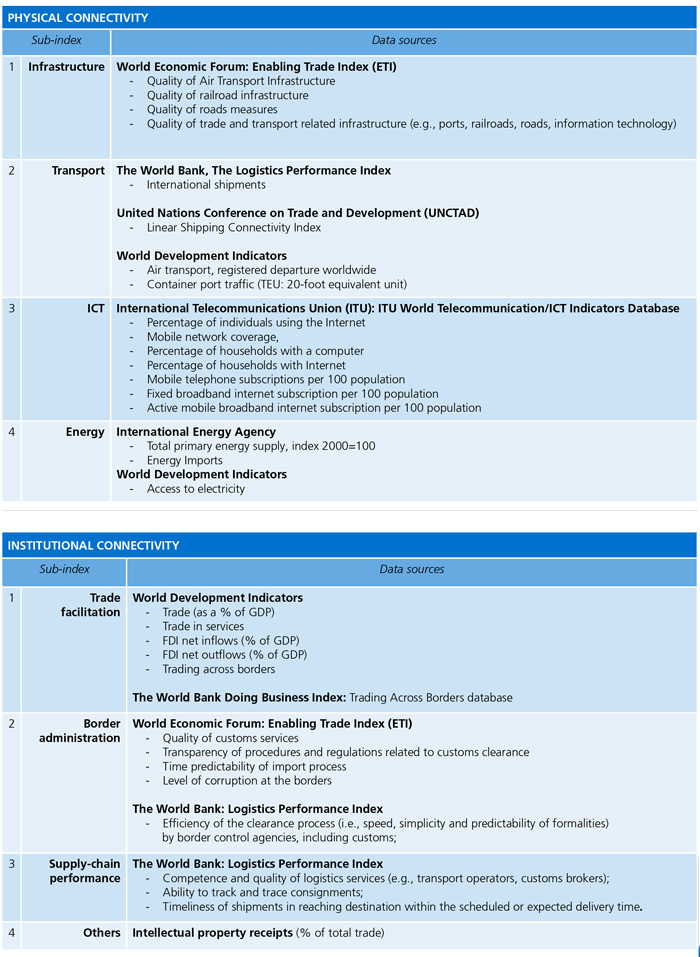
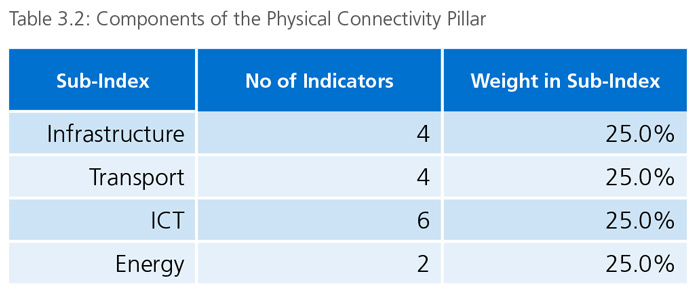
The physical connectivity pillar covers 4 sub-indices: infrastructure; transport; information and communications technology; and energy. In turn, these are composed of a total of 16 indicators. Each sub-index was been weighted equally at 25 percent each.
A list of the indicators under each sub-index is available in the annex.
Even though each sub-index is weighted equally at 25 percent, for the region, ICT and energy account for 28 percent each of the region’s total physical connectivity score. One might argue that there is a subjective component to the relative importance of each sub-index but this is an issue for policy-makers to discuss. The point here is to shed light on areas of possible cooperation for regional economies. Considering the relative performance of each economy on physical connectivity, the differences at the sub-pillar level point to possible areas where individual economies may wish to focus efforts.
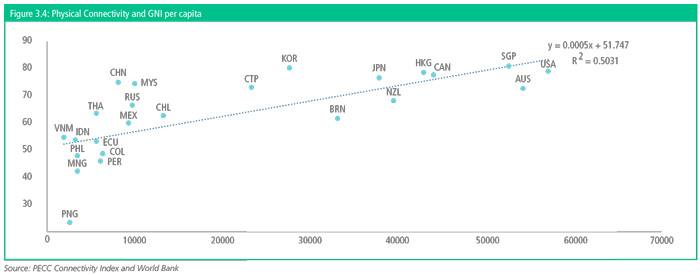
The results for high income economies ranged from Singapore at 80.8 to Brunei Darussalam at 61.6. High income economies displayed a large degree of heterogeneity with their respective strengths across the sub-indices included in the physical connectivity pillar. Interestingly, even though Singapore topped the cohort in terms of its overall score, its score on the energy pillar was 15 percent lower than the group average while its score for infrastructure was 27 higher.
As shown in Figure 3.5, while Brunei Darussalam and Chile had similar scores on physical connectivity, with reference to Figure 3.4, Chile is above the best fit line due to its lower GNI per capita while Brunei Darussalam is below the line. Canada on the other hand performs similarly to its income group peers except on energy where it was 21 percent above the cohort average.
Both Korea and the United States performed above their peers across the sub-indices for physical pillar even though the latter fell below the best fit line due to its higher income level.
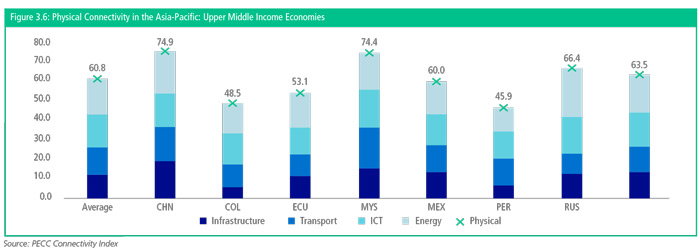
The results for the upper middle-income group ranged from China at 74.9 to Peru at 45.9. China, and indeed Malaysia, Russia and Thailand’s scores for the physical pillar were at par or higher than some of those in the high-income group. Where China and Malaysia tended to strongly outperform their peers in this cohort were in infrastructure and transportation. Russia on the other hand was well above others in this group in terms of energy.
While Peru was below the upper middle-income group average for infrastructure, ICT and energy it was above the cohort average for transport. Thailand performed well across every sub-index.
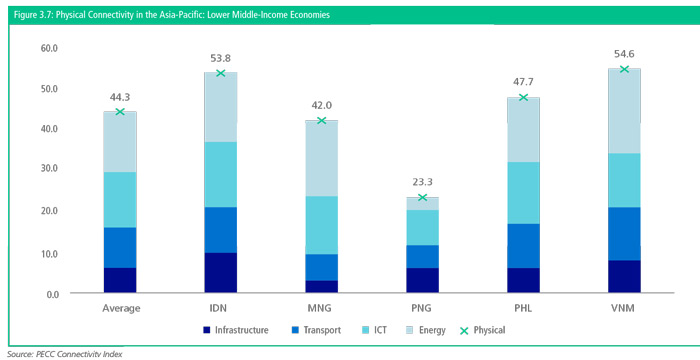
The lower middle-income group ranged from Vietnam at 54.6 to Papua New Guinea at 23.3. As with the upper middle group, some members of the lower middle-income group performed on par or better than those in the upper middle-income group. Even though Vietnam does not have the highest GNI per capita amongst this group it outperformed the cohort average across each sub-index except for ICT. The Philippines on the other hand performed below the group average for infrastructure but did better on ICT.
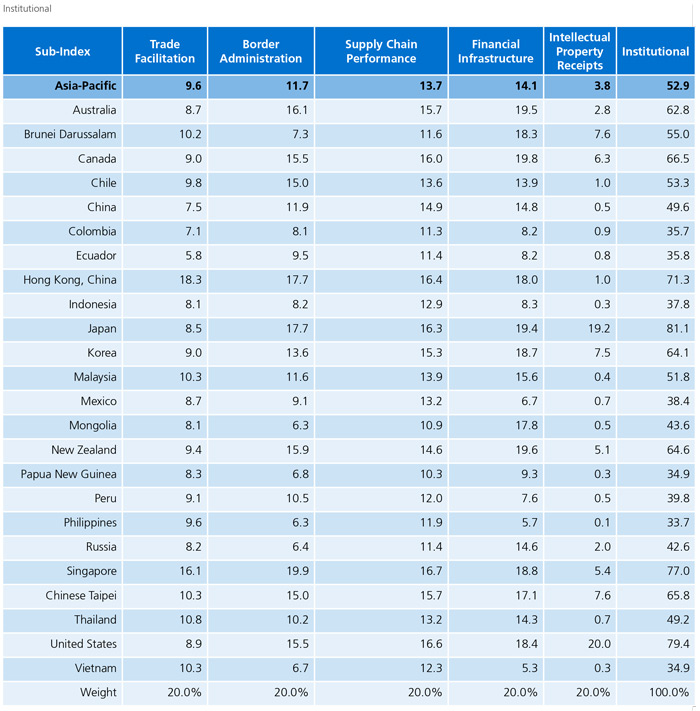
Institutional Connectivity
The institutional connectivity sub-index covers 5 sub-indices: trade facilitation; border administration; supply chain performance; financial infrastructure; and intellectual property receipts. Again, as with physical connectivity, these sub-indices are in turn composed of several indicators as shown in Table 3.3 below
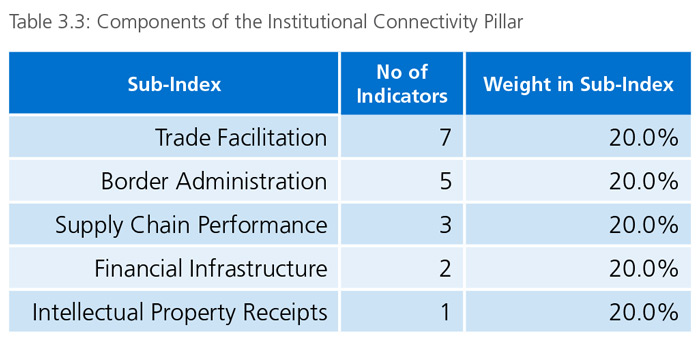
As with the Physical Connectivity pillar, the region’s performance on institutional connectivity was unevenly spread out among the sub-indices. Out of the region’s score of 53, approximately 50 percent come from financial infrastructure and supply chain performance while a fifth each come from border administration and trade facilitation. Again, performance differed considerably among economies even within those with similar income levels.
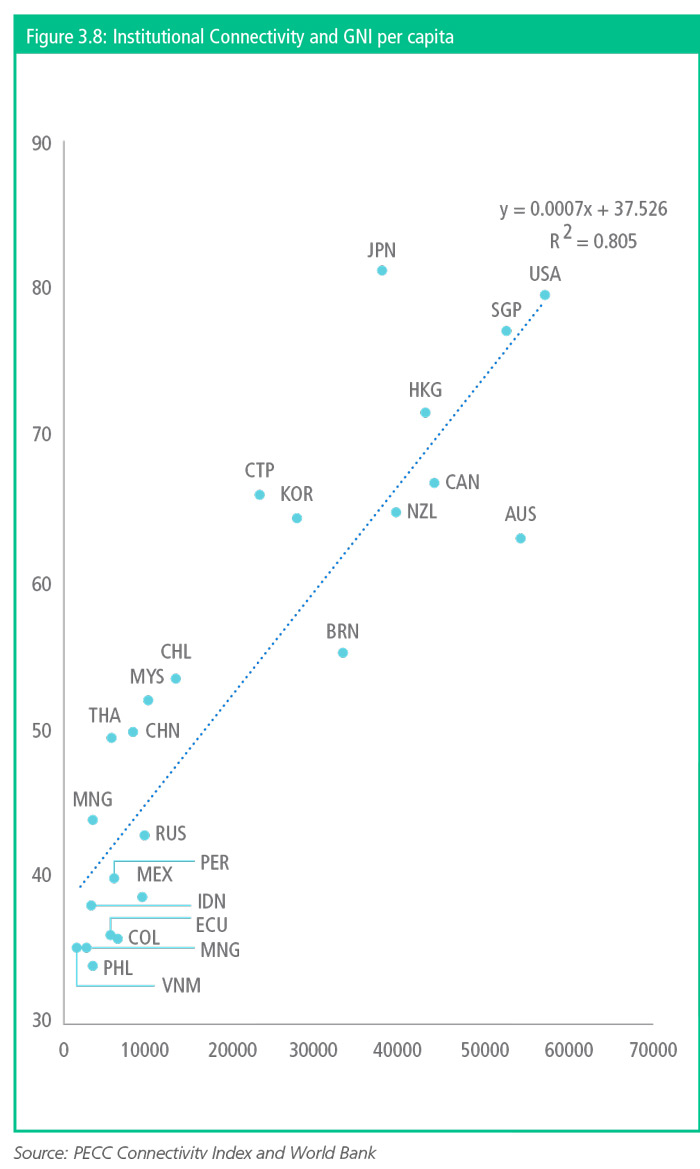
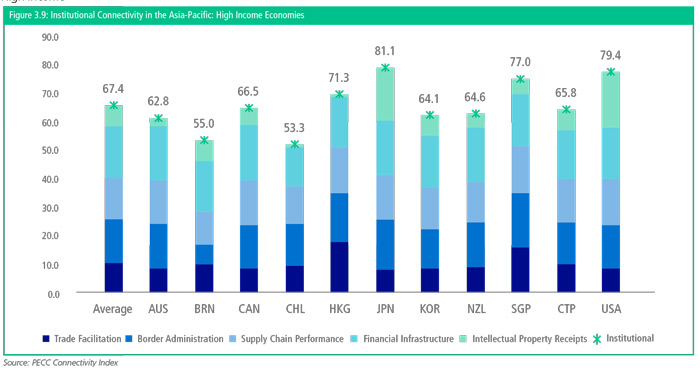
The results for institutional connectivity in the high-income group ranged from Japan at 81.1 to Chile at 53.3. Even though Chile had the lowest score amongst high income economies, it should be emphasized that Chile’s score fell above the regional best fit line – indicating that its institutional connectivity is better than one might expect from its income level. With reference to Figure 3.8, it is worth noting that Japan is significantly above the best fit line.
Compared to its peers in the high-income group, Japan has a lower than average score for trade facilitation but outperforms in the other sub-indices, but it is in Intellectual Property Receipts that it does far better than the cohort average. Even though Singapore outperform across every other sub-index, it is below the cohort average in terms of intellectual property receipts.
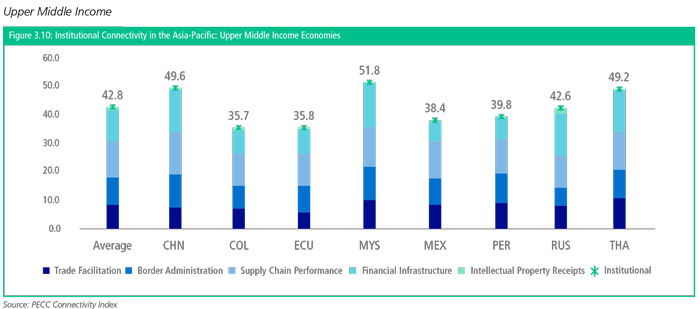
The results for institutional connectivity for the upper middleincome group ranged from Malaysia at 51.8 to Colombia at 35.7. Unlike with physical connectivity, the top of this group is not on par with those in the high-income group perhaps indicating a higher degree of elasticity with GNI per capita.
Malaysia had above average scores across all the institutional connectivity sub-index for its income coherent except for intellectual property receipts. For upper middle-income economies, Russia’s strong performance in this regard tended to distort the average for this income cohort.
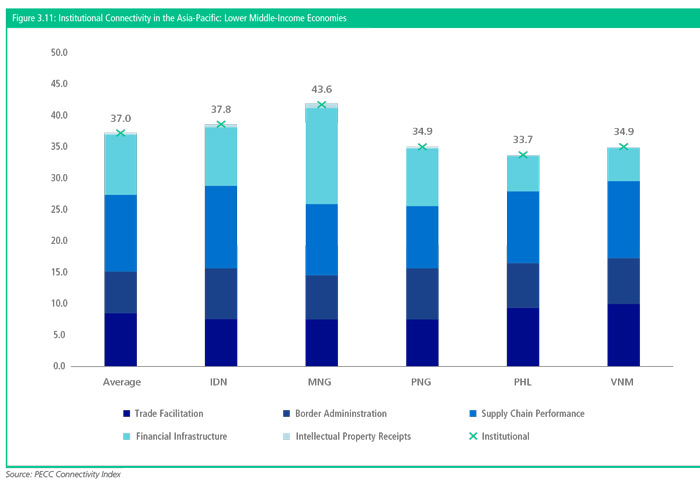
The results for lower middle-income economies ranged from Mongolia at 43.6 to the Philippines at 33.7. Where Mongolia tended to significantly outperform peers in this cohort was in financial infrastructure. By way of comparison, 93 percent of Mongolian’s above the age of 15 had an account at a financial institution compared to 32 percent in the Philippines.
While Vietnam performed better than the cohort on trade facilitation its score was slightly lower on border facilitation. On the other hand, Indonesia’s performance was the opposite, having a lower than group average on trade facilitation but higher on border administration.
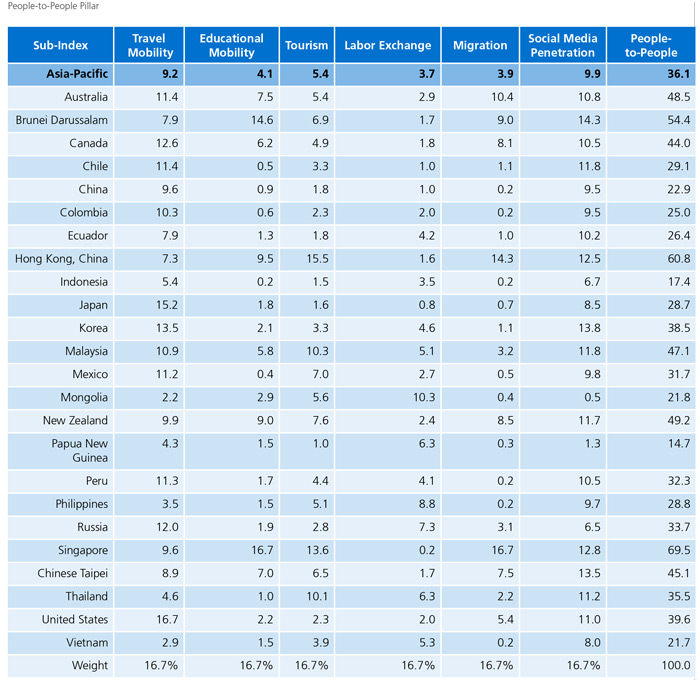
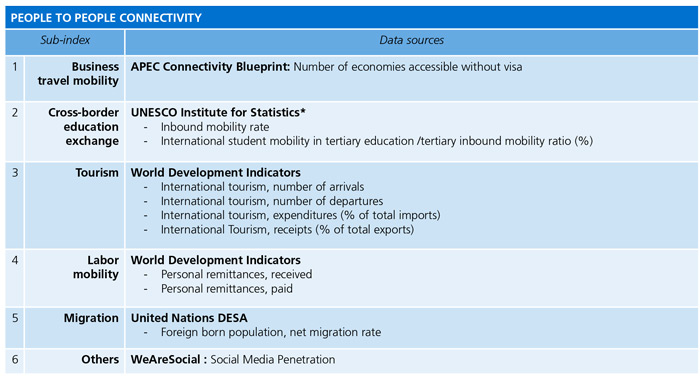
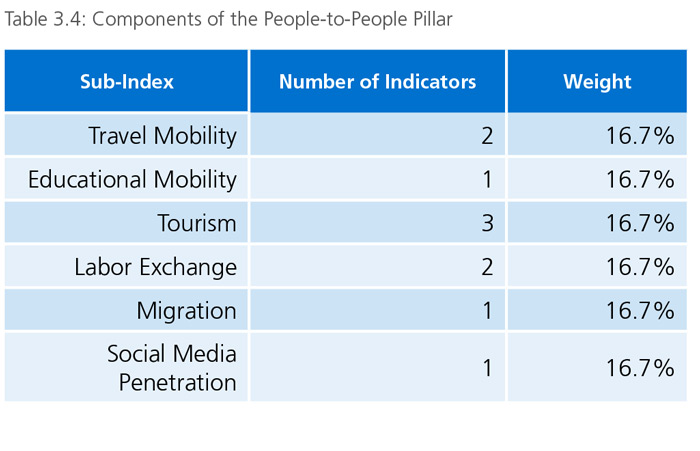
People to People
The people to people sub-index includes measures for: travel Mobility; Educational Mobility; Tourism; Labor Exchange; tourism; migration and social media penetration.
As shown in Figure 3.2, people-to-people connectivity is well-below the region’s performance for both the physical and institutional pillars. While each sub-index is weighted at 16.7 percent, two sub-indices account for over half of the region’s performance on people-to-people connectivity, travel mobility and social media penetration.
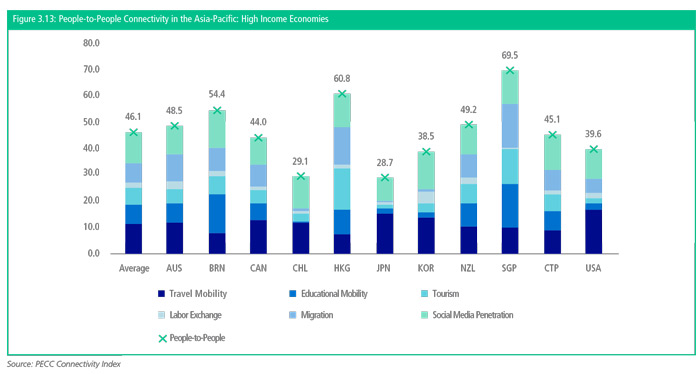
The results for people-to-people connectivity for the high-income group ranged from Singapore at 69.5 to Japan at 28.7. Singapore performed very strongly on three sub-indices of this pillar: educational mobility; tourism; and migration. Perhaps surprisingly it was below the cohort average for travel mobility which needs some explanation. This sub-index includes two indicators: passport power and number of embassies; and total number of embassies, high commissions, consulates, and other representations. While the Singapore passport is one of the most powerful passports in the group, it scored less highly in terms of the number of missions. This is one example in which the equal weight of indicators becomes a question for debate.
Japan on the other hand scored lower than the cohort average on educational mobility, tourism, labor exchange and especially migration. With respect to the overall connectivity score there had been some discussion of the relatively low score of the United States. Looking into the sub-indices of this pillar allows for a better understanding of why that result occurs. The United States scores lower than other high-income economies in education mobility and tourism. Education mobility is measured by flows at the tertiary level normalized by the total number of people studying in that economy. While Australia might have a similar level of people studying at the tertiary level it takes in a much higher percentage of overseas students.
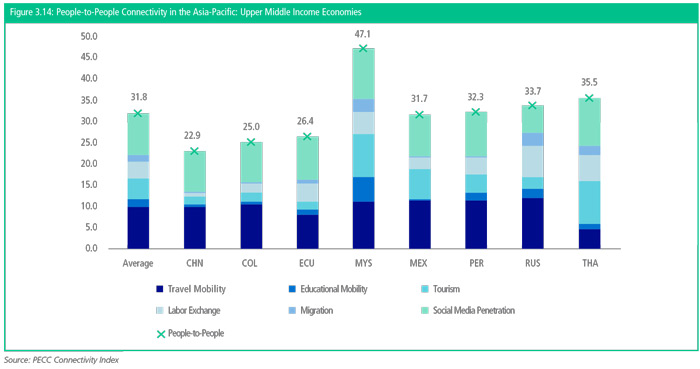
The results for people-to-people connectivity for the upper middle-income group ranged from Malaysia at 47.1 to China at 22.9. Malaysia outperforms the average of this cohort in all the sub-indices but especially in educational mobility, migration and tourism. While China on the other hand underperforms the group across all the sub-indices but especially in terms of migration and labor exchange. Some explanation and a caveat is required, the proxy indicators included in these sub-indices are normalized by population (migrant stock as a percent of population) and labor exchange is measured by two-way remittances as a percentage of GDP. These tend to result in lower index values for economies with large populations and/or economies.
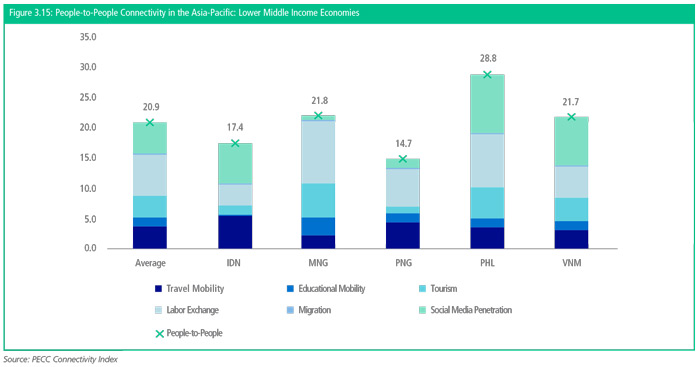
The results for people-to-people connectivity for the lower middleincome group ranged from the Philippines at 28.8 and Papua New Guinea at 14.7. The Philippines outperformed its peers on two of the sub-indices in particular: social media penetration and tourism but was lower than the cohort average on travel mobility and migration, its score was higher than some members of the upper middle income group economies.
Conclusions
The objective of constructing this index was to provide an objective basis for assessing the state of connectivity in the Asia-Pacific. The task was formidable, not only are there many definitions of what constitutes connectivity but the very breadth of the issues that it encapsulates and the surprising lack of consistent and comparable data made the work a challenge. The purpose was to make a real contribution to the ongoing work in the region on connectivity. The work leads to several conclusions.
The first is the importance of the hypothesis that was reached after an extensive literature review and discussion among task force members: that the three pillars are self-reinforcing and inter-related.
The second is that no one size fits all – no matter how one looks at the data – economies in the region for a variety of reasons are pursuing different models and approaches. As this index looks at a single point in time this effort will need to be repeated to measure progress.
The third, based on the index findings, is the priority areas for work. Within each pillar the following were the areas that required the most work collectively:
- Physical
o Transport
o Infrastructure - Institutional
o Trade Facilitation
o Intellectual Property Receipts - People to People
o Educational Mobility
o Labor Exchange
There is no reason why these should apply to all regional economies. These are simply the lessons the index tells. Each economy can simply look at whether these apply in its own specific circumstances but the underlying point is that while each economy is moving towards greater levels of connectivity, APEC can provide a useful platform for collective action.
A last comment relates to the construction of the index itself. Considerable thought and discussion amongst a group of experts went into the selection of indicators and identification of the subindices under each pillar. This is one way to measure connectivity. Looking further ahead to a priority for APEC and many of its members, we need to look atthe digital economy. Were we right to have ICT as a sub-index under the physical pillar? Should each of its component indicators have had equal weight given the trends we see towards the importance of broadband access? Should the indicator on the mobility of digital transactions that was included under the institutional pillar have been included under a renamed ‘digital sub-index’? What else might have been included?
These are not issues just for economists and statisticians but critical to helping policy-makers get a sense of priority for the key issues– improving people’s quality of life and increasing opportunities. Free and open trade are necessary but not sufficient conditions for this. Improved connectivity – whether through more transparent and faster customs services, reduced congestion on roads, or any one of the other measured indices, are a big part of that.