Chapter 1 - Prospects for Growth in the Asia-Pacific Region*
*Contributed by Eduardo Pedrosa, Secretary General of PECC and Coordinator of the State of the Region report.
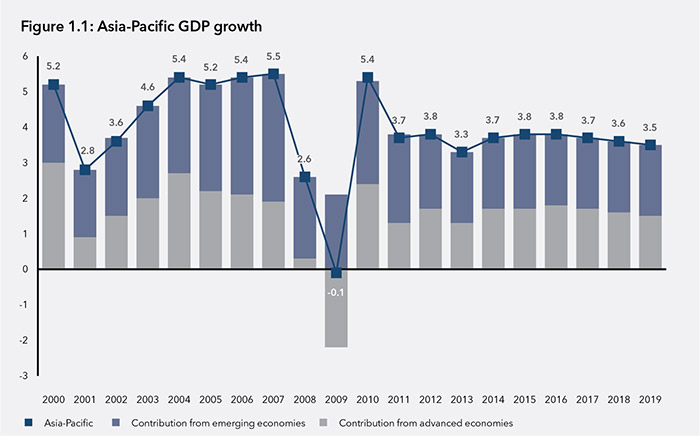
The Asia-Pacific region is forecast to grow at around 3.8 percent over the next two years before moderating to around 3.5 percent in 2018 – 2019. While far from the heady rates of above 5 percent growth during the pre-Global Economic Crisis period it represents a steady if unremarkable recovery from the depths of dark days of the 2008 – 2009.
The challenge ahead is whether the region can do better and reach the growth rates it had during the pre-Global Financial Crisis (GFC) period. While growth has become more balanced in the region, it has also become slower. Moreover, some of the growth remains supported by extraordinary stimulus that cannot be sustained over the medium term.
Future Drivers of Growth
Regional economies will need to identify alternative growth engines if they are to achieve the objective of sustainable high quality growth. In addition to the challenge of weak demand from traditional markets, many of the region’s emerging economies have reached middle-income status and as such can no longer rely on their low labor cost advantage to drive growth. The APEC Growth Strategy set out in 2010 provides a framework for high quality growth but implementation is lacking.
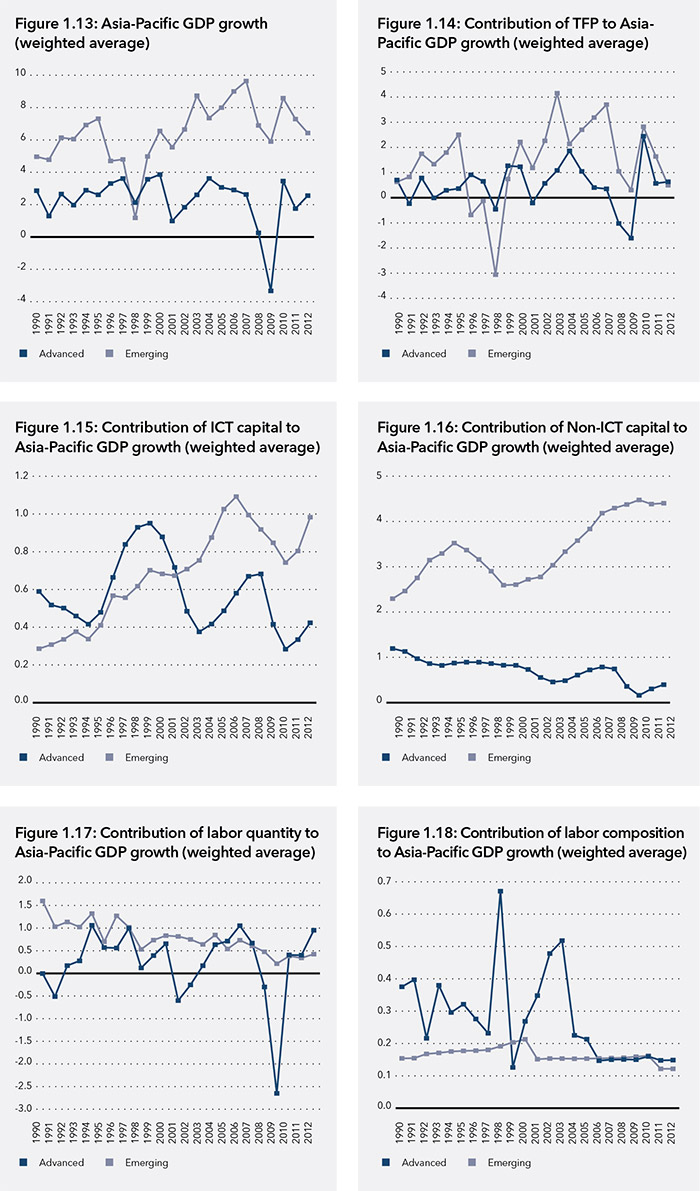
Over the past two decades, economic growth for the emerging economies of the region has been overly reliant on one factor of production – investment in non-ICT capital which accounted for, on average 61 percent of GDP growth (compared to 40 percent for the region’s advanced economies). These numbers are only slightly distorted by the weight of China among the region’s emerging economies and the huge amount of investment that took place after the crisis.
Advanced economy growth, on the other hand, has benefitted much more from investment in ICT, 33 percent (compared to 12 percent for emerging economies). Advanced economies in the region also had a much bigger contribution to growth from the composition of their labor force, i.e. skills (14 compared to 3 percent).
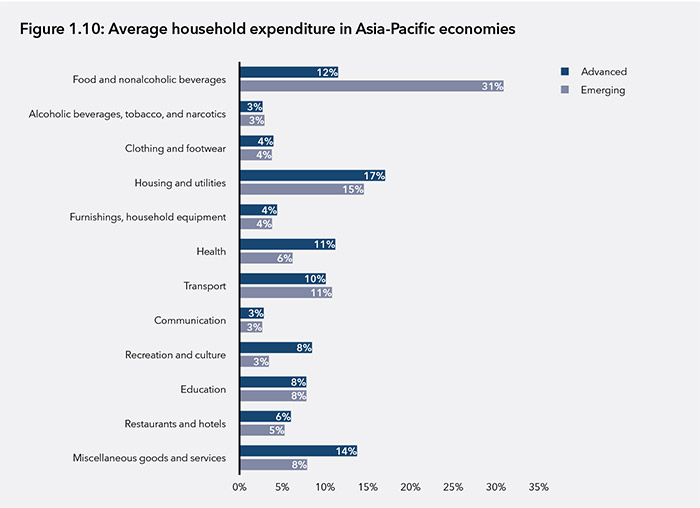
The region’s growth could also receive a boost from increased middle-class consumption. On average, food still accounts for around 31 percent of consumption in the region’s emerging economies, compared to 12 percent in advanced economies. Another category with a significant differential is expenditure on healthcare.
Expenditure on miscellaneous goods and services such as hairdressing salons and personal grooming; appliances and products for personal care; jewelry and watches, and insurance accounts for around 14 percent of consumption expenditure in high income economies while it is just 8 percent in the region’s emerging economies.
It is likely that the emerging middle class in the Asia- Pacific will become the most important source of global demand in the intermediate future. Much of this demand will be for products and services that are currently produced in these economies but for export to end-consumers in advanced economies. This consumption could play the same role that exports to advanced economies have played in the previous stage of development in the region’s emerging economies.
However, middle class consumption in emerging Asia-Pacific economies – whether it is of education, healthcare or consumer goods faces particular and almost unique challenges as well as opportunities. The region is home to the most populated economies in the world. If all APEC economies were to have same number of cars as their counterparts in OECD economies an additional 910 million cars would be on the road and if all APEC citizens spent the same on healthcare as OECD there would be an additional US$7.5 trillion spent on healthcare. The resource implications are enormous.
Overcoming both of these challenges will require changes in both business models as well as the production process – especially if this is to include the consumers at the bottom of the pyramid. The conclusion from this is that there is potential for emerging economies of the region to continue to grow at high rates through investing more in ICT services and the skills of their people – in other words improving the environment for innovation.
Changing Balance between Emerging and Advanced Economies?
While the flat recovery is at first glance unexciting what is remarkable is where the growth is coming from – while much attention is paid to emerging markets, BRICS and other notable acronyms, advanced economies in the region look to have regained their footing and now contribute almost as much to regional growth as middle income economies.
Prior to the 2008-2009 crisis, the region’s emerging economies were contributing up to 60 percent of regional growth with the exception of the heady days of the dot com bubble. Over the next few years at least, the expectation is that emerging economies of the region will account for closer to 54 percent of regional growth.
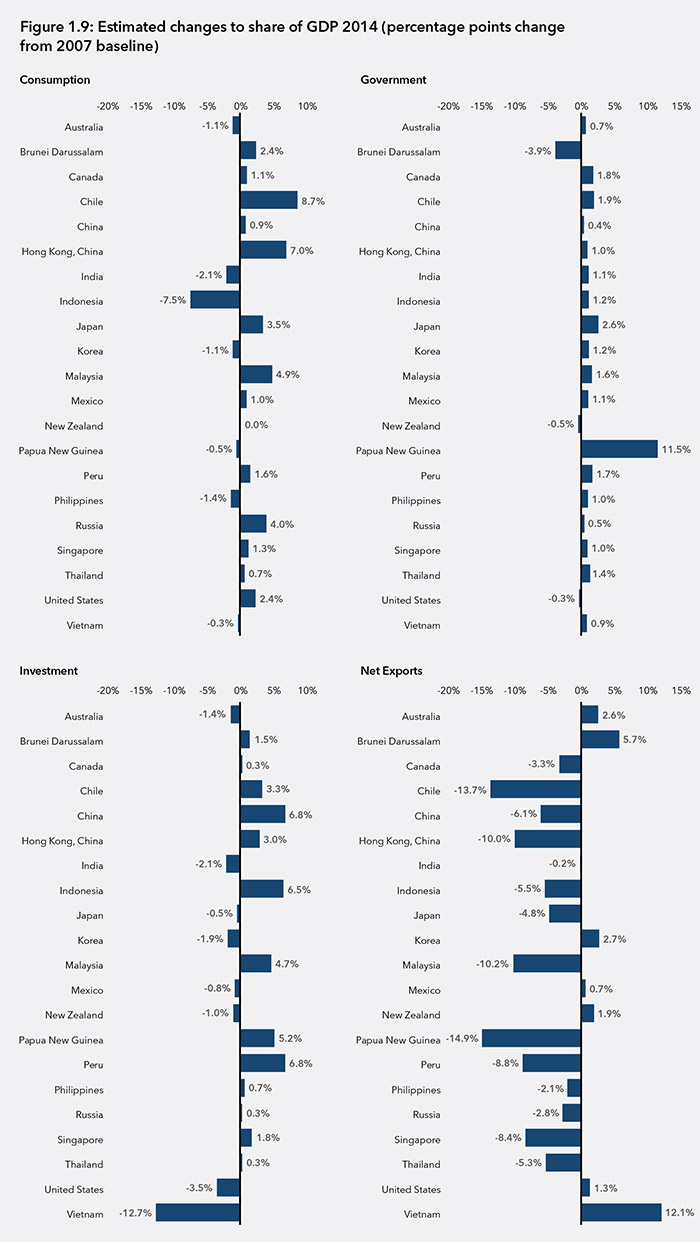
Two big resource economies are forecast to show the biggest swings in growth between 2014 and 2015 – Papua New Guinea and Mongolia. Papua New Guinea is forecast to grow at 21.6 percent in 2015 compared to 6.0 percent in 2014, and Mongolia at 7.7 percent down from 13.0 percent. For Papua New Guinea the expectation is that growth will come from a surge in consumption as well as an improvement in net exports. For Mongolia, the slowdown will come from decreased investment – after several years of very high gross capital formation as well as a 3.3 percentage point decrease in net exports.
Growth in most regional economies is expected to improve over the next year by as much as 1 percentage point; exceptions to this general trend are: Colombia, Malaysia, New Zealand, China, Japan, Ecuador, and Brunei Darussalam.
Among the region’s three largest economies, China’s growth is expected to slow moderately from 7.5 to 7.3 percent, Japan is expected to also slow from 1.4 to 1.0 percent while the US is expected to improve from 2.8 to 3.0 percent.
The three largest economies of the region account for 69 percent of total output in the Asia-Pacific so whatever happens in each is likely to have a large impact on their neighbors. Estimates vary on the impact of changes in growth in the region’s economies. In the case of China, the IMF estimates that a 1 percent slowdown may lower GDP growth in the median Asian economy by about 0.3 percentage points after a year, compared with 0.15 for non-Asian economies. The correlation is even higher for the ASEAN-5 economies. In the case of the US, IMF research also suggests that the magnitude of second order policy responses have an impact on the direction of the correlation; for example, a positive growth shock for the US that came with tighter monetary policy would be beneficial. However, if the 1 percent growth shock came with an increase in 100 basis point increase to long-term government bonds it would generate a moderate slowdown in most Asian economies. For example, in the case of ASEAN-5 it would shave 0.85 percentage points off growth, in China 0.79, Japan 0.86, and Korea the most at 0.98.
United States
While the relative weight of the US economy in the region has declined over the past quarter of a century, it still accounts for 37 percent of the region’s total output. Growth in the US economy is expected to improve over the next 12 months, from 2.8 to 3.0 percent. In terms of rebalancing, the US economy continues to be driven largely by consumption which has been adding roughly 1.6 percentage points to US GDP in recent years, some 0.5 percentage off the highs in the run up to the crisis. What has changed of some significance is that government expenditure has been reducing total output as a result of the fiscal austerity measures put in place to try to get the US budget under control. Also of importance is that net exports are now much less of a drag on the economy than they used to be (see Box 1: The US Economy).
Box 1: The US Economy
The performance of and outlook for the US economy look more solid than it has at any time since the beginning of the Global Financial Crisis in 2008, but there are continued weak spots and doubts about the underlying strength of the expansion. GNP growth for calendar year 2014 will likely be about 2 percent, a rate that may only slightly rise in 2015. If measured against the APEC Leaders goal of balanced, sustainable, and inclusive growth, despite the improved performance of the American economy, many challenges remain.
On the positive side of the ledger, recent labor force growth has been more robust than at any time in the past five years. The total size of the labor force has finally exceeded pre-2008 crisis levels and unemployment has dropped from nearly 10 percent in 2009 to below 6.5 percent. This has stimulated some growth in consumer spending and business investment, although both groups remain cautious. Despite reduced unemployment, inflation appears to be in check, with core inflation well below the Federal Reserve’s 2 percent target and little inflationary expectations. The substantial growth of U.S. energy production has reduced American dependence on vulnerability on external petroleum supplies and contained growth of the trade deficit. While oil prices are affected by international market supply insecurities, domestic gas prices in the United States have plummeted to the benefit of consumers and the international competitiveness of domestic downstream industries. At the same time, the negative forces affecting the economic performance – notably the weak housing residential sector and the fiscal drag as a result of reduced Federal and local government expenditure – have abated.
Given this positive picture, the Federal Reserve is expected to continue to terminate its already tapered asset purchasing program as scheduled. However, because of the still cloudy outlook and lack of inflationary pressures, the Fed may be reluctant to proactively increase interest rates, particularly if overseas growth remains weaker than expected and the dollar is strong. While some believe that growing business confidence will cause the economy to pick up steam by 2016 and that the Federal should shift its attention to potential inflation issues, others believe the economy is still performing below potential, that growth is likely to remain below historical recovery rates and even that current, slow 4-year expansion could end prematurely. Several factors will determine the future.
Labor and Productivity: Despite robust job growth in 2014, labor participation rate continues to decline and the quality of the new jobs is debated. Structural changes in the labor market including the aging of the labor forces and the continued shift toward service sector jobs complicate assessment of what the highest sustainable employment level might be, a goal of U.S. monetary policy. The Federal Open Market Committee finds that despite improvement in market conditions, “underutilization of labor resources still remains significant.” Moreover, labor productivity is growing only slowly in the absence of any major new technological driver.
Housing: The performance of the housing sector remains below historical expectations, despite apparent pent-up demand. While there have been a general rise in sales of existing units and new housing starts despite variable monthly figures, this sector has not fully recovered. A spike in mortgage interest rates in 2013, continued tightness of credit, and college loan indebtedness of many younger families may account for this and dampen future prospects.
Exports: With wage rates rising abroad relative to domestic rates, the U.S. had hoped for a large boost in exports over time, particularly in the manufacturing sector. But while total exports are at an all-time high, they have been rising only slowly (and far below President Obama’s 2010 fiveyear, export-doubling goal). There has hardly been any rise at all for manufactured goods since 2011. Increased domestic petroleum production has been the major factor in holding the growth of U.S. trade deficit in check, not rising exports. Crude oil and petroleum products imports have decreased from about 5 billion barrels yearly in 2005-07 to 3.6 billion barrels in 2013. Weak economic performance in Europe is one factor in slow U.S. export growth, but Asian markets are also disappointing. In the case of Korea, for example, U.S. exports declined despite the conclusion of a free trade agreement, increasing the future political difficulties in selling such agreements. Without more rapid export growth and with improved domestic economic performance, the U.S. trade balance, now running at about $60 billion a month, will probably rise moderately.
Fiscal policy: It has been estimated the reductions in government expenditure shaved as much as 1.5 percent from GNP growth in 2013. The figures for 2014 and 2015 will be much lower with only a moderate fiscal drag. The Federal budget deficit has declined dramatically, but with Federal pension and health care costs rising and differing fundamental views about the role of government in the economy, the two political parties remain deadlocked on many budget issues. There is little to no expectation of an expansionary fiscal policy.
Widening Income Gap: President Obama argues that the widening gap is a more significant economic change than the Federal budget deficit. Data suggests that the richest tenth of Americans own close to half its wealth, a figure that has been rising for a half century. How to provide a greater measure of equality of opportunity in an era in which there are reduced returns to labor, as opposed to capital, a more skewed return of benefits to labor, and strong resistance to government programs that redistribute income remains a fundamental dilemma.
China
China’s growth is forecast to slow moderately from 7.5 to 7.3 percent, largely as a result of a forecasted decline in gross capital formation – much in line with the plan to wean the economy off its reliance on stimulus in recent years. In terms of rebalancing the economy, it is clear that net exports have declined in importance to the economy. However, it remains to be seen whether this is a result of a decline in demand from external markets or a real change in the structure of the economy. Over the longer term much work needs to be done to increase consumption in China which accounts for just 37 percent of aggregate demand and has been decreasing in importance as a result of the massive increase in investment in response to the crisis.
Over the medium term the forecast suggests that the consumption share of GDP will increase by about 0.3 percentage points a year over the next 5 years with the converse happening to investment.
Box 2: China’s Economy for 2014: Steady and Sound Growth with Reform and Innovation
Contributed by CNCPEC
Overall stability to date
In the first half of the year, the Chinese economy registered 7.4 percent growth. The CPI rise was kept at 2.3 percent. Despite economic slowdown, between January and August, the surveyed unemployment rate was kept at around 5 percent in 31 big and medium-sized cities. More than 9.7 million urban jobs were created, which is over one hundred thousand more than the same period last year. This suggests that the economy is running within the reasonable range.
The structure of the economy is further improved; in terms of economic drivers, consumption contributed 54.4 percent and investment in fixed assets contributed 48.5 percent, while trade contributed – 2.9 percent.
In the first half of the year, the tertiary industry increased by 8 percent, accounting for 46.6 percent of GDP, which is 0.7 percent and 0.6 percent respectively over the secondary industry. The tertiary industry continued to outperform the secondary industry in terms of growth rate and share of GDP, and is a leading sector of the economy.
The reform taken thus far has greatly contributed to the achievements. The reform of the administrative review and approval system has lowered the threshold for starting businesses and removed restrictions on them. Between January and August, the amount of newly registered market entities was more than eight million, and from March to August, the number of newly registered businesses grew by 61 percent over the previous year. The reforms to investment financing, taxation and logistics systems spurred the service sector and other emerging industries. In the first half of the year, new businesses and new business models such as logistics, express delivery and e-commerce all developed fast. This plays an important role in spurring employment.
The government has successfully refrained from using extensive financial and monetary stimulus measures to maintain the targeted economic growth rate. Instead, favorable policies and liquidity were directed to specific sectors with precision to stimulate vitality while maintaining market stability.
Outlook for the year
The economy is still faced with downward pressure and many international economic institutions have lowered their outlook of China’s economic growth. Some economic institutions call for extensive stimulus policy. However, the government remains level-headed against these fluctuations, taking them as inevitable and expectable given the volatility of the global economy and the highbase of the relevant figures of the same period of last year.
The actual economic growth rate is forecast to be within the proper range; that is, slightly higher or lower than the 7.5 percent target. The government will go on with the range-based policy package and will not succumb to the fluctuations of specific economic indicators and make a policy overhaul. The tolerance to the fluctuations is based on the confidence of the resilience of China’s economy, the potential and ample space for growth and a full range of tools of macro-control at disposal, and a judgment that the fluctuations are small ripples.
The favorable conditions for the optimistic outlook include the generally stable employment and prices, the ever bettered economic structure, the fairly robust growth of consumption, the good development of the tertiary industry, increasing external demand with the recovery of the major economies including the United States, Europe and Japan. Even the industrial indicators such as Purchasing Managers’ Index (PMI), Producer Price Index (PPI) and industrial electricity consumption will give better performance in the coming months. Real estate will be in the best season of the year. Investment in railway and urbanization is well in position.
According to an outlook of the National Reform and Development Commission, the third quarter will see a growth of 7.3-7.4 percent, followed by a 7.5 percent of growth in the fourth quarter. This will make the annual goal of economic growth achievable.
However, well-targeted policies are in need. More support in taxation and finance should be directed to the small, medium and micro-enterprises, in addition to the continued efforts to create a favorable environment for the small, medium, and micro enterprises (SMMEs). The balance of monetary and credit supply and demand should be maintained to secure adequate liquidity. The momentum of reform, innovation and structural readjustment should be retained.
Innovation and strong reform instead of strong stimulus
China is now in a ‘new normal’ state with a shift from high economic growth to medium-high growth, a painstaking task to readjust the economic structure, and an imperative to digest the sideeffects of the stimulus package employed to fight the 2008-2009 global financial crisis.
In this stage, the government has no option but to coordinate the efforts to stabilize growth, promote reform, readjust the structure, improve people’s livelihoods and prevent risks.
The innovative approach of targeted macro-control on the basis of range-based macro-control, structural reform and readjustments, reforms in key areas of systemic importance has proved effective and will be carried on in the foreseeable period of time. Innovation and promotion of institutional innovation as well as innovation in science and technology is the “golden key” to tackle the deep-seated problems. It is commonly accepted that the traditional track of investment-driven growth and reliance on real estate should be avoided.
The government will continue streamlining administration and delegating powers, and clearly define the borders of the government and market. In this way, the vitality of the market will be further released with a level playing ground set for the market players. In order to boost the service sector, the pilot programs to transform business tax to value added tax will be expanded. In-depth reforms will be practiced in fiscal and financial areas to upgrade the budgetary management system and develop a multi-tiered capital market. State-owned enterprises will be reformed and mixed ownership economy will be promoted. Supply of public goods will be increased to generate effective demand. More fiscal and financial resources will be channeled to the real economy, and emerging industries and businesses, specially favoring rural areas, agriculture and farmers, microbusinesses, and the service sector.
Japan
Economic growth in Japan is set to slow down from 1.4 to 1.0 percent over the next year and then to 0.7 percent in 2016. In 2015, this is expected due to a slowdown in consumption growth and investment. While consumption is expected to bounce back in 2016, the forecast is for net exports to be a greater drag on the economy reducing growth by 0.25 percentage points. Beyond the next two years, the concern for Japan is in the external sector with exports unable to grow as fast as imports.
Box 3: Japan: The Progress of Abenomics
Contributed by JANCPEC
Japanese Prime Minister Shinzo Abe`s economic reform strategy, popularly known as “Abenomics,” was set in motion after his re-election in December 2012. Abenomics’ “three arrows” consist of aggressive monetary easing with an inflation target of 2 percent, flexible fiscal policy and a growth strategy, all aimed at pulling Japan`s economy out of prolonged deflation and stagnation and achieving sustainable economic growth. The first two arrows have been boldly fired with positive consequences for Japan`s economy so far, with the third arrow launched in June 2013 and a revised growth strategy announced in June 2014.
The effects of the QQE and stimulus package
The first arrow, “qualitative and quantitative easing (QQE)” as a means to achieve an inflation target of 2 percent, was launched in April 2013 by the Bank of Japan (BOJ) under the bank`s governor, Haruhiko Kuroda. The BOJ intends to nearly double its balance sheet by purchasing Japanese Government Bonds of all maturities as well as other types of funds and equity over a period of about two years. Even prior to its actual implementation, the QQE remarkably altered investors’ expectations of the markets, resulting in a depreciation of the yen and a sharp increase in stock prices. Between November 2012 and April 2014, the yen depreciated by about 25 percent against the US dollar and stock prices rose by about 50 percent. A lower yen is favorable for Japanese exporting companies, in particular those in the manufacturing industry, and higher stock prices created a wealth effect that boosted private consumption.
The second arrow is flexible fiscal policy. The Japanese government approved a 13.1 trillion yen stimulus package in January 2013, and an additional 5.5 trillion yen was approved in December 2013. The budgets for these stimulus packages were earmarked to assist recovery in areas hit by the 2011 earthquake/tsunami and build disaster-resilient infrastructure, to enhance business competitiveness by promoting private investment and small-and-medium enterprises, and to support local economies, including the agricultural and fishery industries, and increase the labor participation rates for women and youth. The government set targets to facilitate executing these stimulus budgets as planned, and about 70 percent of the FY2013 budgets had been executed as of the end of June 2014.
In 2013, Japan saw encouraging figures in numerous macroeconomic indicators. The real GDP growth rate was 2.3 percent, indicating that overall economic performance improved notably from the previous year. The main drivers of growth were private consumption, capital investment, government expenditure and exports. The high growth rate cannot be solely attributed to domestic policies, however, and credit is due also to the steady recovery of the world economy that has improved the overall economic situation. Nevertheless, one can observe that the QQE and fiscal policy smoothly and rightly facilitated the process of achieving Japan`s high growth rate.
As the economy was stimulated, the employment situation also improved favorably. The latest unemployment rate is 3.7 percent (June 2014), returning to the level prior to the GFC. Set against this backdrop, it has become apparent recently that the labor shortage associated with a shrinking working-age population is becoming acute in various industries, especially the construction and service sectors. This is leading to an uptrend in workers’ wages, concurrent with a degree of pressure from Prime Minister Abe’s call for salary increases. This year`s spring labor offensive achieved a wage increase of 2.2 percent, and workers will benefit from bigger bonuses as well. In spite of the nominal wage increase, however, the rise in the Consumer Price Index (CPI) and the impact of the consumption tax hike mean the growth of real wages was actually negative. Continuous wage increases thus still remain a critical challenge.
As the BOJ targets an inflation rate of 2 percent, there are signs that the prolonged deflationary trend in the CPI has been broken. The CPI rose by an average of around 1.5 percent during the first half of this year, excluding the effect of the consumption tax rise. While this was largely driven by higher energy and commodity prices associated with the weaker yen, there has also been a slight natural uptrend in other commodity prices.
This stronger domestic economic growth is reflected in Japan’s outward foreign direct investment (FDI). The level of net FDI has been rebounding since 2011, and in 2013 it returned to its pre-GFC level. Since Abenomics was instituted, the most striking growth has been driven by investment by financial institutions expanding their business abroad. Japanese FDI into Asia, the US and the EU has steadily increased; FDI into ASEAN has seen particularly remarkable growth.
The QQE and fiscal policy are functioning well to date, though there are downsides to these shortterm- oriented policies. The QQE aims to boost inflation, but given that Japan`s gross public debt is already over 200 percent of the GDP, there is a potentially higher risk of exacerbating long-term economic problems with high inflation. The interest rate for Japan 10-year Government Bonds is currently stable at around 0.5 percent, but this is a generic rate resulting from BOJ intervention. Therefore, the fundamental challenge for the first and second arrows is striking a balance on fiscal soundness. To pave the way for fiscal consolidation, Japan increased its consumption tax rate from 5 to 8 percent in April 2014 and plans to raise it to 10 percent in 2015. The Japanese government’s long-term target is to achieve a primary balance surplus by 2020. Likewise, continuous efforts towards fiscal consolidation are necessary.
The third arrow: Structural reform policy
To complement the first and second arrows, the third arrow – structural reform – is a medium – and long-run economic strategy to achieve sustainable economic growth. The revised growth strategy announced in June 2014 is focused on four areas: boosting private investment, encouraging the labor participation of women, youth and the elderly, creating new markets and promoting global economic integration.
Among these targets, boosting private investment, including inward FDI, is of critical importance. One of the highlighted policies designed to promote investment is cutting corporate taxes from the current 35 percent or so to below 30 percent in the next few years in emulation of Germany and the UK, while broadening the tax base to maintain corporate tax revenue. The government has also established National Strategic Special Zones where business-friendly regulatory arrangements apply. Domestically, it is promoting corporate governance reforms such as requiring companies to include external directors on their management boards and introducing a Japanese version of the “Stewardship Code” for institutional investors. In addition, the Government Pension Investment Fund, with $1.2 trillion in assets, will be switching some of its funds into the JPX-Nikkei 400 and J-REIT.
Another key issue is increasing labor participation to counterbalance the decline in the working-age population. Prime Minister Abe has devised a policy he labels “womenomics” to encourage more women to participate in labor markets. It aims to increase the participation rate of females aged 25-44 from 68 percent in 2012 to 73 percent in 2020, and requests that companies appoint women at leadership positions. As enabling factors, “womenomics” policies seek regulatory reform and greater support for building child-care facilities. The government has also introduced a new policy to attract foreign workers.
In addition to these domestic-oriented policies, integration with global markets, in particular those in the fastest-growing Asian economies, is imperative. In this regard, Japan is involved in several ongoing negotiations for such important free trade agreements (FTAs) as the Trans-Pacific Partnership (TPP), the Regional Comprehensive Economic Partnership (RCEP) and the EU-Japan Free Trade Agreement. With the WTO Doha Round negotiations at an impasse, these mega-regional trade negotiations, once concluded, will prove of great significance in promoting international trade and investment. In addition, TPP aims for a high level of liberalization covering 21 areas – investment, service trade, intellectual property and competition policy to name a few – and reduced behind-theborder barriers. It will work in conjunction with the third arrow of Abenomics to expedite the process of Japan’s domestic structural reform and liberalization.
India
India, although not a member of PECC or APEC, is part of the East Asia Summit grouping and a key player in the ongoing negotiations in the RCEP trade agreement. As shown by the results in PECC’s annual survey, there is a strong view that India should, at some time, become part of APEC. Over the next 12 months, India’s growth is expected to improve by a full percentage point, from 5.4 to 6.4 percent growth. The improvement will be balanced across consumption, investment as well as net exports, with government expenditure’s contribution remaining much the same as it was in 2014. The election of a new government which has been courted by both Beijing and Tokyo augurs well for the engagement of India in the region
Box 4: India: Middle Class Strikes Back
Contributed by: Amitendu Palit (Amitendu Palit is Senior Research Fellow and Programme Lead (Trade and Economics) in the Institute of South Asian Studies in the National University of Singapore. Usual disclaimers apply.)
Within seven years of its launch in 2007, Flipkart, now India’s largest e-commerce market platform, sells more than 15 million products cutting across various categories of consumer requirements including books and lifestyle items. Its last round of fundraising fetched US$1 billion in what was one of the largest fund mobilizations done globally by e-commerce companies (Flipkart Raises USD One Billion in Fresh Capital; One of the Largest Funding Rounds in E-commerce Globally’, 29 July, 2014, Bangalore; http://www.flipkart.com/s/press). With around 22 million registered users and 5 million shipments per month, Flipkart is poised to achieve amazing scales in online retailing and e-commerce.
The Flipkart story is an example of how business start-ups in India can experience rapid growth in a short time through innovative supply responses to large consumer demand. India’s fast expanding middle class in terms of people earning between US$10 and US$100 per day is estimated to be at around 200 million by 2020 and almost half a billion by 2030 (China and India: tomorrow’s middle classes’, Ernst & Young; http://www.ey.com/GL/en/Issues/Driving-growth/Middle-class-growthin- emerging-markets---China-and-Indiatomorrow-s-middleclasses). Rising personal disposable incomes would continue to positively influence propensities to consume. Catering to the diverse needs of the hungry middle class would require smart and innovative supply responses, such as those introduced by Flipkart by integrating product delivery and shipments with advancements in Internet use and mobile technology. With the country expected to have half a billion Internet users by 2020, and the current telecom subscriber base close to a billion, the growth of the middle class and its online consumption habits can make India’s e-commerce one of the largest global industries.
The size and strength of India’s market has been well known, particularly since the ‘BRICS’ was coined at the beginning of the century, and India widely tipped to become the biggest success among the emerging markets after China. India responded well to expectations by recording annual average GDP growth of 8.5 percent for most of the last decade, accompanied by corresponding growth of 35.5 percent in investments. Since then, however, investment growth has declined, pulling down GDP growth, too. Nonetheless, with a 5.6 percent growth rate in GDP in 2013, India still grew higher than the Asia-Pacific average (3.5 percent) and was on par with Southeast Asia (5.5 percent).
More than the growth deceleration, the ‘India story’ was hit badly by the inability of the authorities to implement necessary structural reforms in various sectors. This resulted in the rather inglorious ‘policy paralysis’ coming to characterize the previous government in India. Symptoms of weakness in external and domestic macroeconomic fundamentals visible through widening of the current account and fiscal gaps led to cynical reactions from credit rating agencies and jerky pullouts by short-term institutional investors. Careful management over the last one and a half years has restored macroeconomic health and investor confidence. Consumer spending has also picked up and the upcoming Deepavali (Festival of Lights) is expected to shine brighter as the capital market scales new highs.
Details are often missed for large economies like India that hide surprises in layers. Copious discussions on India’s problems in allowing majority foreign equity in multi-brand domestic retail trade, particularly the incumbent BJP (Bharatiya Janata Party) government’s aversion, has overlooked the open invite to foreign investors in wholesale trading and B2B (business-tobusiness) e-commerce. Given the chunks of the domestic market that can be tapped through these functions, it is hardly surprising that Amazon has picked India as its first non-US market for launching an online portal for wholesale trade. By integrating wholesale trading through online B2B functions, Amazon is following in the footsteps of Walmart and Metro that are already into wholesale trading in India (Amazon plans portal for wholesale merchants in India, first country outside the US’, The Economic Times, 12 September 2014; http://economictimes.indiatimes.com/industry/services/retail/amazon-plansportal- for-wholesalemerchants-in-india-firstcountry-outside-the-us/articleshow/42296996.cms). It is also taking on existing e-commerce retail platforms and pre-empting future entries of larger players like Alibaba in a market that is back on the upward trajectory of a new growth crest driven by an expanding middle class.
The new government in India seems keen on encouraging consumption by using technology in an enabling fashion. The ambitious financial inclusion program Jan Dhan Yojana is aiming to bring 75 million poor households under the formal banking system by issuing new bank accounts backed by life insurance and accident insurance covers. The scheme would expedite direct cash transfer of subsidies in the long run through identification of beneficiaries by their unique identification, or Aadhar, numbers. Putting money directly in the hands of people by eliminating intermediaries is the cleanest and surest way of abetting consumption in an inclusive manner. Aggregate consumption demand in India should significantly augment from these enabling measures that would positively influence spending at the lower income segments.
Indeed, if ongoing efforts to change labor laws by introducing greater flexibilities in hiring and firing practices succeed, then new jobs in manufacturing and labor-intensive services should increase rapidly. The job creation would act as a fresh multiplier for the middle class by adding new members at the bottom end. Consumption demand would increase, as would the demand for innovative ‘budget’ products.
Regional producers have already spotted the opportunity. The Chinese ‘Apple’- equivalent, Xiaomi is planning to open a new R&D facility in Bangalore for designing hand phones incorporating features specific to the Indian market. And why would it not if 40,000 of its Redmi 1S phones priced at around US$100 are booked on the Flipkart in 4 seconds? (Amitendu Palit, ‘The Chinese Apple’, The Financial Express, 9 September 2014; http://m.financialexpress.com/news/columnsthe-chinese-apple--canvassingchina/1287070)
Innovative products and business practices planted in the fascinating dynamics of an expanding middle-income class can clearly take the Indian market to where other markets have hardly gone.
Southeast Asia
Growth for Southeast Asia as represented by the ASEAN-10 economies is set to accelerate over the next 2-3 years from 4.9 percent in 2014 to 5.2 percent in 2015. ASEAN is home to some of the most open economies in the world, with trade accounting for over 100 percent of GDP in Malaysia and Singapore, making them vulnerable to downturns in the global economy. Nonetheless, they have shown remarkable resilience in their ability to bounce back quickly from exogenous shocks.
Over the past ten years, the balance of aggregate demand has seen significant shifts, some in response to the changes wrought by changes in the external environment, others due to the increasing levels of development in the region.
In the case of Indonesia, there has been a significant shift in the balance of aggregate demand; in 2004 investment expenditure accounted for 22 percent of aggregate demand, in 2014 it is estimated to account for 31 percent. Some of this is a return to the status quo ex ante; investment in Indonesia had dropped sharply after the Asian Financial Crisis and indeed, levels are still below what are needed to remove some of the bottlenecks in the economy now apparent.
In the case of Malaysia, net exports have dropped from 20 percent of aggregate demand to 10 percent, with domestic demand, i.e. consumption and investment taking up the slack. The composition of demand in the Philippines has changed the least among the three examples shown here; net exports are less of a drag on the economy rising from negative 5 percent to negative 2 percent while consumption’s share of demand dropped from 75 percent to 72 percent.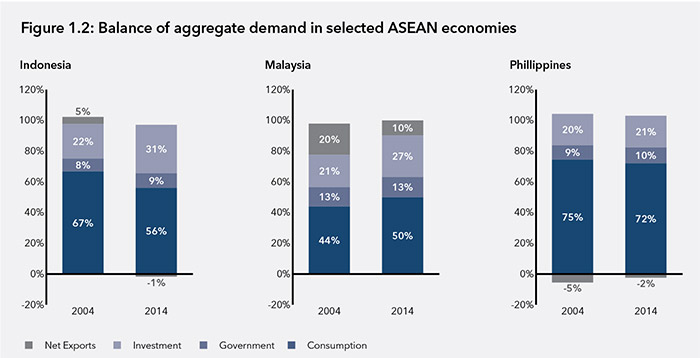
The forecast for GDP growth in Thailand in 2015 is 3.8 percent, a significant improvement over this year at 2.5 percent where political instability and natural disasters have not helped it deal with relatively weak external demand. Next year, 2015, will be a critical year for the ASEAN integration experiment with the deadline for the completion of its Economic Community looming at the end of the year. However, challenges lie ahead if it is to maintain its dynamism over the medium to long term.
Box 5: ASEAN Economy Post-2015: Issues, Challenges, Policies
Contributed by: Giovanni Capannelli, Asian Development Bank Institute, Tokyo
By the end of 2015, ASEAN will be launching the ASEAN Economic Community (AEC), which is expected to enhance its members’ GDP growth through productivity and efficiency gains generated by domestic structural reforms and economic integration. A proper combination of domestic reforms and initiatives for closer integration that complement and reinforce one another are indeed needed to promote the region’s equitable and inclusive development, strengthen macroeconomic stability, enhance competitiveness and innovation, as well as protect the environment and manage natural resources.
A recent study by the Asian Development Bank Institute (ADBI) entitled, “ASEAN 2030—Toward a Borderless Economic Community” identified the region’s long-term economic aspirations and challenges, offering a wide range of recommendations to policymakers. The findings suggest that ASEAN can enter a high-growth scenario, during the two decades from 2010 to 2030, tripling average real per capita income while raising quality of life to average levels enjoyed today by members of the Organization for Economic Cooperation and Development (OECD). Average incomes are expected to grow faster in the less developed ASEAN economies of Cambodia, Laos, Myanmar, and Vietnam (CLMV) than in the more advanced ASEAN-6, contributing to a narrowing of intraregional development gaps. But if ASEAN members fail to introduce the appropriate policy mix combining structural reforms with initiatives for closer economic integration, they may enter a low-growth path that would lead to an average GDP expansion of no more than 3 percent per year, as economies fall into the middle income trap and are unable to manage emerging issues such as natural disasters, climate change, territorial disputes, and internal political tensions.
ASEAN economies remain considerably diverse, marked by huge development gaps across and within members. Yet, they are exposed to common risks and challenges in facing rapid transformations in the global environment and they increasingly realize the importance of shaping common economic growth strategies as they feel competitive pressures arising from China, India, and other emerging economies in Asia as well as other parts of the world. And while it is unlikely that by 2015 the AEC will be fully in place (even the EU common market is still quite incomplete), the study suggests that ASEAN’s long-term growth strategy should be to deepen the AEC into a truly borderless economic community by further lowering tariff and especially non-tariff barriers, creating more effective systems for resource pooling, and introducing innovative structures to manage labor and capital markets—as they become progressively liberalized. Overall, closer integration requires stronger intraregional policy coordination mechanisms. ASEAN needs to introduce proper schemes for mutual recognition of standards and regulatory harmonization to enable shifting responsibilities from national agencies to regional bodies while strengthening functional institutions.
The study also highlights the need for reforming some of ASEAN governance principles to keep pace with the expanding economic agenda and enhance institutional efficiency. This relates in particular to increasing flexibility in decision-making and financial contributions, and introducing proper feedback mechanisms and sanctions against non-compliance of members’ commitments. Human and financial resources for the ASEAN Secretariat must also increase considerably as their current level is largely inadequate to accomplish an institutional mandate, which has been expanding over the last decade, especially since the introduction of the ASEAN Charter in 2007.
Enhancing macroeconomic and financial stability
One important lesson from past financial crises is that policy frameworks overly designed for rapid growth can destabilize financial markets, damaging economic development. Prudent and coherent macroeconomic policies are instrumental in balancing the need to both sustain economic expansion and ensure overall economic and financial stability. And while national measures are always the first line of defense, the macroeconomic framework increases its regional dimension as national economic barriers are brought down over time, heightening the risk of contagion. Thus policy cooperation and coordination assume central importance in formulating strategies aimed at preventing economic and financial crises.
To increase resilience to macroeconomic shocks, financial stability should be a clear policy objective, with national authorities conducting economic and financial supervision using proper macroprudential tools and ensuring banking soundness through periodical monitoring and stresstests. Policies should ensure flexibility in adjusting to shocks, while developing strong external positions as self-insurance against financial crises and carefully monitor short-term capital flows to manage risks and volatilities. Regionally, authorities should establish an ASEAN Financial Stability Dialogue (including finance ministries, central banks, financial supervisors, and market regulators) and introduce a flexible mechanism to maintain stable exchange rates between regional currencies in times of stability, while providing flexibility in times of stress. ASEAN members should also develop ‘regional guidelines on effective capital control measures’ to assist authorities on deciding whether or not—in case of excessive short-term capital flows—capital controls are needed as an additional, temporary and well-targeted macroeconomic tool to help maintain economic and financial stability.
Supporting equitable growth
Coupled with social and demographic transformations, inequality is one of the most difficult challenges ASEAN faces. While development policies have largely reduced poverty and improved living standards, many people continue to live on less than US$2 a day and over recent decades Gini coefficients have generally worsened throughout the region. Improving economic convergence within and across members is a key ASEAN development challenge.
National policies are needed to draw in the marginalized, offering equal opportunities to all. Macro-level programs are important to narrow income gaps across the region, improving social cohesion and welfare. They must be accompanied by inclusive policies, introducing schemes that support SMEs, increase financial inclusion, and enhance governance and regulations to improve education and healthcare. A distinct set of policies is also needed to avoid falling into the middle-income trap, including measures aimed at promoting knowledge-led growth, R&D investment, and reducing business costs. ASEAN’s region-wide strategy to support equitable and inclusive growth is based on the Initiative for ASEAN Integration and the ASEAN Framework for Equitable Economic Development—which include support from the ASEAN-6 to CLMV countries. In addition to implementing these strategies it is important to establish an ASEAN Convergence Fund, which aims to mitigate the negative impact of regional economic integration initiatives on specific groups of people and sectors, while fostering growth in lagging regions. In particular, such fund could be created by enlarging the existing ASEAN Development Fund, entrusting qualified professionals for its administration.
Promoting competitiveness and innovation
The rise of the China, India and other emerging economies are increasingly pushing ASEAN to enhance its competitiveness especially with regard to the way production and distribution systems are being organized. And while ever more efficient logistics systems are needed to improve production efficiency, economic progress requires eliminating trade and investment barriers as well as increasing the free movement of production factors such as labor, capital, and information.
ASEAN economies show pronounced diversity in global competitive rankings depending on the presence and quality of institutions, economic and social infrastructure, macroeconomic policy, the business climate, corporate strategies, and production networks. Although many economies remain product and process imitators, in the next decades through proper investment in R&D and innovation most of them should be able to reach technological frontiers and build competitiveness in a number of non-industrial sectors, from high-yielding crops in tropical agriculture, to tourism, telecommunications, and finance, to name a few.
Policies that promote competitiveness and innovation focus on better social infrastructure, political institutions, and the environment for doing business. R&D investment is critical for technological advancement and innovation. It is also important to introduce common ASEAN product and governance standards to create a single market for the region. To complement national efforts, ASEAN should create its own brand—a “Made-in-ASEAN” product label. To this regard, establishing a regional agency for the certification and standardization of “Made-in-ASEAN” products will have a multiplier effect not only on industrial development, but also in terms of strengthening the ASEAN identity of firms and individuals. Among other agencies, the ADBI study suggests establishing an ‘ASEAN Competitiveness Institute’ to formulate a regional innovation strategy and construct a framework for a regional R&D policy based on accelerating technological diffusion and absorption in areas with large spillovers and exploiting science-R&D-innovation synergies in biotechnology and nanotechnology.
Protecting the environment and managing natural resources
Although natural resources are abundant across Southeast Asia, they are depleting rapidly as they are increasingly used for industrial production and to meet consumption needs—and when transformed into energy, most natural resources unavoidably aggravate environmental pollution. As ASEAN becomes an integrated production base by implementing the AEC, the lack of a unified regulatory regime for environmental protection may cause firms to gravitate to countries with weak environmental regimes, worsening overall environmental standards. The key challenges related to promoting sustainable development relate to balancing rapid growth while ensuring environmental stewardship; managing energy supply and demand; and handling urbanization and the expansion of the middle class. Following a 2010 ASEAN Blueprint that adopted ten priority areas for environmental protection, the Ministerial Meeting on the Environment introduced several agreements to lower carbon emissions, reduce greenhouse gases, manage water resources, and lower transboundary haze pollution.
While ASEAN resolutions are non-binding nationally, countries should proactively introduce longterm development plans that reflect decisions taken regionally and agree on an overall approach for mainstreaming “green growth” in national strategies. In particular, they should promote “green” products adopting common standards across the region and provide new impetus for joint-development of niche sectors. Overall, national policies should be focused on controlling pollution and solid waste, improving energy efficiency, providing safe water, and managing urbanization. Meanwhile, as ASEAN implements the AEC and becomes an integrated production area, policymakers should encourage policies that tax environmental “public bads” and eliminate harmful subsidies that encourage inefficient use of natural resources. They should also establish a region-wide regulatory regime protecting the environment, including the introduction of strict product and governance standards.
Pacific South America
As Southeast Asia completes a stage of its integration experiment, a new one is under way on the other side of the Pacific that will bring together economies on South America’s Pacific coast closer together and moreover to bring them closer to the dynamism of their Asia-Pacific through the Pacific Alliance. Mexico and Chile are forecast to show the best improvement in growth over the next 12 months, accelerating by 0.4 percentage points.
Oceania
The three economies of Oceania covered in this report show diverging fortunes. As discussed above, Papua New Guinea is expected to be the fastest growing economy in the region at close to 22 percent growth, mostly as a result of a sharp improvement in the external sector as well as continued robust consumption growth. For Australia, growth is expected to be at roughly the same pace as in 2014. However, the headline number masks some changes in the contribution to growth, a positive swing of 0.2 percentage points is expected in investment to make up for a decreased contribution from the external sector.
For New Zealand, growth is expected to slow by 0.2 percentage points, largely due to a decreasing contribution from investment to overall demand.
Northeast Asia
As a group, Northeast Asia is dominated by the massive economies of China and Japan, which combined, account for 80 percent of the sub-region’s economic weight. Over the next 12 months, Chinese Taipei is expected to improve its growth almost a 1 percentage point, while Korea and Hong Kong (China) will grow at roughly the same rate. How the current Occupy Central movement impacts growth in Hong Kong (China) will depend largely on how it lasts and the business community becomes concerned and begins to postpone investments.
The External Sector
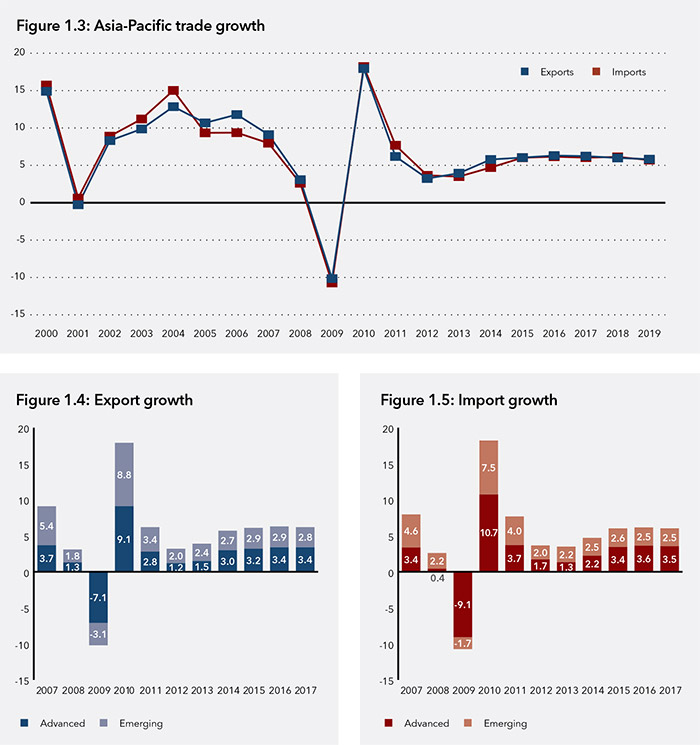
Trade growth in the region is forecast to remain relatively weak over the coming years. Export growth is forecast to be at an average of 6 percent a year between 2014 and 2019 compared to the 10.8 percent growth between 2003 and 2007.
As with the GDP story, there are also changes in where the growth is coming from. Prior to the GFC, the share of export growth between emerging and advanced economies was roughly 60-40 percent in favor of emerging economies; over the next 5 years the balance is reversed with advanced economies contributing roughly 55 percent a year to the region’s total export growth.
On the import side, prior to the crisis, emerging economies accounted for, on average, 52 percent of the region’s import growth. Looking ahead over the next five years, the expectation is that they will account for around 42 percent of the region’s import growth.
Another point that has been continuously made is the changing composition of growth. With consumer demand relatively weak in traditional markets such as the US and the EU, the expectation is that either domestic demand will have to take up the slack or new markets will need to be found.
Current Account Balance
The transpacific current account balance, for long a concern, remains muted. Towards the end of the forecast period however, the imbalance is beginning to reach the same levels in US dollar terms. In terms of percent of GDP, the imbalance remains manageable: the US current account deficit is at 2.8 percent of GDP, while China’s surplus is at 3 percent of GDP.
In reference to Figure 1.6, presenting the data by sub-region masks over substantial differences in current accounts, especially over this long time period. The imbalance in terms of percentage of GDP reached its zenith in 2006. Within Southeast Asia, Indonesia has since moved from running a current account surplus to a deficit accounting for the sub-region’s significantly reduced contribution to the surplus side.
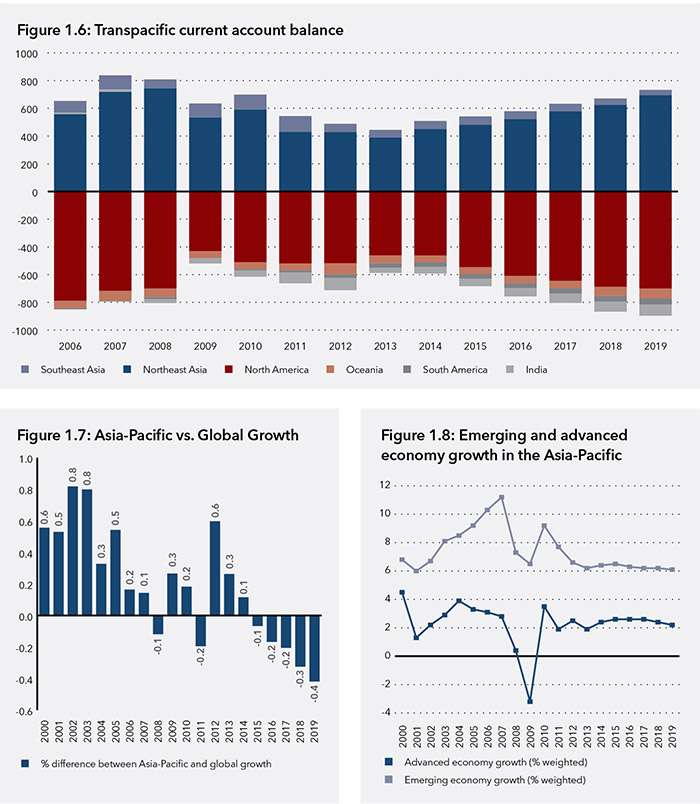
In looking at the imbalance issue through a transpacific lens, it misses one of the central changes that has taken place in the world economy. Germany has moved from running a current account deficit in 2001 to running the largest surplus of any major economy in the world, almost US$100 billion higher than China’s in 2013, and in percentage terms, at 7.5 of GDP, close to those run by China in the run up to the GFC.
The Future of Growth in the Asia-Pacific
As the global economy enters into a ‘new normal’ of slower growth, there are questions on whether the Asia-Pacific can continue its role as the anchor of global growth. For the first decade of the 21st century the Asia-Pacific grew at around 0.4 percentage points higher than the world economy. However, for the second decade, the forecast for the region is either at par or below global growth. Of concern is that the differential is on an increasing trend, calling into question the future of the region as the anchor for global growth.
The slowdown in regional growth should not come as a surprise. Over the past 25 years, many regional economies have graduated from being low income to middle income economies and a few are now in the high income bracket. However, the risk for those middle income economies is that they enter into the so-called middle income trap and are unable to graduate to the high income level.
For the period 2000-2009, the emerging economies of the region grew at an average rate of around 8.1 percent while the advanced economies grew at around 2.1 percent a year.
For 2010-2019, the forecast is for emerging economies to grow at 6.8 percent and advanced economies at 1.9 percent. While growth for both groups is slower, the reduction in growth for emerging economies of 1.3 percentage points is far more significant.
Balanced Growth
In addition to the need to boost growth, a lot of emphasis is being placed on the composition of growth, i.e. to make it higher quality and more balanced. In 2009, a PECC taskforce used a simple simulation to estimate the magnitude of changes to the pattern of aggregate demand to avoid the excess imbalances in the region. The basic assumption was that growth in the pre-GFC was imbalanced, driven by excessive consumption in the US facilitated by cheap credit. The PECC work attempted a simple simulation exercise to see if the growth rates prior to the crisis could be maintained by redistributing where growth came from, among different regional economies. The basic underlying assumption was to keep the US current account deficit at 3 percent of GDP rather than the 6 percent that it reached in 2006. A few key points emerged from the study: a number of surplus economies in East Asia could sustain their growth rates in the face of declining external demand by increasing either consumption or investment, while the US needed to decrease the percentage share of private consumption and increase exports.
Any assessment at this current juncture needs to come with some caveats. The first is that stimulus policies adopted in response to the crisis remain in play. The second is that these are snapshots of two specific points in time – that should represent the general structure of the region’s economies but there may be reasons why 2007 and 2014 are not necessarily representative. The third is that the GDP includes significant statistical discrepancies, in some instances larger than the actual components of GDP – namely, consumption, investment, government expenditure and net exports.
Moreover, while the balance of aggregate demand has changed, this has brought with it some additional challenges that policy makers need to confront. Some of these structural problems are most severe in the region’s two largest economies – China and the United States.
The core thesis of the rebalancing was whether the region – or indeed the world – could maintain the kind of growth rates from the pre-crisis period at a time when demand in advanced economies was likely to be low as consumers rebuilt their balance sheets. The suggested answer was yes, but there needed to be a much stronger emphasis on domestic demand in the region’s emerging economies.
China has been successful in maintaining impressive rates and indeed has been managing gradual change in the composition of aggregate demand. However, it has seen significant investment growth that has been holding up domestic demand rather than an accelerated consumption. In the case of the United States, consumption has maintained, if not increased, its significance in the economy while both government expenditure and investment have declined in importance. The positive news is that net exports are now less of a drag on the economy.
Of concern is the slow progress being made in the region’s third largest economy – Japan, where consumption remains relatively weak. While Japan’s’ trade surplus has indeed decreased, this has mostly been due to the shutdown of its nuclear reactors which has precipitated a need to import more energy.
However, the region’s two largest economies, China and the United States, are still facing a number of challenges that make an assessment at this stage early. As part of the stimulus measures in response to the crisis, investment in China has risen from the already high baseline in 2007 of around 39 percent to 46 percent of GDP. Without this stimulus it is probable that growth would have been much slower in recent years, the challenge now is weaning the economy off this reliance on investment and finding alternative engines of growth. Conversely, investment as a percentage of US GDP has come down and aggregate demand has been supported by rising consumption and improvements to net exports.
Figure 1.9 shows the estimated changes to the composition of aggregate demand in a number of Asia-Pacific economies between 2007 and 2014. The most obvious change that has taken place over the past seven years is the reduction in the importance of net exports to most economies. This should be welcomed given the rebalancing thesis outlined above. However, it is not at all clear whether this represents a structural shift in economies or simply a reaction to the lack of demand for exports from key markets.
Consumption
One of the key questions being asked is the extent to which growth for the region’s middle income economies is shifting from being export and investment-driven towards domestic demand – especially consumption. The forecast for 2014- 2019 shows a considerable increase in the annual growth of private consumption. Consumption in the Asia-Pacific is forecast to growth by approximately 5.9 percent a year over the next few years or an increase in US dollar terms, around US$1.4 trillion in 2015 and US$1.6 trillion in 2016. Over the medium-term, consumption in the region is forecast to increase from 2014 to 2019 by a total of US$6.8 trillion.
While much of the growth in consumption expenditure will continue to come from the region’s more advanced economies – the United States alone accounts for around 43 percent of total Asia-Pacific consumption – over the next 5 years, the region’s emerging economies are forecast to account for an increasing percentage of consumption. In 2013, they accounted for 28 percent of total consumption expenditure; by 2019, emerging markets are expected to account for 32 percent.
As seen in Figure 1.10, at the moment, food and drinks account for around 31 percent of consumption expenditure in the region’s emerging economies, compared to 12 percent in higher income economies. This is likely to change as more consumers in emerging economies become middle class.
Another category with significant differential is expenditure on healthcare. On average, consumers in emerging economies spend around 6 percent of their income on health, while those in higher income economies around 11 percent. As incomes increase in emerging economies and a smaller proportion is spent on food, consumers are likely to spend more on health similar to consumers in higher income economies.
The last category of expenditure where these is a marked difference in expenditure is miscellaneous goods and services. This includes what are considered luxury or nonessential items such as hairdressing salons and personal grooming; appliances and products for personal care; jewelry and watches, and insurance. On average, 14 percent of consumer expenditure in higher income economies is spent on this category compared to just 8 percent in middle income economies.
PECC’s survey results in Chapter 3 show that the region’s policy community thinks that consumers in emerging markets are likely to spend more on electronics, cars, household appliances – and other items associated with becoming a middle class consumer compared to their counterparts from more advanced economies. This opens significant opportunities for the corporate sector to switch from a focus on advanced economies to demand from an emerging middle class in the region.
Investment
While advanced economies are driving consumption growth in the region, the opposite is true in terms of investment/gross capital formation. Investment in the region is set to increase by US$833 and US$916 billion in 2015 and 2016 respectively. Of this, emerging economies will account for approximately 55 percent.
Much has been made of the need for increased investment in infrastructure both globally as well as for the region. Over the past 25 years, the investment as a percentage of GDP has been volatile. For the ASEAN-5 members, investment as a percentage of GDP was around 35 percent a year in the run up to the 1997-98 crisis, roughly the same as emerging and developing Asia. After 1997-98, the level of investment dropped significantly to around 25 percent of GDP, and even though it has been on an upward trend it remained well below the whole of developing Asia. The numbers for developing Asia are skewed by the large amount of investment in China where investment accounts for above 45 percent of GDP.
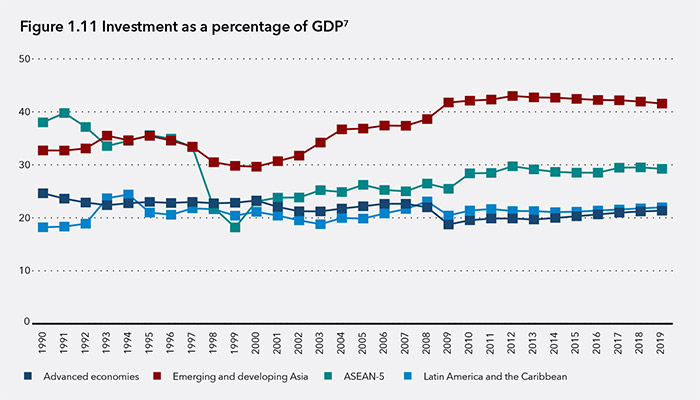
Investment in Latin America and the Caribbean is at a similar level to those of advanced economies at an average of only 20 percent of GDP, indicating an area where policy initiatives could help to increase investment and boost growth.
The prescription for increasing growth above current baseline forecasts will depend on the individual circumstances in each economy. While increased middle-class consumption in emerging Asia-Pacific economies holds much potential there are some challenges ahead peculiar to the region which is home to the most populated economies in the world.
If all APEC economies were to have same number of cars as their counterparts in OECD economies an additional 910 million cars would be on the road (in perspective, car sales per year in APEC region are about 35 million). If all APEC citizens were to fly at the same rate as OECD members there would be an additional 2.2 billion people flying a year and if all APEC citizens spent the same on healthcare as OECD there would be an additional US$7.5 trillion spent on healthcare. The resource implications are enormous.
Another challenge arises from the internet age in which consumers have the ability to know and desire the same things that their counterparts have in other economies – even if their income levels are significantly smaller.
Overcoming both of these challenges will require changes in both business models as well as the production process if the region is to meet the growing expectations of its population.
Innovation and Growth
New Actions Needed for the Growth Strategy
As highlighted in the previous section, regional growth is expected to moderate over the coming years and likely to be significantly lower than the levels achieved by the region in the lead up to the GFC. This ‘new normal’ has put significant weight on the need to take actions to support stronger regional and global growth.
The G20 has set a target of increasing baseline economic growth by 2 percentage points by 2018 as part of its commitment to addressing this concern. This is not for growth for growth’s sake, but to generate the jobs needed and ensure a sustained rise in living standards and achieve a more balanced global economy. While G20 members account for 85 percent of global economic output, half of them are also members of APEC, most of which are among the fastest growing economies in the world.
While the G20 set out its agenda for stronger, more sustainable and balanced growth in the context of fiscal sustainability, APEC members set out their own strategy for balanced, inclusive, sustainable, innovative and secure growth. As shown by the results of both the 2013 and 2014 PECC survey, opinion-leaders are less than impressed with the actions taken thus far to implement the growth strategy.
The approach taken by the G20, to set a specific growth target followed by the individual action plans of economy, echoes that of APEC in respect to the Bogor Goals. While the details of the G20 plans are not yet known they will focus on four key areas:
- Reducing barriers to trade;
- Increasing competition;
- Creating more employment opportunities; and
- Improving infrastructure through increased investment.
Need to Boost Productivity
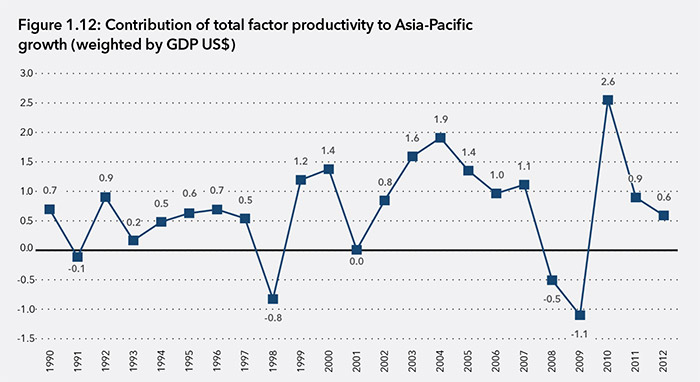
Over the past quarter of a century, the Asia-Pacific has posted impressive growth rates. However, there are a number of bottlenecks to growth that need to be addressed. One of the concerns that the region faces is the potential decline in total factor productivity (TFP). China, as the chair of APEC for 2014, has put emphasis on the challenge of the ‘middle income trap’ that many emerging economies in the region are facing. Figure 1.12 shows the contribution of TFP to GDP growth for the Asia-Pacific. During the boom years of 2000-2007 the average contribution of TFP was around 1.1 percent, while from 2011 to 2012, it has dropped to 0.6 percent.
Some important messages arise from a look at the contribution of factors of production to growth in the region:
- On average capital investment has contributed the most to growth of emerging markets – 20 percent more than to growth in advanced economies.
- On average labor composition has contributed much less to the growth of emerging markets than to advanced economies – almost 10 percent less.
- Investment in ICT has contributed much more to advanced economy growth than for emerging markets – 33 percent compared to 12 percent.
Over the past couple of decades, investment in ICT has contributed 0.6 percentage points to advanced economy growth and 0.7 to emerging economy. However, in terms of percentage contribution, ICT investment for emerging economies accounted for on average 12 percent of growth compared to 33 percent for advanced economies.
Moreover, economic growth for the emerging economies of the region has been overly reliant on one factor of production – investment in non- ICT capital – which contributed on average 3.4 percentage points to their growth or 60 percent. These numbers are only slightly distorted by the weight of China among the region’s emerging economies and the huge amount of investment that took place after the crisis. However, discounting that extraordinary period, investment in non-ICT capital contributed on average 2.9 percentage points to the Asia-Pacific emerging economy growth during the 1990s.
In terms of the contribution to growth from labor – whether in quantity or composition, the contribution to emerging market growth has been much less volatile than it has been for the advanced economies of the region. As one would expect, labor quantity contributed significantly more to growth in emerging economies around 0.8 percentage points to GDP growth compared to 0.3 for advanced economies. However, the contribution from labor force composition was significantly higher for advanced economies 0.3 percentage points compared to 0.16 for emerging economies.
Improving Productivity
Indeed, the Conference Board’s 2014 Productivity Brief8 warns that the growth rate of TFP is less than zero for the global economy. Their analysis suggests that this has been caused by slowing demand in recent years, which caused a drop in productive use of resources that is possibly related to a combination of market rigidities and stagnating innovation.
The Innovation Challenge
Innovation is one of the five dimensions of the growth strategy that APEC Leaders adopted in response to the crisis. Progress on the strategy is due to be reviewed in 2015. As defined in the 2010 APEC Leaders’ Declaration, the task was to ‘create an economic environment that promotes innovation and emerging economic sectors.’ APEC Leaders put an emphasis on the enabling environment for innovation rather than any specific output that might arise from it.
The Global Innovation Index, which is a collaborative effort among Cornell University, INSEAD, and the World Intellectual Property Organization (WIPO) as co-publishers, and their Knowledge Partners, attempts to measure innovation for almost all economies. The Global Innovation Index has two sub-indices— the Innovation Input Sub-Index and the Innovation Output Sub-Index—each built around a number of pillars. The Innovation Input Sub-Index which is composed of 5 pillars provides a useful measure of the economic environment, and these are:
- institutions;
- human capital and research;
- infrastructure;
- market sophistication; and
- business sophistication.
As shown in Figure 1.19, there is considerable variability among the economies’ rankings in terms of the environment they provide to foster greater innovation. While the region includes some of the best environments in the world for innovation, it also includes economies where much more could be done.
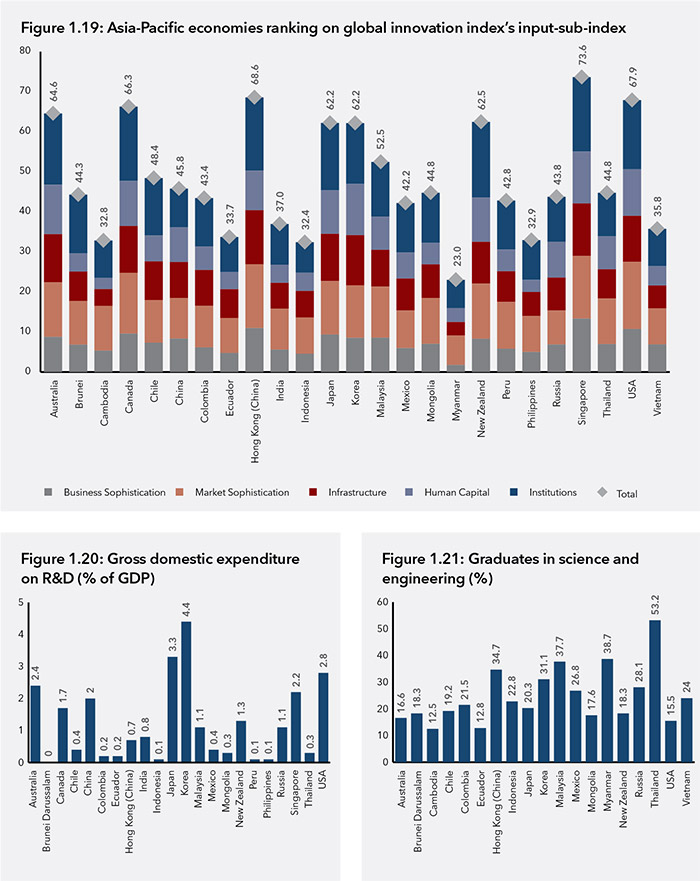
The pillars on which more could be done are business sophistication and human capital on which the region has the lowest average score compared to other pillars.
Human Capital
The human capital pillar captures 12 indicators including: education; tertiary education; and research and development (R&D). Looking at just two indicators – gross domestic expenditure on R&D; and the percentage of graduates in science in engineering – there is much that regional cooperation could offer in terms of improving the environment for innovation. For example, while the average gross expenditure on R&D in the region is about 1.2 percent, some spend significantly above this, like Korea at 4.4 percent. In terms of the percentage of graduates in science and engineering, the average for the region is around 24 percent but some economies like Thailand and Hong Kong (China) are significantly above the average. Through processes like APEC, regional economies could share experiences on how and why they chose the policies that have led to these differences as well as the ultimate results they have had.
Business Sophistication
Another metric of innovation is the extent to which the business and academic sectors collaborate on research. The data here comes from the World Economic Forum’s Executive Opinion Survey which asked: “To what extent do business and universities collaborate on research and development in your country?” The score is obtained from ‘1 = Do not collaborate at all’ to ‘7 = Collaborate extensively.’ While the regional average is high at 4.1, there is significant room for improvement. This would be an area where APEC’s classic approach to regional cooperation of experience sharing would be valuable and give focus to its new Policy Partnership on Science, Technology and Innovation.
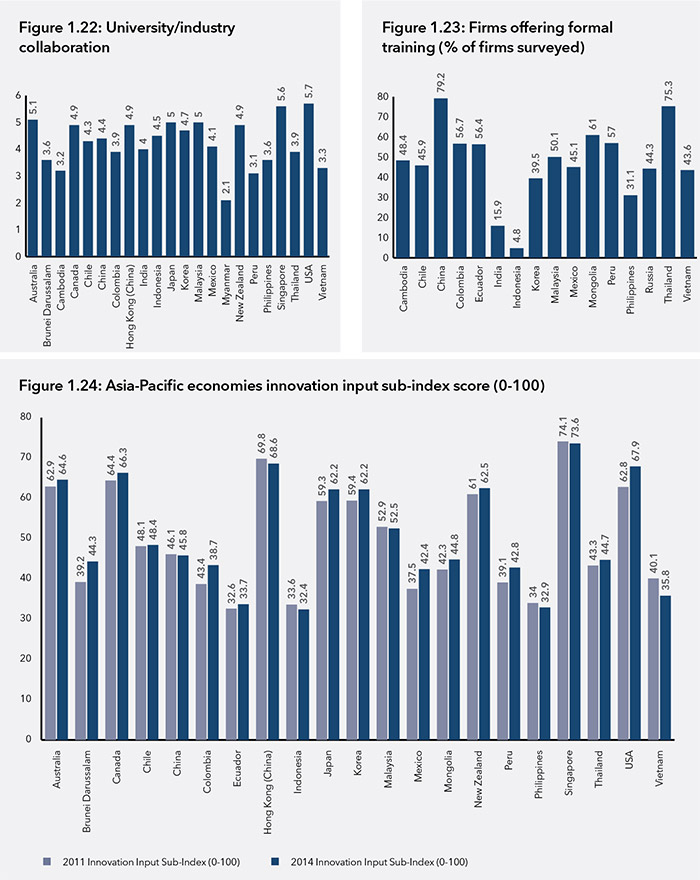
The idea of continuous education and vocational training has become a central topic for policymakers. The lack or shortage of talent available was ranked as the tenth highest risk to growth in the region in this year’s State of the Region survey and in 2013, affordable education to provide workers with the skills required to compete in a global marketplace was rated as the most important issue for which APEC Leaders should set an aspirational target. As shown in Figure 1.23, some economies like China and Thailand have placed strong emphasis on firms offering training to employees while many other economies are well behind.
Using the Global Innovation Index’s ranking of economies, between 2011 and 2014, fourteen out of the 21 Asia-Pacific economies covered by the index improved their score for the innovation input sub-index. It should be noted that the index pulls together data from multiple sources, not all of which are available on an annual basis. However, the index does provide a useful basis on which to begin a discussion on both how the region has done in terms of improving the environment for innovation as well as what kind of policy initiatives might be adopted in the future.
The Future of Growth in the Asia-Pacific
Although the economic outlook remains relatively positive and there are reasons to be optimistic about the future of growth in the region, much needs to be done if the Asia-Pacific is to continue on the path it has set out over the past few decades. The region includes not only the world’s three largest economies but also many of the world’s fastest growing economies.
A quarter of a century ago, in recognition of the growing interdependence of this region, the APEC forum was founded. Five years later the region’s leaders set out a course of actions to ‘enhance the prospects of an accelerated, balanced and equitable economic growth not only in the Asia- Pacific region, but throughout the world as well,’ in the Bogor Declaration. Over the past 25 years much there has been much progress but as outlined in this chapter there significant challenges ahead. The composition of growth is changing; middle class consumption would not only be a driver of growth but more importantly, meets the aspirations of people for a better life. A renewed focus on opening up and economic integration that has been behind much of the past two decades of growth is needed – as will be discussed in the next chapter.
<< Previous
Next >>